ISSN 1941-7020
© 2009 Science Publications
Corresponding author: J. Sghaier, Department of Energy Engineering, National School of Engineering of Monastir, Tunisia, Avenue Ibn El Jazzar, 5019 Monastir, Tunisie
High Temperature Convective Drying of a Packed Bed with Humid
Air at Different Humidities
1
J. Sghaier,
2S. Messai,
3D. Lecomte and
2A. Belghith
1
Department of Energy Engineering, National School of Engineering of Monastir, Tunisia,
Avenue Ibn El Jazzar, 5019 Monastir, Tunisie
2
Laboratory of Energetic, Heat and Mass Transfer, Department of Physical Sciences,
Faculty of Sciences, El Manar University, 1060, Tunis, Tunisie
3
Research in Albi on Particle Solids, Energy and Environment,
Ecole des mines d’Albi-Carmaux, Campus Jarlard-81013 Albi CT Cedex 09, France
Abstract: Problem statement: Drying a packed bed of porous particle at high temperature with varying humidity of hot air is an attractive process. Many researches on experimental and simulation on a fixed bed drying at low and average temperature are proposed. Few studies showed drying at high temperature with humid air or using superheated steam. The latest is compared to dry air. Approach: In this study, we present an experimental and numerical study of humid air drying of a fixed bed of moist porous alumina particles. The air velocity, the air temperature and the vapor pressure were varied from 1.7-2.3 m sec−1, 120-160°C and 0.1-0.6 bar, respectively and the experiments were performed at atmospheric pressure. Then a mathematical model describing heat and mass transfer during drying is developed. This model is based on the averaging volume approach using two scale changes. Results: From the experimental works, the solid temperature and the bed moisture content have been presented at different drying conditions. The previous results show that an increase in humidity leads to an increase of the wet bulb temperature and a decrease in the drying time. At the same drying temperature, the variation in the gas velocity affects also the drying time. In addition, we note that the drying time increases if the bed depth increases. The predicted results deduced from the developed model were compared with the experiment. Conclusion: The experimental and predicted results obtained from this study describing drying of a packed bed illustrate clearly the effect of the air humidity on the drying kinetics.
Key words: drying, humid air, high temperature, packed bed, averaging volume
INTRODUCTION
In industries, a large part of energy consumption is due to drying[1]. Therefore, minimizing this consumption is of great importance. In this context, during this decade, we note the affinity on industrial scale towards the use of the superheated steam drying process for consolidated materials or granular mediums. Moreover, it has been shown that superheated steam drying could replace air drying in the industry process except for applications involving the drying of thermally sensitive materials. Besides, drying is one of the most important operations in the food and chemical products. Therefore solid drying in a packed bed with Industries especially for the storage of granular circulation of a gaseous thermal agent is complex, the
regime is unsteady and fundamental transfer phenomena appear simultaneously.
in the particle. Chen et al.[4] integrated a single particle model with a two-phase hydrodynamic to simulate the drying of coal in a fluidized bed with superheated steam.
Other studies investigated fixed bed steam drying of foodstuff by dividing the bed in three zones (dry zone, drying zone and wet zone) limited by two interfaces[5]. A dry front separates the dry zones from the ones and a wet front partition the drying and wet zones. The moisture content and temperature of the dry zone are equal to their equilibrium moisture content and steam temperature, respectively
Sghaier et al.[6] developed a model describing heat and mass transfer during drying of a granular bed in superheated steam. The mathematical model is developed using two changes of scale. Convective heat transfer is assumed between the granular bed and steam. To take into account the thermal non-equilibrium between the particles and the fluid phase a two-temperature macroscopic model is used to describe heat transfer. The mass transfer is introduced in the form of drying kinetics deduced from a single particle model.
On other way, many researchers have developed mathematical models for humid air drying especially for low and average temperature. Arnaud and Fohr[7] proposed a partial differential equations model for the slow drying of a deep bed at low temperature. They proved the existence of a drying front which moves in the granular media without distortions. Sözen and Vafai[8] studied the transient forced convective condensing gas flux through a packed bed. The non validity of local thermal equilibrium assumption between the solid and fluid phases is assumed. They examined two different types of boundary conditions. The condensation in vapor phase has been also studied. Mhimid et al.[9] presented a two temperatures model for the drying of a cylindrical and granular bed with imposed hot air flux and conductive heat flux at the wall. The time-space evolution of temperature has been also studied. Ratti and Mujumdar[10] developed a model to simulate batch drying . They studied numerically the effect of airflow reversal for the batch drying of foodstuff in a deep bed. Wang and Chen[11] proposed a model of fixed bed drying of moist porous particles. They considered the distribution effects of moisture content, temperature and gas pressure of the particle. Kato et al.[12] studied a packed bed dryer using air as particles. They divided the bed into series of thin layers. The objective of this study is to present the experimental study of drying a packed bed with humid air at high temperature with different humidity. The
influence of the temperature and velocity of the drying air as well as the bed depths on drying curves has been investigated. Then, we present a fixed bed model describing heat and mass transfer during drying a packed bed of porous particles. The predicted results from the packed bed model were compared to the experimental data.
MATERIALS AND METHODS
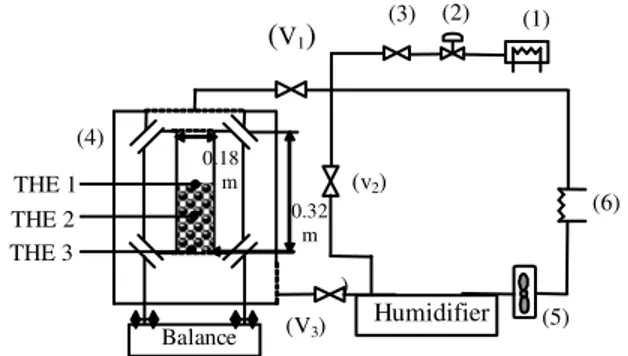
Experiment setup: The experimental device consists of a thermally isolated drying chamber containing the experimental cell, a steam generator, a hot gas heating system, a closed loop for the circulation of the drying agent and a data acquisition and control unit Fig.1. Initially designed for steam drying, the system allows using humid air as drying agent. For technical reasons-difficult control of air leakage in the circuit-superheated steam drying experiments could not be performed.
The circulation of the drying agent is realized by a fan. Gas flow rate and velocity in the chamber are controlled by adjusting the speed of the fan. A control system allows setting the gas temperature and vapor pressure. Water vapor is generated continuously in the steam generator and injected in the closed loop through a control valve. The pressure is maintained slightly above atmospheric pressure using a pressure control valve.
The drying cell as shown schematically in Fig.1 is an opaque aluminum cylinder. The inside diameter and the length of the cell were approximately 0.18 and 0.32 m, respectively. The drying agent flows through the drying chamber and the experimental cell containing a fixed bed of alumina particles. At the inlet of the cell,
(5)
(V1)
(4)
(v2)
)
(6) (1) (3)
(2)
Balance THE 2
THE 3 THE 1
0.32 m
Humidifier 0.18
m
(V3)
Fig. 1: Experimental set up. (1): Steam generator; (2): Pressure control valve; (3): Steam flow rate valve; (4): Convective cell; (5): Fan; (6): Hot gas heating system; Weight: v1 and v3 closed v2
opened; Normal operation: v1 and v3 opened v2
a grid ensures a good distribution of the drying agent. Thermocouples are placed at different positions in the cell to measure the temperature of the alumina beads. Periodically, the cell is automatically moved down and supported by a stand connected to the weigh scales. The stand is heated at its base to avoid condensation. During the weighing period, the drying agent is by-passed (thus closing valves V1 and V3 and opening V2, (Fig. 1).
For humid air drying with low relative humidity, a standard humidifier was used.
Experimental procedure: Porous particles alumina beads were previously immersed in distilled water for 24h to insure full saturation within the sphere and preheat them at a temperature just below the saturation temperature. During the packing of the bed in the experimental cell, thermocouples were introduced in the bed at the particle surface in different axial positions.
Meanwhile, the drying equipment was heated to a desired experimental temperature and the steam generator was activated. Steady state conditions were reached. Then the experimental cell was inserted in the drying chamber (the drying agent was circulated through the by-pass during this operation). The data acquisition system was started immediately after closing the chamber door, with continuous measurement of the solids temperatures at different depths in the bed and discontinuous measurement of the mass loss of the bed, using the previously described experimental protocol. The experiment was stopped when the mass of the bed remained constant.
Mathematical model: The mathematical model describing the drying is developed in a previous study in the case of superheated steam[6]. This model is based on the averaging approach tacking into account the non validity of the thermal equilibrium and using the following assumptions:
• The porous medium is homogeneous and isotropic
• the bed porosity is uniform
• The compression work and viscous dissipation are negligible
• The dispersion and the tortuosity terms can be modeled as diffusive flux
The macroscopic equations governing heat and mass transfer in the packed bed are:
Energy conservation in the gas phase g:
(
)
(
)
g
g g g g
pg g g g pg g
g g s
geff g pg g s
g s
gs g s
T
C V C T .
t
T m C T T
h A T T
•
∂
ε ρ + ρ ∇ = ∇
∂
λ ∇ − −
− −
(1)
Energy conservation equation in the solid phase s:
(
)
(
)
(
)
s
s s s
ps s seff s
g s
gs g s
T
1 C . T
t
m H• h A T T
∂
− ε ρ = ∇ λ ∇
∂
− ∆ + −
(2)
m
•
= The evaporation rate A = The specific surface
λseff and λgeff = The effective thermal conductivity of
solid and gas phases, respectively hgs = The convective heat transfer coefficient
(solid-gas) expressed as:
geff gs
Nu h
d
λ
= (3)
Where Nu is the Nusselt number
Initial Conditions: Initially temperatures and moisture content are constant:
(
)
(
)
g s
g s i
T 0, r, z = T 0, r, z =T (4)
(
)
iX 0, r, z =X
(5)a
Thermal boundary conditions:
• The lateral surface of the bed is adiabatic
• At the inlet of the cylinder, the temperature of the gas is assumed constant, the solid and gas temperatures are related by:
(
)
s
g s s
seff 0 s g
T
t, r, 0 h T T
z
∂
−λ = −
∂ (6)
• Solid phase:
(
)
s
g s s
seff 1 s g
T
t, r, H h T T
z ∂
−λ = −
∂ (7)
• Gas phase:
(
)
g g geff
T
t, r, H 0 z
∂
−λ =
∂ (8)
Dying kinetics: The phenomenon of water evaporation and mass transfer in a solid particle and the surrounding gas phase is expressed by drying kinetic. The evaporated rate m
•
is given by:
(
)
ss
X
1 m
t
•
∂
− − ε ρ =
∂ (9)
m
•
= A×Fm
Where:
A = The specific surface
Fm = The mass flux obtained by the numerical
resolution of a single particle model[13] describing drying
Correlations for the later are given from a set of numerical tests carried out for various values of temperatures and drying fluid velocity. In a first step, correlations of maximum mass flux and moisture content are expressed as a function of the gas temperature for a given gas velocity. In a second step, the gas temperature is kept constant and we vary the gas velocity. With combination of the two functions, correlations of mass flux and moisture content are given function of the gas temperature and velocity in the form:
(
)
(
d1)
1 g 1 1 g
max
1
a T b c V
F
e
−
= (10)
Where:
Fmax = The mass flux at the constant rate period
F1max, = The mass flux which corresponds to the point
of intersection of two sub-periods of the falling-rate period is given by:
(
)
(
d 2)
2 g 2 2 g
1max
2
a T b c V
F
e
−
= (11)
The equilibrium moisture content Xeq is a function
of the gas temperature:
( )
b3eq 3 g
X =a T (12)
Xcr, the critical moisture content indicating the start
of the falling-rate period is given by:
(
4 g 4) (
3 g 3)
cr
3
a T b c V d
X
e
− +
= (13)
X1 is the moisture content which corresponds to the
point of intersection of two sub-periods of the falling-rate period given by:
(
b5)
(
)
5 g 4 g 4
1
4
a T c V d
X
e
+
= (14)
ai, bi, ci, di and ei are coefficients which depend of the
drying agent and the medium used. The values of different constants of correlation are shown in Table 1.
Final correlations of mass flux are:
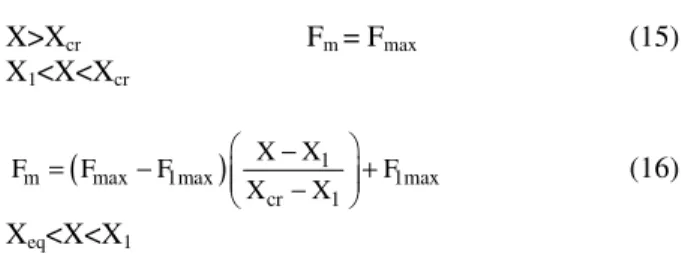
X>Xcr Fm = Fmax (15)
X1<X<Xcr
(
)
1m max 1max 1max
cr 1
X X
F F F F
X X
−
= − +
− (16)
Xeq<X<X1
Table 1: Values of different constants for the drying kinetics of single particles
Constant Humid air (Pv = 0.6bar) Humid air (Pv = 0,1bar)
a1 2.31 10-5 2.3 10-5
a2 8.62 10-6 8.66 10-6
a3 26.95 10-3 27.533 10-3
a4 1.92 10-4 1.89 10-4
a5 0.439 102 0.439 102
b1 8.4 10-3 8.4741 10-3
b2 0.44 10-2 0.41 10-2
b3 -42.9 10-2 -46.91 10-2
b4 4.9 10-2 5.24 10-2
b5 -141.1 10-2 -139.81 10-2
c1 13.37 10-4 13.39 10-4
c2 0.054 10-4 0.051 10-4
c3 6.2 10-3 5.98 10-3
c4 -1.58 10-3 -1.52 10-3
d1 26.8 10-2 26.91 10-2
d2 12.99 10-2 13.89 10-2
d3 2.4 10-2 2.3890-2
d4 1.01 10-2 0.987 10-2
e1 9.95 10-4 9.881 10-4
e2 4.92 10-4 4.89 10-4
e3 29.76 10-3 29.54 10-3
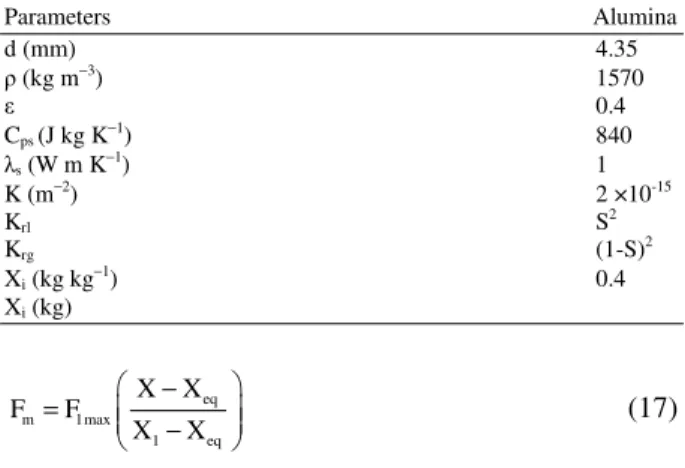
Table 2: Properties of the solid particles used in the simulations and numerical parameters
Parameters Alumina
d (mm) 4.35
(kg m−3) 1570
0.4
Cps (J kg K−1) 840
s (W m K−1) 1
K (m−2) 2 ×10-15
Krl S2
Krg (1-S)2
Xi (kg kg−1) 0.4
Xi (kg)
eq
m 1max
1 eq
X X
F F
X X
− =
− (17)
The resolution of the system of equation governing heat and mass transfer during drying packed bed is based on the finite volume method[14], with a regular mesh. A gauss siedel iterates method was used.
The properties of the alumina particle used in the simulation are shown in Table 2.
RESULTS AND DISCUSSION
In the series of experiments, the velocity and temperature of the drying air were varied from 1.7 to 2.3 m sec−1 and 120-160°C, respectively. On Fig. 2, we present the evolution of the bed moisture content and the solid temperature for two values of vapor pressure.
These experiments were carried out for the same velocity and drying temperature. A decrease of the temperatures in the bed is observed at the beginning of the drying process due to the heat transfer between the preheated alumina particles and the colder cell. Then the solid temperature reaches the wet bulb temperature.
The later depends on the drying conditions. For example, for a vapor pressure of 0.6 bar the wet bulb temperature is about 90°C whereas it falls to 58°C for 0.1 bar of vapor pressure. This phase lasts between 15 and 9 min depending on the drying conditions. Next the air temperature raises regularly, the falling rate period starts. When the solid temperature reaches the inlet temperature of the drying agent, the end of the drying process is reached. We note also a good consistency between the temperature curves and the observed mass For drying with low vapor pressure, the constant rate period is much shorter (less than 600 s) and hardly observable from the moisture curve, although the measured temperature in the bed seems rather steady.
0 500 1000 1500 2000
80 90 100 110 120 130 140
0.0 0.1 0.2 0.3 0.4
te
m
p
er
a
tu
r
e
(°
C
)
time (s)
b
ed
m
o
is
tu
re
c
o
n
te
n
t
(k
g
/k
g
)
T
em
p
er
at
u
re
(
°C
)
Time (sec)
B
ed
m
o
is
tu
re
c
o
n
te
n
t
(k
g
k
g
−
1)
(a)
0 500 1000 1500 2000
40 60 80 100 120 140
0.0 0.1 0.2 0.3 0.4
te
m
p
er
a
tu
re
(
°C
)
time (s)
b
ed
m
o
is
tu
re
c
o
n
te
n
t
(k
g
/k
g
)
T
em
p
er
a
tu
re
(
°C
)
Time (sec)
B
ed
m
o
is
tu
re
c
o
n
te
n
t
(k
g
k
g
−
1 )
(b)
Fig. 2: Drying kinetics during humid air drying ((a): Pv = 0.6 bar and (b): Pv = 0.1 bar): Tg = 140°C,
Vg = 2 m sec
−1
, d = 4.3 mm, Z = H/2 and H = 8 cm
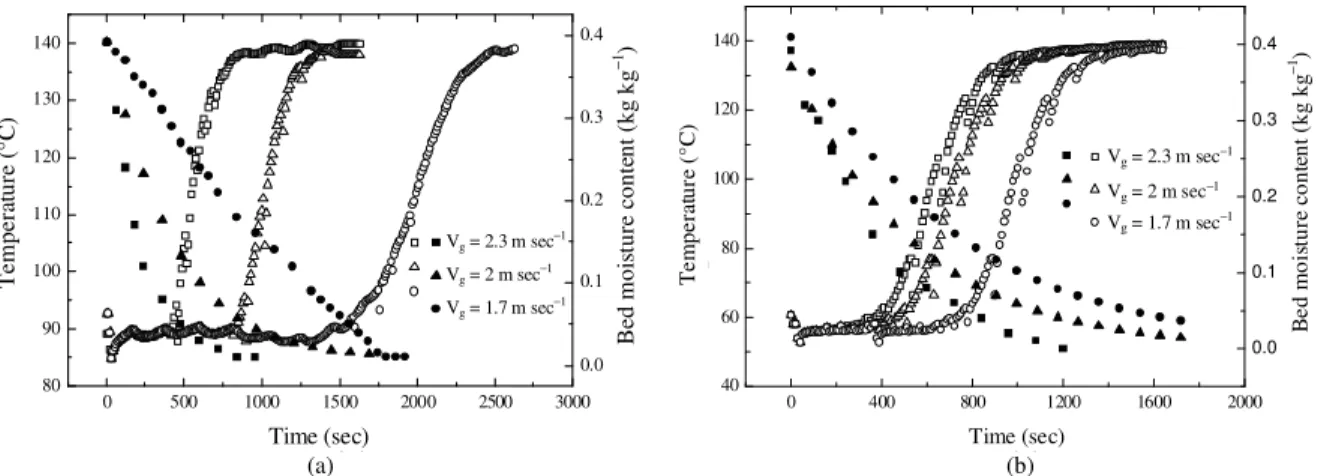
This is probably due to the more sensitive effect of external mass transfer. Figure 3 also shows that the drying agent velocity affects the time required to reach the drying temperature. When the drying agent velocity is increased for the same drying temperature, the convective heat transfer coefficient also increases and heat and mass transfers are enhanced.
0 500 1000 1500 2000 2500 3000 80 90 100 110 120 130 140 0.0 0.1 0.2 0.3 0.4 te m p er a tu re ( °C ) time (s) b e d m o is tu r e c o n te n t (k g /k g )
Vg=2.3 m/s V
g=2 m/s Vg=1.7 m/s
a
Vg = 2.3 m sec−1
Vg = 2 m sec−1
Vg = 1.7 m sec−1
Time (sec) T em p er at u re ( °C ) B ed m o is tu re c o n te n t (k g k g − 1) T em p er at u re ( °C )
0 400 800 1200 1600 2000
40 60 80 100 120 140 0.0 0.1 0.2 0.3 0.4
Vg=2.3 m/s Vg=2 m/s Vg=1.7 m/s
te m p er a tu r e (° C ) time (s) b ed m o is tu re c o n te n t (k g /k g ) b
Vg = 2.3 m sec−1
Vg = 2 m sec−1
Vg = 1.7 m sec−1
Time (sec) B e d m o is tu re c o n te n t (k g k g − 1) T e m p e ra tu re ( °C )
(a) (b)
Fig. 3: Effect of gas velocity on drying kinetics during humid air drying ((a): Pv = 0.6 bar and (b): Pv = 0.1 bar):
Tg = 140°C, d = 4.3 mm, Z = H/2 and H = 8 cm
0 500 1000 1500 2000
90 105 120 135 150 165 0.0 0.1 0.2 0.3 0.4 Tg=120°C
Tg=140°C Tg=160°C
te m p e ra tu r e ( °C ) time (s) b ed m o is tu re c o n te n t (k g /k g ) a B ed m o is tu re c o n te n t (k g k g − 1) T em p er at u re ( °C ) Time (sec)
0 500 1000 1500 2000
45 60 75 90 105 120 135 150 165 0.0 0.1 0.2 0.3 0.4
Tg=120°C T
g=140°C Tg=160°C
te m p er a tu re ( °C ) time (s) b ed m o is tu re c o n te n t (k g /k g ) b Time (sec) B ed m o is tu re c o n te n t (k g k g − 1) T em p er at u re ( °C )
(a) (b)
Fig. 4: Effect of gas temperature on drying kinetics during humid air drying ((a): Pv= 0.6 bar and (b): Pv= 0.1 bar):
Vg = 2 m sec
−1
, d = 4.3 mm, Z = H/2 and H = 8 cm
120 130 140 150 160
800 900 1000 1100 1200 1300 1400 1500 1600
Humid air (Pv=0.6 bar) Humid air (Pv=0.1 bar)
D ry in g t im e (s ec )
Drying fluid temperature (°C)
Tinversion
Fig. 5: Evolution of drying time versus drying agent temperature: The inversion temperature: Vg = 2 m sec−1, d = 4.3 mm, Z = H/2 and H = 8 cm
Figure 5 shows the drying time versus drying agent temperature for experimental humid air drying (Pv = 0.6 bar and Pv = 0.1 bar) and clearly indicates an inversion temperature around 130°C.
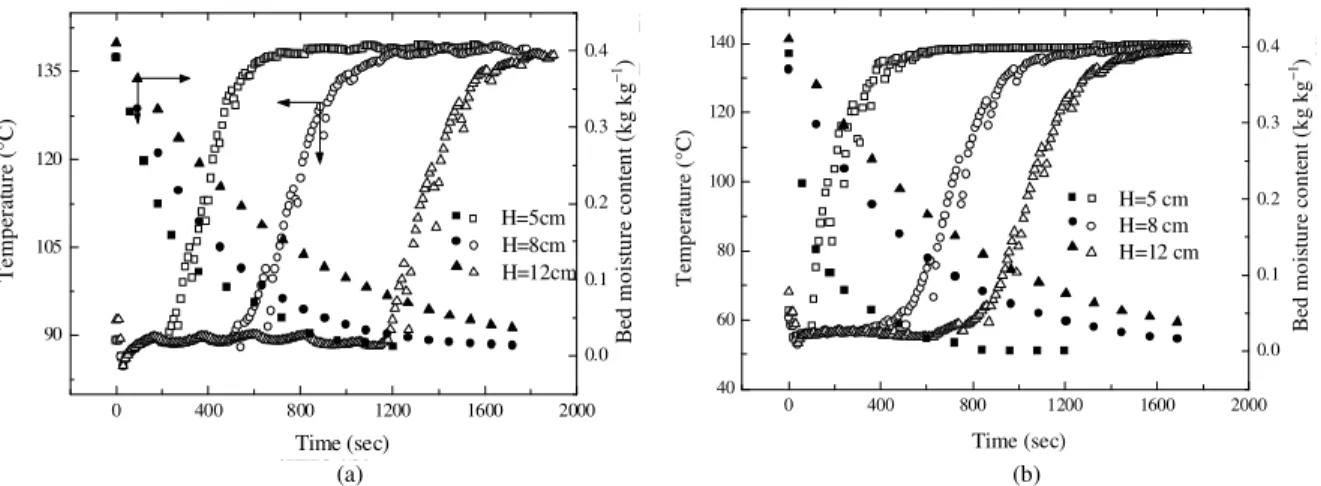
Figure 6 presents the variations of the solid temperature and the bed moisture content over time for different bed depths during humid air drying. For the same axial position, the bed depth affects the drying time. For example, when bed depth decreases from 12 to 5 cm the drying time is reduced about 1000s. The bed with the thinnest depth reaches the gas temperature and the equilibrium moisture content more quickly and remains at this temperature for the shortest amount of time.
0 400 800 1200 1600 2000 90
105 120 135
0.0 0.1 0.2 0.3 0.4
H=5cm H=8cm H=12cm
te
m
p
er
a
tu
re
(
°C
)
time (s)
b
e
d
m
o
is
tu
re
c
o
n
te
n
t
(k
g
/k
g
)
a
Time (sec)
B
ed
m
o
is
tu
re
c
o
n
te
n
t
(k
g
k
g
−
1)
T
e
m
p
er
at
u
re
(
°C
)
0 400 800 1200 1600 2000
40 60 80 100 120 140
0.0 0.1 0.2 0.3 0.4
H=5 cm H=8 cm H=12 cm
te
m
p
er
a
tu
r
e
(
°C
)
time (s)
b
e
d
m
o
is
tu
re
c
o
n
te
n
t
(k
g
/k
g
)
b
Time (sec)
B
ed
m
o
is
tu
re
c
o
n
te
n
t
(k
g
k
g
−
1)
T
em
p
er
at
u
re
(
°C
)
(a) (b)
Fig. 6: Effect of bed depth on drying kinetics during humid air drying (Pv = 0.6 bar (a) and Pv = 0.1 bar (b))
Tg = 140°C, d = 4.3 mm, Z = H/2 and Vg = 2 m sec
−1
0 400 800 1200
90 105 120 135 150 165
Z=H Z=H/2 Z=0
te
m
p
e
ra
tu
re
(
°C
)
time (s)
a
Time (sec)
T
em
p
e
rat
u
re
(°
C
)
0 500 1000 1500
40 60 80 100 120 140 160
Z=H Z=H/2 Z=0
te
m
p
e
r
a
tu
r
e
(
°C
)
time (s)
b
Time (sec)
T
e
m
p
e
ra
tu
re
(
°C
)
(a) (b)
Fig. 7: Product temperature at different bed depths during humid air drying (Pv= 0.6 bar (a) and Pv = 0.1 bar (b))
Tg = 140°C, d = 4.3 mm, Vg = 2 m sec
−1
and H = 8 cm At the entry of the cylinder (Z = 0), the product reaches the gas temperature more quickly than the centre (Z = H/2 = 4 cm) and the exit (Z = H = 8 cm) Figure 7 which was an expected result. We note the existence of a drying front that occurs at the start of the drying process. During drying, this front moves in the granular media[7].
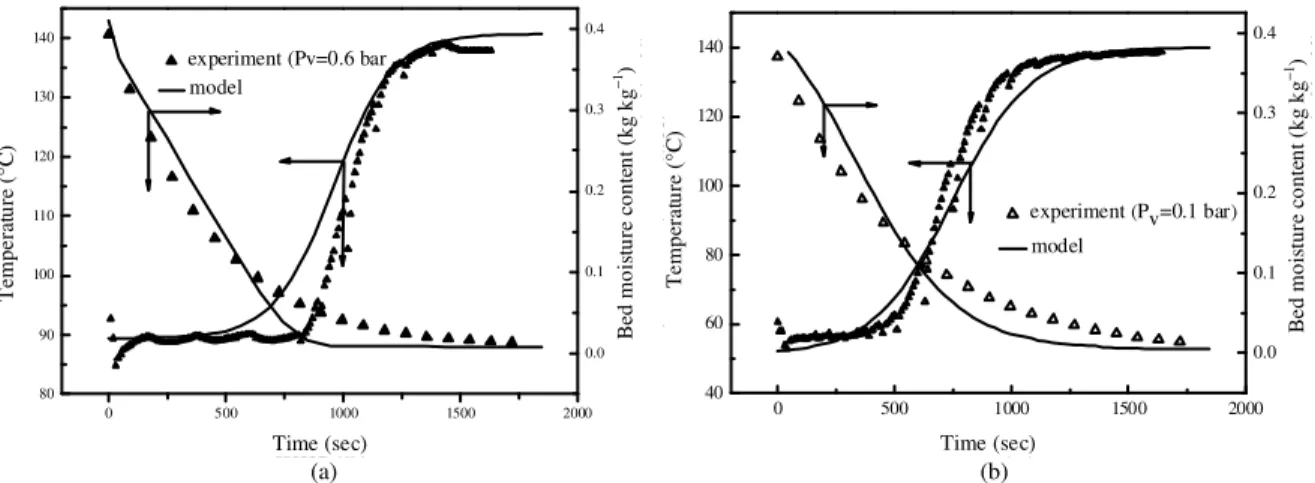
Figure 8 shows that, the predicted curves are in agreement with the experiments carried out at the same drying conditions: Gas temperature (Tg = 140°C) velocity (Vg = 2 m sec−1), particularly in predicting the time to reach the drying agent temperature. However, the experimentally measured solid temperature rises earlier than the predicted value for (Pv = 0.1bar). This
can be attributed to the position of the thermocouples. Moreover the assumption of a constant gas velocity is not completely exact In fact, the pressure air decreases due to friction between the gas and the walls as well as due to momentum losses caused by interaction of particles. The velocity between the particles and the gas is controlled by the interfacial drag and friction between the particles and the walls [15].
0 500 1000 1500 2000 80 90 100 110 120 130 140 0.0 0.1 0.2 0.3 0.4 te m p er a tu re ( °C ) time (s)
experiment (Pv=0.6 bar model b ed m o is tu re c o n te n t (k g /k g ) Time (sec) B ed m o is tu re c o n te n t (k g k g − 1) T em p e ra tu re ( °C )
0 500 1000 1500 2000
40 60 80 100 120 140 0.0 0.1 0.2 0.3 0.4 te m p e ra tu re ( °C ) time (s)
experiment (Pv=0.1 bar) model b e d m o is tu r e c o n te n t (k g /k g ) B e d m o is tu re c o n te n t (k g k g − 1) T e m p er a tu re ( °C ) Time (sec)
(a) (b)
Fig. 8: Comparison of experimental and numerical curves during humid air drying ((a) Pv = 0.6 bar and (b)
Pv= 0.1 bar): Tg = 140°C, Vg = 2 m sec
−1
, d = 4.3 mm, Z = H/2 and H = 8 cm
0 500 1000 1500
80 90 100 110 120 130 140 150 160 0.0 0.1 0.2 0.3 0.4 te m p er a tu re ( °C ) time (s)
experiment (Pv=0.6 bar) model b ed m o is tu re c o n te n t (k g /k g ) Time (sec) B ed m o is tu re c o n te n t (k g k g − 1) T em p er at u re ( °C )
0 500 1000 1500 2000
40 60 80 100 120 140 160 0.0 0.1 0.2 0.3 0.4 te m p er a tu re ( °C ) time (s)
experiment (Pv=0.1 bar) model b e d m o is tu r e c o n te n t (k g /k g ) Time (sec) B e d m o is tu re c o n te n t (k g k g − 1) T em p er at u re ( °C )
(a) (b)
Fig. 9: Comparison of experimental and numerical curves during humid air drying ((a) Pv = 0.6 bar and (b)
Pv = 0.1 bar): Tg= 160°C, Vg = 2 m sec−1, d = 4.3 mm, Z = H/2 and H= 8 cm
CONCLUSION
An experimental study of humid air drying of a packed bed of spherical alumina porous particles at atmospheric pressure at different vapour pressure was carried out. The influence of external and internal parameters was examined for two values of drying agent vapour pressure (Pv = 0.6 bar and Pv = 0.1 bar).
The experimental solid temperature curve at different axial position indicates the existence of a drying front inside the bed. In fact the influence of vapour pressure on the drying kinetics is of great importance; therefore it will be interesting to study experimentally superheated steam drying.
A comprehensive heat and mass transfer model was developed for a packed bed drying process during humid air. This model is based on the averaging volume
approach. Taking into account the non validity of the thermal equilibrium hypothesis, a two temperatures model is presented: particle temperature (solid phase) and the gas temperature. The mass transfer is introduced by drying kinetics deduced from the particle model. The correlations of mass flux and moisture content, deduced from the numerical resolution of the single particle model, were incorporated in the bed model. The predicted results compared to the experimental data, indicated good agreements despite the few discrepancies.
REFERENCES
2. Khan, J.A., D.E. Beasley and B. Alatas, 1991. Evaporation from a packed bed of porous particles into superheated vapor. Int. J. Heat Mass Trans., 1: 267-280. http://cat.inist.fr/?aModele=afficheN&cpsidt=5147908
3. Hager, J., R. Wimmerstedt and S. Whitaker, 2000. Steam drying of a bed of porous spheres: theory and experiment. Chemical Eng. Sci., 55: 1675-1698. DOI: 10.1016/S0009-2509(99)00398-X
4. Chen, Z., P.K. Agarwal and J.B. Agnew, 2001. Steam drying of coal, Part 2. Modeling the operation of fluidized bed drying unit. Fuel, 80: 209-223. DOI: 10.1016/S0016-2361(00)00081-8
5. Tang, Z., S. Cenkowski and W.E. Muir, 2004. Modeling the superheated-steam drying of a fixed bed of brewers’ spent grain. Biosyst. Eng., 87: 67-77. DOI: 10.1016/j.biosystemseng.2003.09.008 6. Sghaier, J., S. Messai, W. Jomaa and A. Belghith,
2005. Two dimensional heat and mass transfer during superheated steam drying of a fixed bed. Proceeding of the 4th International Conference on Heat and Mass Transfer, Arcachan, France, pp: 756. 7. Arnaud, G. and J.P. Fohr, 1988. Slow drying
simulation in thick layers of granular products. Int. J. Heat Mass Trans., 31: 2517-2526.
http://cat.inist.fr/?aModele=afficheN&cpsidt=7284289
8. Sözen, M. and K. Vafai, 1990. Analysis of the non-thermal equilibrium condensing flow of gas through a packed bed. Int. J. Heat Mass Transfer, 33: 1247-1261.
9. Mhimid, A., J.P. Fohr and S. Ben Nasrallah, 1999. Heat and mass transfer during drying of granular products by combined convection and conduction. Dry. Tech. Int. J., 17: 1043-1063. DOI: 10.1080/07373939908917
10. Ratti, C. and A.S. Mujumdar, 1995. Simulation of packed bed drying of foodstuffs with airflow reversal, J. Food Eng., 26: 259-271. DOI: 10.1016/0260-8774(94)00007-V
11. Wang, Z.H. and G. Chen, 1999. Heat and mass transfer in fixed-bed drying. Chem. Eng. Sci., 54: 4233-4243. DOI: 10.1016/S0009-2509(99)00118-9
12. Kato, K., S. Ohmura, D. Taneda, I. Onozawa, K. Shimura and A. Iijima, 1981. Drying characteristics in a packed fluidized bed dryer. J. Chem. Eng. Jap., 14: 365-371.
13. Sghaier, J., W. Jomaa and A. Belghith, 2008. Superheated steam of a spherical porous particle. J. Porous Media, 11: 633-646. DOI: 10.1615/JPorMedia.v11.i7.20
14. Patankar, S.V., 1980. Numerical Heat Transfer and Fluid Flow. 1st Edn., Hemisphere Publishing Corporation, McGraw Hill, Washington DC., USA., pp: 197. http://orton.catie.ac.cr/cgi-bin/wxis.exe/?IsisScript=LIBRO.xis&method=po st&formato=2&cantidad=1&expresion=mfn=020 257.
15. Johnner, P., I. Sitompul and S. Sumardiono, 2003. Modeling and simulation of momentum, heat and mass transfer in a deep-bed grain dryer. Dry. Tech.
Int. J., 21: 217-229.