ISSN 0104-6632 Printed in Brazil
www.abeq.org.br/bjche
Vol. 29, No. 02, pp. 231 - 242, April - June, 2012
Brazilian Journal
of Chemical
Engineering
THEORETICAL AND EXPERIMENTAL DRYING
OF A CYLINDRICAL SAMPLE BY APPLYING HOT
AIR AND INFRARED RADIATION IN AN INERT
MEDIUM FLUIDIZED BED
B. Honarvar
1*and D. Mowla
21
Chemical Engineering Department, Science and Research Branch, Phone: + 989173145175, Fax: + 987116247155, Islamic Azad University, Fars, Shiraz, Iran.
E-mail: [email protected]
2
Chemical Engineering Department, Shiraz University, Shiraz, Iran.
(Submitted: January 27, 2011 ; Revised: October 8, 2011 ; Accepted: October 27, 2011)
Abstract - Drying of a cylindrical sample in a fluidized bed dryer containing inert particles was studied. For this purpose, a pilot-scaled fluidized bed dryer was constructed in which two different heat sources, hot air and infrared radiation were applied, and pieces of carrot were chosen as test samples. The heat transfer coefficient for cylindrical objects in a fluidized bed was also measured. The heat absorption coefficient for carrot was studied. The absorption coefficient can be computed by dividing the absorbed heat by the carrot to the heat absorbed for the water and black ink. In this regard, absorbed heat values by the carrot, water and black ink were used A mathematical model was proposed based on the mass and heat transfer phenomena within the drying sample. The results obtained by the proposed model were in favorable agreement with the experimental data.
Keywords: Drying; Absorption; Infrared; Carrying particles; Mathematical Modeling.
INTRODUCTION
The process of drying is one of the main energy consuming processes encountered in chemical engineering and this single step occurs in most chemical processes. Considering the high energy cost and environmental issues, increasing the thermal efficiency is of prime importance. Applying novel technologies such as drying with combined convection and radiation thermal sources, which accelerates drying, increases dryer capacity and decreases the heat wastes that seem unavoidable (Promvonge et al., 2011; Dandee et al., 2011). Fluidized bed drying is of high importance. This method is mostly used to dry seeds and enjoys the
advantage of suitable mixing, which increases the mass and heat transfer coefficients between the solid and the gas phase. Izadifar et al. (2003) modeled a discontinuous fluidized bed dryer. They used the two-phase theory of fluidization and obtained the gas and solid moisture variations with time and location in the bed by using the energy and mass balance equations.
The use of inert particles as energy carriers in current fluidized bed driers (FBD) is still in the development stage and has the following advantages (Hatamippour and Mowla, 2003):
Homogeneous bed temperature and decrease in local warming of the drying sample.
Increase in mass and heat transfer.
Electromagnetic waves such as infrared radiation, microwave, dielectric, and radio waves are another way of heating the drying materials. Infrared waves can be electrically generated using electrical elements or by internal combustion engines. These driers are of high radiation efficiency and are being developed for drying of porous materials. In the Japanese food industry, these driers are applied to seaweed and carrot drying (Sakai and Hazawa, 1994). When electromagnetic waves impinge on the surface of the material, energy is generated via electronic excitation and molecular vibrations. The different energy absorbing mechanisms resulting from electromagnetic wave radiations are determined by the wavelength of the electromagnetic radiation. The change in the electronic configuration of the molecules is caused by wavelengths in the 0.2-0.7 micrometer range, which is in the region of the ultraviolet and visible. The change in the vibration state of molecules occurs at wavelengths of 2.5-100 micrometers, which is in the region of the infrared. The change in the rotational state of atoms and molecules is related to wavelengths above 100 micrometers in the region of microwaves. Infrared radiation causes the molecules to vibrate and heat is generated due to the friction that results from their vibration (Naret Meeso, 2006; Ginzburg 1969).
Ranjan (1995) assumed that agricultural seeds are a blur material in thermal modeling of infrared and radiation energy. This term was considered to be the energy generation term in the partial differential equation of the heat transfer and the volumetric rate of the generated heat was assumed to decrease exponentially.
Isengard et al. (2003) studied the water content of products containing a high degree of sugar using the infrared drier. Mass loss was not only restricted to water loss, but also to other types of volatiles. Togrul (2006) proposed a model for the drying of carrot in which the infrared drier properties were studied in the temperature range from 50°C to 80°C. The influence of temperature on drying rate was clearly observed, so that when the temperature was raised from 50ºC to 80ºC, the drying rate doubled. Sharma
et al. (2005) studied the drying of thin layers of
onion using infrared radiation. Hebbar et al. (2006) examined the process of drying of vegetables through hot air and infrared radiation. In this study,
hot air was used for the displacement of the generated heat. Using this system the drying time decreased by 48% at 40ºC. This process reduced the energy consumption by nearly 63%.
Combining convection and radiation heat transfer is of great importance in increasing the thermal efficiency of driers. Radiation heat transfer has no need for material media and solely depends on the radiation properties of the product to be dried and the heat source. Agriculture products have an infrared radiation absorption coefficient of around 70% to 90%. When infrared waves are radiated to the material to be dried, the internal temperature of the particle is increased. The moisture concentration (content) gradient is the driving force for the moisture to transfer towards the sample surface, where it is removed by the surrounding air (Sharma et al., 2005b; Abbasi and Mowla, 2008).
In several industries, drying using a fluidized bed and infrared radiation has been separately studied. However, the drying process using this combination has been less studied.
In this study, a fluidized bed drier with two thermal sources, hot air and infrared radiation, was designed and modeled. The mathematical model describing the mass and heat transfer in a cylindrical particle is presented and numerically solved with the development of a computer code in MATLAB. The effect of different parameters on the drying rate was studied and the surface temperature profile and moisture content over time were calculated.
MATERIALS AND METHODS
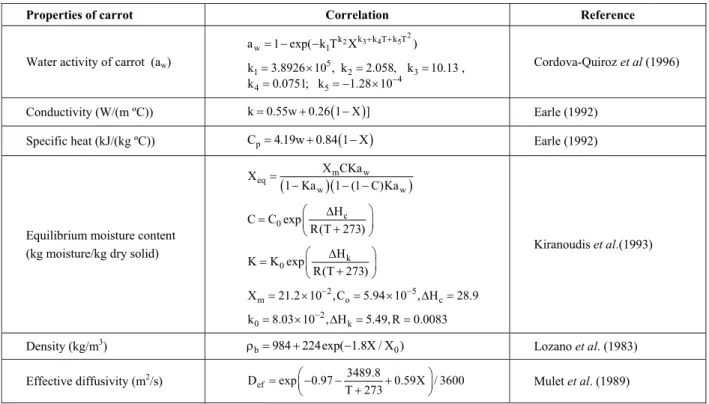
Table 1: Correlations for Physical properties of Carrot and Air
Properties of carrot Correlation Reference
Water activity of carrot (aw)
2 3 4 5 2 k k T k T
k
w 1
a = −1 exp( k T X− + + )
5
1 2 3
4
4 5
k 3.8926 10 , k 2.058, k 10.13 ,
k 0.0751; k 1.28 10−
= × = =
= = − ×
Cordova-Quiroz et al (1996)
Conductivity (W/(m ºC)) k=0.55w+0.26 1 X ]( − ) Earle (1992)
Specific heat (kJ/(kg ºC)) Cp=4.19w 0.84 1 X+ ( − ) Earle (1992)
Equilibrium moisture content (kg moisture/kg dry solid)
( )(m w )
eq
w w
X CKa X
1 Ka 1 (1 C)Ka
=
− − −
c 0
H
C C exp
R(T 273)
⎛ Δ ⎞
= ⎜ ⎟
+
⎝ ⎠
k 0
H
K K exp
R(T 273)
⎛ Δ ⎞
= ⎜ ⎟
+
⎝ ⎠
2 5
m o c
X =21.2 10 ,C× − =5.94 10 , H× − Δ =28.9
2
0 k
k =8.03 10 , H× − Δ =5.49, R=0.0083
Kiranoudis et al.(1993)
Density (kg/m3) ρ =b 984 224exp( 1.8X / X )+ − 0 Lozano et al. (1983)
Effective diffusivity (m2/s) ef
3489.8
D exp 0.97 0.59X / 3600
T 273
⎛ ⎞
= ⎜− − + ⎟
+
⎝ ⎠ Mulet et al. (1989)
Experimental Apparatus and Measurement Techniques
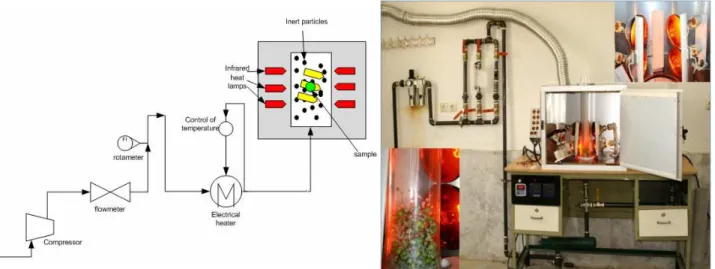
In order to conduct the experiments, a pilot-scale fluidized bed was designed to combine hot air and infrared radiation sources for drying. The schematic of this apparatus is shown in Figure 1 and a picture of the dryer section is shown in Figure 2. The inside diameter and length of the pyrex dryer column were 78 mm and 60 cm, respectively. Glass spheres with a diameter of 3 mm and physical properties of ρIP=2700 kg/m3; kIP=0.78 W/mºC; and CpIP=0.86 kJ/kgºC were used as inert particles. The drying sample was suspended inside the drier. The temperature at the center and surface of the dryer were measured with thermocouples (Lutron+Pt 100+type K/J/R/E/T). Mass variation was recorded at specified time intervals by a balance with an accuracy of ±0.0001 gr (RADWAG, WAS 220/C/2). Air required for drying was provided by a high-pressure compressor after the removal of its moisture and probable oil. The compressor pressure was later adjusted to the desired pressure level by the pressure regulator. Several holes were made in a circular Teflon disk with a thickness of 3 cm and then hot air
Figure 1: Schematic view of the fluidized bed drier containing energy carrying particles combined with infrared radiation
Figure 2: A photo of the dryer section of the apparatus
Table 2: The operating conditions for drying of carrot in the FBD and FBD+IR systems.
Exp. # Diameter of Sample
Weight of Sample
Air Velocity
Inlet Air T
Amount of Inert
Type of Infrared System power
mm g m/s °C g W
1 9.24 0.461 7 50 150 FBD 0
2 9.24 0.462 7 50 400 FBD 0
3 9.24 0.468 8 50 400 FBD 0
4 9.50 0.476 8 50 400 FBD with IR 600
5 9.05 0.451 7 50 400 FBD with IR 600
6 9.05 0.452 5 60 150 FBD with IR 600
7 9.5 0.469 5 50 400 FBD with IR 600
8 9.14 0.461 5 50 150 FBD with IR 600
9 9.12 0.457 5 40 150 FBD with IR 600
10 9.13 0.459 5 30 150 FBD with IR 600
11 9.13 0.460 5 60 150 FBD 0
12 9.14 0.464 5 60 150 FBD 0
13 9.14 0.461 5 50 150 FBD 0
14 9.14 0.459 5 40 150 FBD 0
15 9.13 0.463 5 40 150 FBD 0
16 9.14 0.462 5 35 150 FBD 0
17 9.14 0.461 2 50 400 FBD with IR 600
18 9.12 0.458 5 50 400 FBD with IR 600
19 9.14 0.462 2 50 400 FBD 0
20 9.14 0.460 5 70 150 FBD+IR 600
21 9.14 0.465 5 70 150 FBD 0
22 8.61 0.417 3 40 400 FBD with IR 600
23 8.61 0.408 3 40 400 FBD with IR 500
24 9.46 0.477 3 40 400 FBD with IR 400
25 9.24 0.473 3 40 400 FBD with IR 200
26 9.51 0.471 3 40 400 FBD 0
27 9.15 0.415 3 40 400 FBD with IR 600
28 8.61 0.4085 3 40 400 FBD with IR 500
29 8.61 0.411 3 40 400 FBD with IR 400
30 9.1 0.458 3 40 400 FBD with IR 200
Calculation of Heat of Infrared Radiation
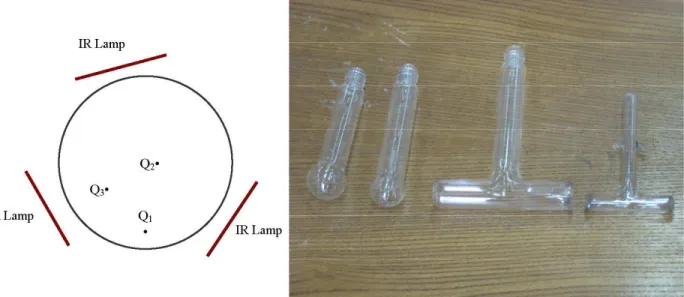
The average volumetric power of the heat generated by the infrared radiation was experimentally measured. For this purpose, several experiments were conducted by placing a quartz container containing water, black ink and carrot at different positions of the drier bed, as shown in Figures 3 and 4, and measuring the absorbed heat. The values for different experiments are listed in Table 3.
By measuring reduced water mass and water temperature before and after using infrared radiation, the absorbed and latent heat of the evaporation can be calculated. The generated heat per unit volume of the heating sample is shown in Equation (1):
latent heat Sensible heat r
p
Q Q
Q
V . t
+ =
Δ (1)
In different operational conditions of the fluidized bed, the average heat absorbed by the drying sample in different positions was obtained. The absorption coefficient can be computed by dividing the heat absorbed by the carrot by the heat absorbed by the water and black ink. In this regard, absorbed heat values for the carrot, water and black ink were used (as shown in Table 2). The average absorption coefficient ratio of carrot to water was 0.8352 and carrot to black ink was 0.8349. As is evident, there is no difference between the water and black ink absorption coefficients. Qr was measured by the calorimeter method.
Figure 3: Different positions for measuring the generated heat power in the bed
Figure 4: Quartz sample in cylindrical and spherical coordinates for the measurement of volumetric heat generation power due to the infrared radiation
Table 3: Generated Heat Power (W/m3) of Drying Sample in Different Positions at Various Temperatures
T=35 °C
Size Dia= 14.92 mm L= 77.36 mm Dia= 8.92 mm L= 49.20 mm
Position Carrot Water Black Ink Carrot Water Black Ink
Q1 1.75Χ106 2.10Χ106 2.15Χ106 1.48Χ106 1.79Χ106 1.78Χ106
Q2 1.90Χ106 2.30Χ105 2.30Χ105 1.52Χ106 1.81Χ106 1.8Χ106
Q2 1.95Χ106 2.33Χ106 2.32Χ106 1.56Χ106 1.88Χ106 1.87Χ106
T=60 °C
Size Dia= 14.92 mm L= 77.36 mm Dia= 8.92 mm L= 49.20 mm
Position Carrot Water Black Ink Carrot Water Black Ink
Q1 2.41Χ106 2.9Χ106 2.91Χ106 1.94Χ106 2.32Χ106 2.19Χ106
Q2 2.66Χ106 3.2Χ106 3.21Χ106 1.96Χ106 2.37Χ106 2.38Χ106
Calculation of the Overall Heat Transfer Coefficient
The lumped method was used to measure the value of the average heat transfer coefficient ht (Salagnc et al., 2004; Rizzi et al., 2009). For this purpose a piece of metal with high thermal conductivity was placed in the fluidized bed to find the ht value. In this regard, the fluidized bed dryer containing inert particle was operated for about two hours to reach the thermally stable condition (constant temperature). An aluminum cylinder was then introduced into the drying column. In each experiment, the temperature at the center of the aluminum cylinder was measured at different time intervals in the presence of energy carrying particles (infrared radiation was not present). Experimental results showed that the presence of particles as energy carriers caused the solid temperature to reach the final temperature quickly. This analysis assumed a negligible temperature gradient within the solid; thus, heat transfer resistance was concentrated at the particle surface. By applying the initial condition (T=T0 at t=0) and integrating the energy equation in the metal sample, the following equation is obtained:
t
0 P
T T h A
exp t
T T C V
∞ ∞
⎡ ⎤
− = −
⎢ ⎥
− ⎣ ρ ⎦ (2)
Temperature-time data is plotted as 0
T T
Ln( )
T T
− ∞ − ∞
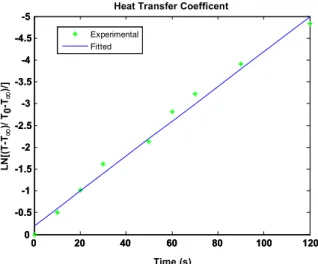
versus time, as shown in Figure 5. The slope of the line was used in the calculation of the overall heat
transfer coefficient. The experiment was repeated three times for different sizes of aluminum cylinder. The average heat transfer coefficient for the cylinder with a diameter of 8, 10 and 12 mm in the fluidized bed with an air temperature of 50°C was about (127-130)± 4.5 W/m2K. It is noteworthy to mention that, due to the mixing and turbulence in the fluidized beds, the heat transfer coefficient between the floating sample and the bed was of the order of (100-400) W/m2K [Botterill, (1975)].
Using the Chilton-Colburn analogy, the
convection moisture transfer coefficient ( kg2 m s) was calculated from the heat transfer coefficient by the following equation:
2/3 t
P y
h Sc
C ( )
k = Pr (3)
This analogy is well known and widely used in simultaneous mass and heat transfer comparison. Validity of this analogy under different conditions was studied by Nomura and Farfell (1985).
Calculation of the Bi number revealed that this number was always less than 0.1, so the lumped capacity assumption was acceptable. Therefore, when heating the cylindrical metal sample floating in the fluidized bed containing energy-carrying inert particles, one is able to use the Chilton-Colburn analogy and the measured heat transfer coefficient to calculate the convection mass transfer for the carrot sections with diameters of 8, 10 and 12 mm to be about (0.11-0.14)± 0.004 kg/m2s.
0 20 40 60 80 100 120
-5
-4.5
-4
-3.5
-3
-2.5
-2
-1.5
-1
-0.5
0
LN
[(
T
-T ∞
)/(T
0
–T
∞
)]
Time (s) Heat Transfer Coefficent
Experimental Fitted
Time (s) Heat Transfer Coefficent
LN
[(
T
-T∞
)/
T0 -T∞
)/]
-5
-4.5
-4
-3.5
-3
-2.5
-2
-1.5
-1
-0.5
0
00 2020 4040 6060 8080 100100 120120 -5
-4.5
-4
-3.5
-3
-2.5
-2
-1.5
-1
-0.5
0
LN
[(
T
-T ∞
)/(T
0
–T
∞
)]
Time (s) Heat Transfer Coefficent
Experimental Fitted
Time (s) Heat Transfer Coefficent
LN
[(
T
-T∞
)/
T0 -T∞
)/]
-5
-4.5
-4
-3.5
-3
-2.5
-2
-1.5
-1
-0.5
0 -5
-4.5
-4
-3.5
-3
-2.5
-2
-1.5
-1
-0.5
0
0 20 40 60 80 100 120 0 20 40 60 80 100 120
MATHEMATICAL MODELING
It was assumed that moisture transfer occurred during liquid diffusion. Moisture moved from the interior towards the interface and evaporated at the interface. Other assumptions that were made are as follows:
One-dimensional heat and moisture transfer;
No chemical reaction during drying;
Air was uniformly distributed within the drying column;
Air and Pyrex glass allow for the passage of electromagnetic waves;
The drying sample was assumed to be a grey material.
This model was adapted for a cylindrical sample with a diameter of dp and length of Lp in which Lp / dp >5, and thus was considered as one-dimensional heat and mass (moisture) transfer. Initial moisture content and temperature were uniform throughout the material and equal to X0 and T0, respectively. The drying sample was exposed to hot air and floats along with the inert particles, which worked as energy carriers by the air driving force. Infrared light from three lamps was used to irradiate the drying sample and the bed.
Mass Conservation Equation
In order to derive the mass transfer equations, a control volume with a thickness of the drying material was assumed. The mass conservation equation is as follows:
( )
pp eff
X 1 X
rD
t r r r
∂ ρ ⎛∂ ⎛ ∂ ⎞⎞
= ⎜ ⎜ρ ⎟⎟
∂ ⎝∂ ⎝ ∂ ⎠⎠ (4)
The initial and boundary conditions for this equation are:
p 0
t=0 0< <r R X=X (5a)
X
t 0 r 0 0
r
∂
> = =
∂ (5b)
(
)
P eff m s e X
t 0 r R D k Y Y
r
∂
> = = −
∂ (5c)
The volumetric moisture content in the drying sample is given in Equation (6):
R 2 avg
p 0 4
X (t) r X(r,T)dr
V
π
=
∫
(6)Energy Conservation
Like the mass conservation equation, the energy balance for the control volume is:
(
p pg p)
pp r
C T 1 T
rk Q
t r r r
∂ ρ = ⎡ ∂ ⎛ ∂ ⎞⎤+
⎢ ⎜ ⎟⎥
∂ ⎣∂ ⎝ ∂ ⎠⎦ (7)
and initial and boundary conditions are:
p p 0
t=0 0< <r R T =T (8a)
t>0 r 0 Tp 0
r
∂
= =
∂ (8b)
(
)
(
)
p p p p
evp t p g p m e
T
r R k A
r
h A T T k Y Y∞ ΔH
∂
= ± =
∂
− + − (8c)
In Equation (8c) when only hot air was used and the surface temperature was higher than the inside temperature or in the combined condition, a negative sign was used for the first 500 seconds. When the internal temperature was higher than the surface temperature, a positive sign was used. The average volumetric temperature in the drying sample was computed via the following relation:
R 2 avg
p 0 4
T (t) r T(r,T)dr
V
π
=
∫
(9)The Stephan-Boltzmann equation indicates the intensity of heat transferred to a sample under infrared radiation. In this study, the drying sample was completely covered by the infrared radiation and thus had a shape factor of unity. Radiation heat transfer to the sample is calculated by the Equation (10).
(
4 4)
i j abs
j i
i i i i i i
T T
Q
P
P 1
A A F A
σ −
=
⎛ ⎞
+ +
⎜ε ε ⎟
⎝ ⎠
(10)
(
)
(
)
abs p
p
Qr Q exp K R r
V
= − −
(11)
The decay factor (K) is indicative of the infrared wave penetration into the drying sample and its inverse is referred to as the “penetration depth” (Saiagnac et al., 2004). Smaller values of the decay factor signify a larger penetration depth and indicate slower radiation flux decay. The decay factor is a characteristic of materials and depends on the chemical composition, the chemical and physical properties, and the wavelength of the radiation.
Since water is the main component of most biological materials, infrared penetration depth can be partially studied by the water absorption heat. Water is capable of absorbing infrared waves with a wavelength longer than 1.4 mμ and less infrared of wavelengths shorter than 1.4 μm. Thus, a dry carrot has a smaller absorption coefficient than a wet carrot (Sandu, 1986). Experimental values of the decay factor of various food products can be found in papers presented by various authors, while no specific method is available for the measurement of these properties. Ginsburg (1969) summarized the penetration of infrared waves with short wavelengths in different materials. Table 3 shows the penetration depth of infrared waves with different wavelengths for some agricultural products. Penetration depth depends on the type of material, wavelength and radiation energy. For a wavelength less than 1.25 mμ , penetration depths for carrot, pork and bread have been measured to be 4.7 mm, 2.3 mm, and 6.25 mm, respectively.
Solution of the Mathematical Model
The proposed model numerically predicted the temperature and moisture content of the drying sample by considering Equations (4) and (7) and inserting the initial and boundary conditions. The Crank-Nickolson finite difference method was employed to solve the above equations for the temperature and moisture variation through time (Stakic et al., 2011).
Equation (4) can be rewritten as:
p p
2 2
p 2 p
2 2
X X
t t
(r D )
1 X X
r D
r r
r r
∂ρ ∂
ρ + =
∂ ∂
⎛∂ ∂ ρ + ρ ∂ ⎞
⎜ ⎟
⎜ ∂ ∂ ∂ ⎟
⎝ ⎠
(12)
The following numerical equations are used to discretize Equation (12),
n 1 n i i
X X X
t t
+
∂ = −
∂ Δ (13)
n 1 n p pi pi
t t
+
∂ρ ρ − ρ
=
∂ Δ (14)
n 1 n 1 n n i 1 i i 1 i
X X X X X
r 2 r
+ +
+ +
∂ = − + −
∂ Δ (15)
2
n 1 n 1 n 1 i 1 i i 1 2 2
n n n i 1 i i 1 2
X 1 1
(X 2X X )
2
r r
1 1
(X 2X X )
2 r
+ + +
+ −
+ −
∂ = ⎡ − + ⎤+
⎢ ⎥
∂ ⎣Δ ⎦
⎡ − + ⎤
⎢Δ ⎥
⎣ ⎦
(16)
2 i 1 n 1 2 n 1 n 1 i 1 i 1 pi 1 i i pi 2
p
2 n n 2 n n i 1 i 1 pi 1 i i pi
r D r D
1 (r D )
r 2 r r D r D
+ + + +
+ + +
+ + +
⎛ ρ − ρ +⎞
∂ ρ = ⎜ ⎟
⎜ ⎟
∂ Δ ⎜ ρ − ρ ⎟
⎝ ⎠
(17)
RESULTS AND DISCUSSION
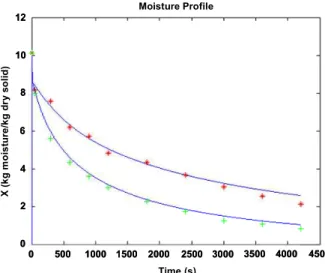
predicted average moisture content showed good agreement with the experimental data. However, at the end stages of drying with combined infrared and hot air heating‚ the proposed model did marginally underestimate the moisture contents of the drying sample (Hatamipour and Mowla, 2003; Meeso, 2006). X (k g m o is tur e /k g dr y s o lid ) Time (s) Moisture Profile
0 500 1000 1500 2000 2500 3000 3500 4000 4500 10 6 4 2 0 8 12 X (k g m o is tur e /k g dr y s o lid ) Time (s) Moisture Profile
0 500 1000 1500 2000 2500 3000 3500 4000 4500 0 500 1000 1500 2000 2500 3000 3500 4000 4500 10 6 4 2 0 8 12 10 6 4 2 0 8 12
Figure 6: Comparison of model predictions and
experimental measurements for the moisture content variation of the drying sample.
0 500 1000 1500 2000 2500 3000 3500
25 30 35 40 45 50 55 60 65 Time (s) S ur fa c e T em per at ur e Surface Temperature Model FBD
EXP T=50C, V=2m/s, FBD Model FBD+IR
EXP T=50C, V=2m/s, FBD+IR
0 500 1000 1500 2000 2500 3000 3500 Time (s) 25 30 35 40 45 50 55 60 65 Surface Temperature S u rf ac e T em p e ra tu re
Figure 7: Comparison of model predictions and
experimental measurements for the temperature variation at the surface of the drying sample in the fluidized bed dryer with and without infrared heat source.
The surface temperatures measured in the experiment at different instants and calculated by the model are illustrated Figure 7. The proposed model overestimated the temperature of the drying sample.
This was due to the initial assumptions made or to the possibility that the equilibrium moisture content used in the model may be different from the equilibrium moisture content of the carrot in the laboratory because of the differences in materials (due to the cultivar or seed conditions).
In addition, in the combined fluidized bed and infrared radiation, the deviation in the estimation of the temperature distribution during the drying was due to the use of the Lambert equation, which relied on the assumed dependence of infrared absorption as a function of the moisture content of the drying sample. It is worth mentioning that the mass and energy equations were interdependent. The effective moisture diffusion coefficient, Deff, in the mass transfer model was a function of temperature. When calculating the temperature at the surface and center of the drying sample and comparing it with the measured values, there was an overestimation by these models. This was due to the assumptions of the model, which depended on the penetration depth of the infrared waves into the sample, absorption properties of the drying sample, and estimation of the energy generated in the drying sample.
Since mass balance equations were not independent of the energy equation, overestimation of the temperature by the model (compared to the measurement results) resulted in the underestimation of the moisture content in the final part of the drying curve. Furthermore, the equilibrium moisture measurements at the boundary conditions had normal errors. Another source for this deviation could be the error in temperature measurements. It must be remembered that the energy and mass equations are not independent. The effective moisture diffusivity in the mass transfer model is a function of temperature.
carrot‚ the resistance to mass transfer controls the drying rate. The surface temperature had the maximum value of the air temperature. It was also observed that moisture at the surface of the sample reached its final level when it was in equilibrium with the surrounding air.
0 500 1000 1500 2000 2500 3000 3500 4000
0 2 4 6 8 10 12 Time (s) X (kg m o istu re /kg dr y soli d ) r=Rp r=0 Time (s)
0 500 1000 1500 2000 2500 3000 3500 4000
X (k g m o is tur e /k g d ry s o lid ) 10 6 4 2 0 8 12
0 500 1000 1500 2000 2500 3000 3500 4000
0 2 4 6 8 10 12 Time (s) X (kg m o istu re /kg dr y soli d ) r=Rp r=0 Time (s)
0 500 1000 1500 2000 2500 3000 3500 4000
X (k g m o is tur e /k g d ry s o lid ) 10 6 4 2 0 8 12
Figure 8: Moisture variation with time for different radial positions of the drying sample at a temperature of 60ºC and air velocity of 6 m/s in the fluidized bed without infrared heat source.
0 500 1000 1500 2000 2500 3000 3500 Time (s) 20 25 30 35 40 45 50 55 65 Tsur 60
0 500 1000 1500 2000 2500 3000 3500 Time (s) 20 25 30 35 40 45 50 55 65 Tsur 60
Figure 9: Temperature variation with time for
different radial position of the drying sample at a temperature of 60ºC and air velocity of 6 m/s in the fluidized bed sample without infrared heat source.
In the case of combined hot air and infrared radiation (Figures 10 and 11), the temperature and moisture variation curves showed that the moisture content values were similar to the FBD system and that only the drying rate increased. However, the temperature at the center was at the maximum level, while the surface showed the lowest value. Thus, both heat and moisture were transferred from the center towards the surface. Indeed, electromagnetic
waves were better absorbed at points with higher moisture and thus temperature increased in these regions.
0 1000 2000 3000 4000 5000 6000 7000 8000 9000
0 1 2 3 4 5 6 7 8 9 10 Time (s) X (k g mo is tu re /k g dr y so lid) r=0 r=R Time (s) 0 1 2 3 4 5 6 7 8 9 10 X (k g m o is tur e /k g dr y s o li d )
00 10001000 20002000 30003000 40004000 50005000 60006000 70007000 80008000 90009000 0 1 2 3 4 5 6 7 8 9 10 Time (s) X (k g mo is tu re /k g dr y so lid) r=0 r=R Time (s) 0 1 2 3 4 5 6 7 8 9 10 X (k g m o is tur e /k g dr y s o li d )
0 1000 2000 3000 4000 5000 6000 7000 8000 9000 0 1000 2000 3000 4000 5000 6000 7000 8000 9000
Figure 10: Moisture variation with time for different radial positions of the drying sample at a temperature of 60ºC and air velocity of 6 m/s in the fluidized bed with the infrared radiation heat source.
0 500 1000 1500 2000 2500 3000 3500
20 25 30 35 40 45 50 55 60 65 70 Time (s) T r =0
r = Rp r =Rp
r = 0.8Rp
r=0 r= 0.8Rp r=Rp r=Rp 25 30 35 40 45 50 55 65 60 70 T 20
0 500 1000 1500 2000 2500 3000 3500 Time (s)
0 500 1000 1500 2000 2500 3000 3500
20 25 30 35 40 45 50 55 60 65 70 Time (s) T r =0
r = Rp r =Rp
r = 0.8Rp
r=0 r= 0.8Rp r=Rp r=Rp 25 30 35 40 45 50 55 65 60 70 T 20 25 30 35 40 45 50 55 65 60 70 T 20
0 500 1000 1500 2000 2500 3000 3500 0 500 1000 1500 2000 2500 3000 3500
Time (s)
Figure 11: Temperature distribution of carrot sample at a temperature of 60ºC and air velocity of 6 m/s in the fluidized bed with the infrared radiation heat source.
CONCLUSION
In this work, the drying of cylindrical carrot samples in a fluidized bed containing inert energy carrier particles with hot air and infrared radiation was studied in a pilot-scale fluidized bed dryer. The heat absorption coefficients for carrot, water and black ink were measured. The average absorption coefficient ratios of carrot to water and carrot to black ink were found to be 0.8352 and 0.8349 respectively. Also, the heat transfer coefficient for cylindrical objects in a complete mixed fluidized bed was measured at 127-130 W/ m2K and was in good agreement with the values reported by other researchers. A mathematical model was proposed for the unsteady state conditions and the finite difference method was used to solve the mass and heat transfer equations. The model showed that application of infrared radiation was very effective in terms of drying rate due to the absorption of heat by the water molecules in the drying sample. Good agreement was observed between the experimental data and the proposed model predictions. The model was capable of predicting the temperature and moisture profile in the drying sample. The effects of temperature, velocity of air and the mass and size of inert particles on the rate of drying were also studied. An increase in the air temperature and the mass of the inert particles, and a decrease in air velocity and size of the drying sample all resulted in an increase of the drying rate.
ACKNOWLEDGEMENTS
The author would like to thank the Marvdasht Islamic Azad University, Shiraz, Iran, for the award of a research grant to conduct this study.
NOMENCLATURE
A surface area m2
Ap particle surface area m2
Ar Archimedes Number
Cp Heat capacity J/kg °C
CPg gas heat capacity J/kg °C
dp diameter of particle m
Deff Effective moisture diffusivity m2/s ht Overall heat transfer
coefficient
W/m2s
ΔHevp Latent heat kJ/kg
Km Mass transfer coefficient m/s
Kp Mass transfer coefficient kg/m 2
s
ky Mass transfer coefficient kg/m 2
s
L Length m
Lp Particle length m
Nu Nusselt Number
Pr Prandtl Number
Q Heat transfer rate W
Qlatent heat Latent Heat kJ/kg Qsensible heat Sensible Heat kJ/kg Qr Average volumetric heat W/m3
r Radius m
Rp particle radius m
Re Reynolds Number Sc Schmidt Number Sh Sherwood Number
t time s
T Temperature K
Tg Gas Temperature K
T0 Initial Temperature K
Tp Particle Temperature K
T∞ Ambient Temperature K
Tavg Average Temperature K
Vp Volume of particle m3
X Moisture content kg
moisture/kg dry solid Xavg Average Moisture content kg moisture/kg dry solid
X0 Initial Moisture content kg
moisture/kg dry solid
Xe Equilibrium Moisture content kg
moisture/kg dry solid Ys Absolute air humidity at
interface
kg vapor/kg dry air Ye Equilibrium air humidity at
interface
kg vapor/kg dry air Y∞ Ambient air humidity at
interface
kg vapor/kg dry air
Greek Symbols
ρp Particle density kg/m3
ρ density kg/m3
REFERENCES
Bak, Y. C., Son, J. E. and Kim, S. D., Heat transfer characteristics of a vertical tube in a fluidized bed combustor. Int. Chem. Eng., 29, (1), 166-176 (1989).
Botterill, J. S. M., Fluid bed heat transfer. Academic Press, London, pp. 145-228 (1975).
Cordova-Quiroz, V. A., Ruiz-Cabrela, M. A., Garcija-Alvarado, M. A., Analytical solution of mass transfer equation with interfacial resistance in food drying. Drying Technology, 14, (7/8), pp. 1815-1826 (1996).
Dandee, S., Meeso, N., Soponronnarit, S., Siriamornpun, S., Reducing cracking and breakage of soybean grains under combined near- infrared radiation and fluidized–bed drying. Journal of Food Engineering‚ 104, (1), 6-13 (2011).
Earle, R. L., Unit operations in food processing. Second Edition, Pergamon Press, Oxford (1992). Ginzburg, A. S., Application of infrared radiation in
food processing. London, Leonard Hill Books (1969).
Hatamipour, M. S., Mowla. D., Experimental and theoretical investigation of drying of carrots in a fluidized bed with energy carrier. Drying Technology, Vol. 21, No. 1, pp. 83-101 (2003). Hebber, U. H., Vishwanathan, K. H., Ramesh, M. N.,
Development of combined infrared and hot air dryer for vegetables. Journal of Food Eng., 65, 557-563 (2004).
Isengard, H. D. and Prager, H., Water determination in products with high sugar content by infrared drying. Food Chemistry, 82, 161-167 (2003). Kiranoudis, C. T., Maroulis, Z. B., Tsami, E.,
Marinos-Kouris, D., Equilibrium moisture content and heat of desorption of some vegetables. Journal of Food Engineering, v. 20, p. 55-74 (1993).
Lozano, J. E., Rotstein, E. and Urbicain, M. J., Shrinkage, porosity and bulk density of foodstuffs at changing moisture contents. Journal of Food Science, 48, 1497 (1983).
Meeso, N., Modeling of far-infrared irradiation in paddy drying process. Journal of Food Engineering, vol. 78, no. 4, pp. 1248-1258 (2006). (Accessed in February, 2007).
Mult, A., Berna, A., Borras, M. and Pinaga, F., Effect of air flow rate on drying of carrots. Drying Tech., 5, (2), 245-258 (1987).
Nazghelichi, T., Kianmehr, M. H., Aghbashlo, M., Thermodynamic analysis of fluidized bed drying
of carrot cubes. Energy‚ 35, (12), 4679-4684 (2010).
Nomura, K. and Farrell, P. V., Heat and mass transfer coefficient for porous horizontal cylinders. AIChE Journal, 31, 1217-1219 (1985).
Promvonge, P., Boonloi, A., Pimsarn, M., Thianpong, C., Drying characteristics of peppercorns in a rectangular fluidized bed with triangular wavy walls. International Communications in Heat and Mass Transfer, 38, (9), 1239-1246 (2011).
Ranjan, R., Irudayaraj, J. and Jun, S., Simulation of infrared drying process. Drying Technology, 20, (2), 363-379 (2002).
Rizzi, Jr.‚ A. C.‚ Passos‚ M. L. and Freire‚ J. T., Modeling and simulating the drying of grass seeds (Brachiaria brizantha) in fluidized bed: evaluation of heat transfer coefficients. Braz. J. Chem. Eng‚ 26, (3) 545-554 (2009).
Salagnac, P., Glouannec, P. and Lecharpentier, D., Numerical modeling of heat and mass transfer in porous medium during combined hot air, infrared and microwave heating. International Journal of Heat and Mass Transfer, 47, 4479-4489 (2004). Sandu, C., Infrared radiative drying in food
engineering: a process analysis. Biotechnology Progress, 2, (3), pp. 109-155 (1986).
Sakai, N., Hazawa, T., Applications and advances in far-infrared heating in Japan. Trends in Food Science & Technology, 5, (11), 357-362 (1994) Sharma, G. P., Verma, R. C., Pathare, P. B.,
Thin-layer infrared radiation drying of onion slices. Journal of Food Engineering, 67, 361-366 (2005a). Sharma, G. P., Verma, R. C., Pathare, P. B., Mathematical modelling of infrared radiation thin layer drying of onion slices. Journal of Food Engineering, 71, 282-286 (2005b).
Soojin, J. and Irudayaraj, J., Selective far infrared heating system- design and evaluation. Part I, Drying Technology, 21, (1), 51-67 (2003).
Stakic‚ M.‚ Bangac‚ M. and Urosevic‚ T., Numerical study on hygroscopic material drying in packed bed. Braz. J. Chem. Eng.‚ 28, (2), 273-284 (2011). Togrul, H., Suitable drying model for infrared drying
of carrot. Journal of Food Engineering, 77, (3), 610-619 (2006).