Received March 3rd, 2010, Revised April 6th, 2011, Accepted for publication April 18th, 2011. Copyright © 2011 Published by LPPM ITB, ISSN: 1978-3043, DOI: 10.5614/itbj.sci.2011.43.3.2
Magnetic and Electrical Properties of Leachate
Kartika Kirana1, Nurul Aufa2, Estevanus Huliselan3 & Satria Bijaksana2
1
Fac. of Mathematics and Natural Sciences, Padjadjaran University, Bandung, Indonesia 2
Faculty of Mining and Petroleum Engineering, Institut Teknologi Bandung, Indonesia 3
Faculty of Teaching and Educational Sciences, Pattimura University, Ambon Email: kartika@phys.unpad.ac.id
Abstract. Heavy metals content as well as magnetic and electrical properties of leachate from Sarimukti, West Java were studied in an attempt to seek correlation between heavy metals content and magnetic/electrical properties. Such correlation is expected to open the way for the use of magnetic/electrical properties as proxy indicators for the concentration of heavy metals in the leachate. The number of leachate samples studied is 21; 15 were taken spatially at depth of 1 m while the remaining 6 samples were taken vertically at a particular point. Measurement results showed that the heavy metals content in the leachate has a smaller concentration, except for Fe. The correlation between magnetic susceptibility and heavy metals content was found to be not so significant. The best correlation coefficient between magnetic susceptibility with heavy metals in leachate was found in Zn. Correlation between electrical conductivity and heavy metal is also not so significant, except for Zn and Cd. The use of magnetic properties as proxy indicator for heavy metals content in leachate is plausible provided that the magnetic susceptibility exceeds certain threshold value. Correlation between magnetic susceptibility, electrical conductivity and heavy metal content would be good if each quantity has a large value.
Keywords: electrical conductivity; heavy metals content; leachate; magnetic susceptibility; municipal solid waste.
1
Introduction
Since leachate is hazardous to the environment, it needs to be monitored closely. The monitoring system is expected to be quantitative so that proper evaluation could be done.
Leachate has physical, chemical, and biological properties that can be measured quantitatively [6,7]. Physical properties of leachate can be measured, among others, by measuring magnetic parameters, including magnetic susceptibility and magnetic mineralogy [5] and by electrical conductivity [8]. Meanwhile, leachate might contain many other constituents, including heavy metals in considerable concentrations [9]. Heavy metals (such as Fe, As, Cd, Cr, Hg, Ni, Zn, Cu, Pb, and Co) are known to be found in leachate [5].
Earlier studies [1,5] have identified the presence of magnetic minerals and heavy metals content in leachate sludge from Sarimukti, an MSW near Bandung, Indonesia. The predominant magnetic mineral in the sludge was found to be magnetite, while the heavy metals content in the sludge was found to be much higher than the maximum allowable standard for liquid waste.
In this study, the suitability of magnetic and electrical properties as proxy indicators of heavy metals content in liquid leachate is tested. Magnetic and electrical properties are relatively easy to measure allowing the quality of leachate to be measured quantitatively. The measured magnetic property is magnetic susceptibility, while the measured electrical property is electrical conductivity. The results would be correlated with heavy metals content. Such correlations have been observed previously as significant correlation between magnetic susceptibility and heavy metals content in leachate sludge from Bandung, Indonesia and significant correlation between electrical conductivity and Cl content in leachate from Dal Skog and Esval landfill, Norway [5,10].
2
Methodology
2.1
Site Descriptions and Sampling Methods
Sampling is conducted on October 10, 2009 at a depth of 1 meter in 15 different lateral positions and 6 vertical positions (see Figure 1 for sampling positions). The liquid leachate sample was taken using a modified water pump on board of a rubber boat. The pump is made of acrylic pipe with external diameter of 16 mm that is connected to a water pump. The liquid sample should be obtained right from the location of the pipe. This method ensures that each sample would have roughly the same amount of particles and colloids [9].
The total number of samples taken from Sarimukti is 21, consisting of 15 samples taken laterally at a depth of 1 meter (SP1 to SP 15 in Figure 1) and 6 samples taken vertically (SV1 to SV6) from the center of the pond. Each sample consists of 5 liters liquid for magnetic susceptibility and electrical conductivity measurement plus a 100 ml sample for chemical analyses. The 100 ml samples were mixed with nitric acid (HNO3) solution to prevent any chemical changes [11-12].
2.2
Leachate Measurements
All 21 samples were chemically analyzed for heavy metals content using an AAS (Atomic Absorption Spectrometer). The measured heavy metals are Cr, Hg, Zn, Cu, Pb, Cd, and Fe. This chemical analysis was carried out at the Center for Geological Survey in Bandung.
The measurement of magnetic susceptibility, in the form of volume-based magnetic susceptibility, was conducted on the liquid leachate placed in a standard plastic holder that is 10 ml in volume. The sample was also measured for its mass using an Ohaus analytical balance. The mass-based magnetic
susceptibility (χLF) was measured using a Bartington MS2 Susceptibility Meter
(Bartington Instruments Ltd., Oxford, United Kingdom) set at the frequency of 470 Hz. Magnetic susceptibility was also measured for solid samples that we obtained by centrifuging the liquid samples for 1.5 hour at the speed of about 3600 rpm.
Electrical conductivity was measured using the Oyster pH/Conductivity + TDS meters. The electrical conductivity was measured by dipping the probe into the liquid leachate. The results will be displayed directly in the instruments.
3
Results and Discussion
3.1
Heavy Metals Content in Leachate
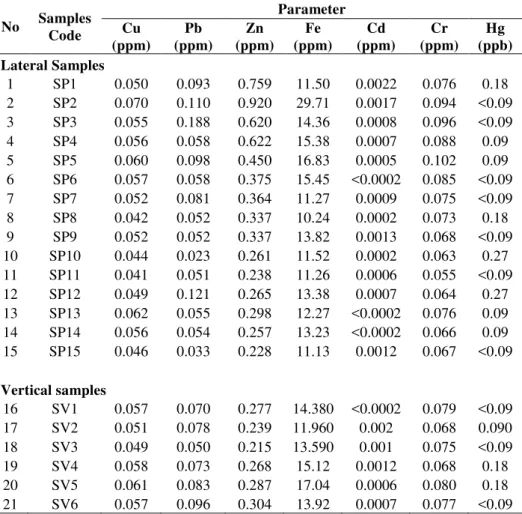
compared to that of other metals. For instance, the average value of Fe is 14.09 mg/L, whereas the average value of the other metals such as Cu is only 0.053 mg/L. Compared to the value of Fe from Dal Skog landfilling site in Norway with Fe concentration between 138 to 154 mg/L [10], the Fe content in this study is very small.
(a) (b)
Figure 1 The position of sample taking laterally (a); the position of sample taking vertically (b).
Table 1 Heavy metals content of leachate for lateral and vertical samples.
No Samples Code Parameter Cu (ppm) Pb (ppm) Zn (ppm) Fe (ppm) Cd (ppm) Cr (ppm) Hg (ppb) Lateral Samples
1 SP1 0.050 0.093 0.759 11.50 0.0022 0.076 0.18 2 SP2 0.070 0.110 0.920 29.71 0.0017 0.094 <0.09 3 SP3 0.055 0.188 0.620 14.36 0.0008 0.096 <0.09 4 SP4 0.056 0.058 0.622 15.38 0.0007 0.088 0.09 5 SP5 0.060 0.098 0.450 16.83 0.0005 0.102 0.09 6 SP6 0.057 0.058 0.375 15.45 <0.0002 0.085 <0.09 7 SP7 0.052 0.081 0.364 11.27 0.0009 0.075 <0.09 8 SP8 0.042 0.052 0.337 10.24 0.0002 0.073 0.18 9 SP9 0.052 0.052 0.337 13.82 0.0013 0.068 <0.09 10 SP10 0.044 0.023 0.261 11.52 0.0002 0.063 0.27 11 SP11 0.041 0.051 0.238 11.26 0.0006 0.055 <0.09 12 SP12 0.049 0.121 0.265 13.38 0.0007 0.064 0.27 13 SP13 0.062 0.055 0.298 12.27 <0.0002 0.076 0.09 14 SP14 0.056 0.054 0.257 13.23 <0.0002 0.066 0.09 15 SP15 0.046 0.033 0.228 11.13 0.0012 0.067 <0.09
Vertical samples
16 SV1 0.057 0.070 0.277 14.380 <0.0002 0.079 <0.09 17 SV2 0.051 0.078 0.239 11.960 0.002 0.068 0.090 18 SV3 0.049 0.050 0.215 13.590 0.001 0.075 <0.09 19 SV4 0.058 0.073 0.268 15.12 0.0012 0.068 0.18 20 SV5 0.061 0.083 0.287 17.04 0.0006 0.080 0.18 21 SV6 0.057 0.096 0.304 13.92 0.0007 0.077 <0.09
During the time of sampling, the leachate pond in Sarimukti was running quite fast. This also supports our observation that there is variation of heavy metals content in both spatial and vertical distribution. Therefore, distribution of heavy metals content in leachate, to some extent, reflects the mobility of leachate in the pond.
Leachate contains dissolved and colloidal fractions that would affect the mobility of heavy metals within the leachate pond. The flow of leachate within the pond is not always laminar. Thus, turbulence in leachate flows for example during rain seasons could also affect the distribution pattern of heavy metals in leachate.
3.2
Magnetic Properties of Leachate
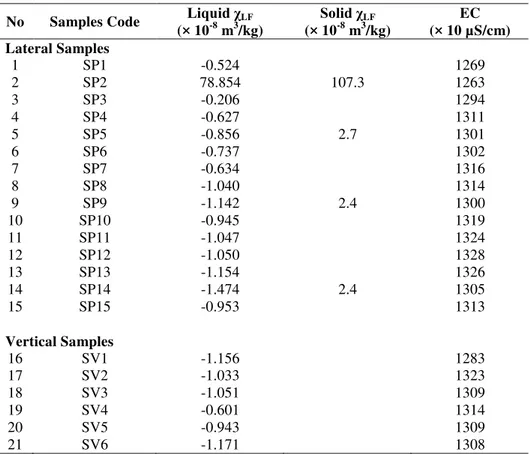
Mass susceptibility measurements of leachate show that the greatest value of magnetic susceptibility was found for SP2 sample (78.85 × 10⁻⁸ m3/kg), whereas the values for the other 14 samples are close to zero (Table 2). Mass susceptibility measurement of leachate samples taken vertically shows that the magnetic susceptibility of all samples are less than zero (Table 2). Therefore, the variation of mass susceptibility values both in lateral and vertical samples are small. The measurement for solid leachate samples shows that the mass susceptibility for most samples is around 2.5 × 10⁻⁸ m3/kg, except for SP2 that is 107.3 × 10⁻⁸ m3/kg (Table 2). This low value of magnetic susceptibility infers that the liquid leachate has a very small magnetic content. SP2 sample is peculiar compared to other samples as it has reasonably high magnetic susceptibility indicating higher concentration of magnetic minerals. SP2 is located right at the inflow channel to leachate pond, where sediments and solid particulates accumulate creating small dirt island. Thus, compared to other samples, SP2 is thicker and contains more solid particulates.
As expected, the mass magnetic susceptibility of liquid leachate would be much smaller than that of leachate sludge [1]. In leachate sludge, magnetic minerals accumulate over period of time causing higher magnetic susceptibility. Magnetic minerals content in leachate could also be affected by magnetic minerals content in both waste and soils. It could also be influenced by the time of accumulation so that leachate from older sites should generally be more magnetic than that from younger sites.
seasons. In the literature, other factors have also been suggested to play an important part in magnetic minerals accumulation in leachate. Those factors include humidity, water infiltration and hydrological condition. Solid waste decomposes faster in humid condition while water infiltration and suitable hydrological condition could speed up leachate production.
Table 2 Magnetic susceptibility and EC of lateral and vertical liquid leachate samples.
No Samples Code Liquid χLF
(× 10-8 m3/kg)
Solid χLF
(× 10-8 m3/kg)
EC (× 10 µS/cm) Lateral Samples
1 SP1 -0.524 1269
2 SP2 78.854 107.3 1263
3 SP3 -0.206 1294
4 SP4 -0.627 1311
5 SP5 -0.856 2.7 1301
6 SP6 -0.737 1302
7 SP7 -0.634 1316
8 SP8 -1.040 1314
9 SP9 -1.142 2.4 1300
10 SP10 -0.945 1319
11 SP11 -1.047 1324
12 SP12 -1.050 1328
13 SP13 -1.154 1326
14 SP14 -1.474 2.4 1305
15 SP15 -0.953 1313
Vertical Samples
16 SV1 -1.156 1283
17 SV2 -1.033 1323
18 SV3 -1.051 1309
19 SV4 -0.601 1314
20 SV5 -0.943 1309
21 SV6 -1.171 1308
3.3
Electrical Conductivity of Leachate
The results of electrical conductivity measurements show that sample SP12 has the greatest value of electrical conductivity relative to the other lateral samples (Table 2). Meanwhile, sample SP2 has the smallest electrical conductivity. Electrical conductivity values for samples SP12 and SP2 are respectively 1328
(× 10 μS/cm) and 1263 (× 10 μS/cm). The electrical conductivity measurements for vertical samples show that SV1 and SV2 have respectively the smallest
electrical conductivity for sites in another country, it is clear that they are of comparable values [9].
Although SP2 has the highest value of magnetic susceptibility among the 15 lateral samples, it has the lowest electrical conductivity. This implies that SP2 has lower concentration of conducting ions. No specific relationship between magnetic susceptibility and electrical conductivity was found for other samples. Therefore, the low electrical conductivity in SP2 could only be explained by the physical nature of SP2. Compared to the other samples, SP2 is more viscous. Viscous liquid leachate contains less liquid per volume than the less viscous ones. As conductivity is carried by the liquid part instead of by the solid part, less viscous liquid leachate would have higher electrical conductivity than that of more viscous one. It is likely that the ions mobility in this sample is somehow smaller than that of the other samples giving low value of electrical conductivity. The electrical conductivity is a valuable indicator of the amount of dissolved materials in water [13]. The value of electrical conductivity depends on the quantity of dissolved particles as some of these particles could be conducting ions [12].
3.4
Relationship between Heavy Metals Content, Magnetic
Susceptibility, and Electrical Conductivity
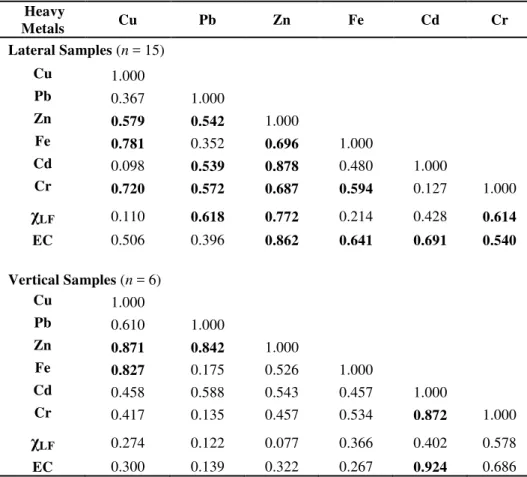
Table 3 Matrices showing correlation coefficients (r’s values) between heavy metals contents and physical parameters (magnetic susceptibility and electrical conductivity) for lateral and vertical liquid leachate samples. The 95% level of confidence (p = 0.05) requires that r > 0.514 (for n = 15) and r > 0.811 (for n = 6). Coefficients that satisfy such requirement are written in bold characters.
Heavy
Metals Cu Pb Zn Fe Cd Cr
Lateral Samples (n = 15)
Cu 1.000
Pb 0.367 1.000
Zn 0.579 0.542 1.000
Fe 0.781 0.352 0.696 1.000
Cd 0.098 0.539 0.878 0.480 1.000
Cr 0.720 0.572 0.687 0.594 0.127 1.000
χ
LF 0.110 0.618 0.772 0.214 0.428 0.614EC 0.506 0.396 0.862 0.641 0.691 0.540
Vertical Samples (n = 6)
Cu 1.000
Pb 0.610 1.000
Zn 0.871 0.842 1.000
Fe 0.827 0.175 0.526 1.000
Cd 0.458 0.588 0.543 0.457 1.000
Cr 0.417 0.135 0.457 0.534 0.872 1.000
χ
LF 0.274 0.122 0.077 0.366 0.402 0.578EC 0.300 0.139 0.322 0.267 0.924 0.686
correlation between Fe and magnetic susceptibility is shown only in samples whose magnetic susceptibility exceeds 176 × 10-8 m3/kg [14].
Figure 2 Plots of magnetic susceptibility (χLF) versus Zn and versus Pb for the 15 lateral samples, except for SP2.
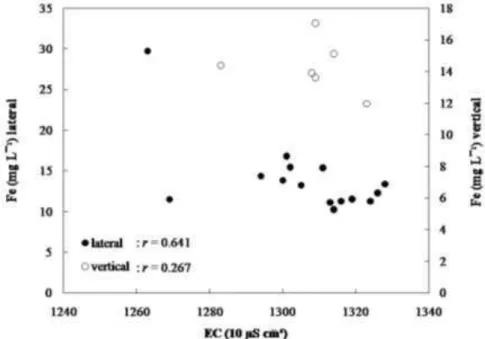
Figures 4 and 5 show examples of correlation between Zn and Fe content with electrical conductivity for the lateral and vertical samples measured by The Oyster pH/Conductivity + TDS meters. In general, the correlations between electrical conductivity and heavy metals content are poor or insignificant (Table 3). Compared with other metals, Zn is better correlated in the lateral samples with correlation coefficient of 0.862 (Figure 4), but the correlation coefficient in the vertical sample is only 0.322 (Figure 4). Meanwhile Fe is the most abundance heavy metal in leachate. The correlation between electrical conductivity and Fe, however, is rather poor for with correlation coefficient of 0.641 for lateral samples (Figure 5) and of 0.267 for vertical samples (Figure 5). Although the Fe content in the liquid leachate samples is higher than that of Zn content, the Fe content is still insignificant. For instance the Fe content in leachate sludge vary from 195.40 to 5418.80 ppm, while that of Zn vary only from 0.48 to 3.21 ppm [1]. Thus, relatively speaking, the Zn content in liquid leachate of 0.215 to 0.920 ppm is more important than that of Fe that vary only from 10.24 to 29.71 ppm.
r = 0.772
Figure 3 Plots of magnetic susceptibility (χLF) versus Cr and versus Fe for the 6 vertical samples.
Figure 4 Plots of electrical conductivity (EC) versus Zn for the 14 lateral samples and the 6 vertical samples.
Based on the correlation between Zn and Fe with electrical conductivity, it is still plausible to use electrical conductivity as proxy indicator for certain heavy
r = 0.862
r = 0.322
r = 0.578
metals content. The sensitivity of electrical conductivity as proxy indicator for heavy metals content would depend on the types of metals. Metals that are higher in concentration or associated with conductivity, such as Zn could likely be inferred from electrical conductivity. Other metals, that are not associated with electrical conductivity or very small in quantity, such as Cd could not be estimated from electrical conductivity.
Figure 5 Plots of electrical conductivity (EC) versus Fe for the 14 lateral samples and the 6 vertical samples.
4
Conclusions
Based on the results and discussion the following conclusions are drawn:
1. Heavy metals content from samples taken at the Sarimukti MSW, both laterally and vertically have a lower value than minimum allowable standard for liquid waste, except for Fe metal. The small heavy metals content in leachate could arise from the fact that the heavy metals input to leachate pond are insignificant. Great variations in heavy metals content between both lateral and vertical samples reflect the mobility of leachate in the pond and the age of landfill site.
leachate has a very small magnetic content. Since magnetic content is likely to be seasonal, further studies at different season would be invaluable. 3. The results of electrical conductivity measurements showed that the leachate
is conductive. The conductivity depends on ions mobility in the sample. Electrical conductivity of leachate in Sarimukti is in comparable values with another country.
4. Measurement of heavy metal contents is a standard analysis to evaluate a pollution level. However, as far as the authors are concerned, this study is a first ever attempt to correlate heavy metal contents and electrical conductivity. The correlation between magnetic susceptibility and heavy metals content was poor. These are likely due to the fact that the leachate in this study is poorly magnetic and it has small heavy metals content. The correlation could be more significant in other sites. In general, the correlations between electrical conductivity and heavy metals content are poor or insignificant. It is still plausible to use electrical conductivity as proxy indicator for certain heavy metals content. Metals that are higher in concentration or associated with conductivity, such as Zn could likely be inferred from electrical conductivity.
Acknowledgements
Special thanks Ms Venny Haris and Ms. Rahmi P. Wirman for their assistance in sample measurements. We also express our gratitude to Dr. Indra Noviandri for his permission to use the facilities at the Inorganic Chemistry Laboratory. The clarity of this paper was improved by constructive comments and criticisms from the reviewers (Professor Doddy Sutarno and Dr. Hendra Grandis).
References
[1] Huliselan, E. K., Sifat-sifat Magnetik sebagai Proxy Indikator Kandungan Logam Berat pada Lumpur Lindi, Ph.D. Dissertation, Institut Teknologi Bandung, Bandung, 2009.
[2] Ziyang, L., Xiaoli, C., Dongjie, N., Yuanyang, O. & Youcai, Z., Size Fractionation and Characterization of Landfill Leachate and The Improvement of Cu2+ Adsorption Capacity In Soil And Aged Refuse, Waste Management, 29, 143-152, 2009.
[3] Salem, Z., Hamouri, K., Djemaa, R. & Allia, K., Evaluation of Landfill Leachate Pollution and Treatment, Desalination, 220, 108 – 114, 2008. [4] Renou, S., Givaudan, J. G., Poulain, S., Dirassouyan, F. & Moulin.,
Landfill Leachate Treatment: Review and Opportunity, Journal of Hazardous Materials, 150, 268 – 493, 2008.
[6] Qasim, S. R. & Chiang, W., Sanitary Landfill Leachate: Generation, Control, and Treatment, Technomic Publishing Company, 1994.
[7] Al Sabahi, E., Rahim, A. S., Zuhairi, W. Y. W., Al Nozaily, F. & Alshaebi, F., The characteristic of Leachate and Groundwater Pollution at Municipal Solid Waste Landfill of Ibb City, Yemen, American Journal of Environmental Sciences, 5, 256 – 266, 2009.
[8] Irianto, E. W., Machbub & Badruddin, Pengaruh Multiparameter Kualitas Air terhadap Parameter Indikator Oksigen Terlarut dan Daya Hantar Listrik (Studi Kasus Citarum Hulu), Jurnal Lingkungan Perairan,
54, 59 – 65, 2004.
[9] Baun, D. L. & Christensen, T. H, Speciation of Heavy Metals in Landfill Leachate: A Review, Waste Management and Research, 22, 3 – 23, 2004. [10] Haarstad, K. & Mæhlum, T., Electrical Conductivity and Chloride
Reduction in Leachate Treatment Systems, Journal of Environmental Engineering, 133, 659 – 664, 2007.
[11] Maramis, A. A., Kristijanto, A. I. & Notosoedarmo S., Sebaran Logam Berat dan Hubungannya dengan Faktor Fisiko-Kimiawi di Sungai Kreo, Dekat Buangan Air Lindi TPA Jatibarang, Kota Semarang, Akta Kimindo, 1, 93 – 98, 2006.
[12] Baroto & Siradz, S. A., Taraf Pencemaran dan Kandungan Kromium (Cr) pada Air dan Tanah di Daerah Aliran Sungai Code Yogyakarta, Jurnal Ilmu Tanah dan Lingkungan, 6, 82 – 100, 2006.
[13] Mor, S., Ravindra, K., Visecher, A., Dahiya, R. P. & Chandra, A., Municipal Solid Waste Characterization and Its Assessment for Potential Methane Generation: A Case Study, Science of The Total Environment,
371, 1 – 10, 2006.