Coupling News Sentiment with Web Browsing
Data Improves Prediction of Intra-Day Price
Dynamics
Gabriele Ranco1*, Ilaria Bordino2, Giacomo Bormetti3,4, Guido Caldarelli1,5,6, Fabrizio Lillo3,4, Michele Treccani4,7
1IMT Institute for Advanced Studies, Piazza San Francesco 19, 55100 Lucca, Italy,2Yahoo Labs, Barcelona, Spain,3Scuola Normale Superiore, Piazza dei Cavalieri 7, 56126 Pisa, Italy,4QUANTLab, Via Pietrasantina 123, 56122 Pisa, Italy,5ISC-CNR, Via dei Taurini 19, 00185 Roma, Italy,6London Institute for Mathematical Science, South St. 35 Mayfair, London W1K 2XF, United Kingdom,7Mediobanca S.p.A, Piazzetta E. Cuccia 1, 20121 Milano, Italy
Abstract
The new digital revolution of big data is deeply changing our capability of understanding society and forecasting the outcome of many social and economic systems. Unfortunately, information can be very heterogeneous in the importance, relevance, and surprise it con-veys, affecting severely the predictive power of semantic and statistical methods. Here we
show that the aggregation of web users’behavior can be elicited to overcome this problem
in a hard to predict complex system, namely the financial market. Specifically, our in-sample analysis shows that the combined use of sentiment analysis of news and browsing activity of users of Yahoo! Finance greatly helps forecasting intra-day and daily price changes of a
set of 100 highly capitalized US stocks traded in the period 2012–2013. Sentiment analysis
or browsing activity when taken alone have very small or no predictive power. Conversely,
when considering anews signalwhere in a given time interval we compute the average
sen-timent of the clicked news, weighted by the number of clicks, we show that for nearly 50% of
the companies such signal Granger-causes hourly price returns. Our result indicates a“
wis-dom-of-the-crowd”effect that allows to exploit users’activity to identify and weigh properly
the relevant and surprising news, enhancing considerably the forecasting power of the news sentiment.
Introduction
The recent technological revolution with widespread presence of computers, users and media connected by Internet has created an unprecedented situation of data deluge, changing dramat-ically the way in which we look at social and economic sciences. As people increasingly use the Internet for information such as business or political news, online activity has become a mirror of the collective consciousness, reflecting the interests, concerns, and intentions of the global
OPEN ACCESS
Citation:Ranco G, Bordino I, Bormetti G, Caldarelli G, Lillo F, Treccani M (2016) Coupling News Sentiment with Web Browsing Data Improves Prediction of Intra-Day Price Dynamics. PLoS ONE 11(1): e0146576. doi:10.1371/journal.pone.0146576
Editor:Wei-Xing Zhou, East China University of Science and Technology, CHINA
Received:March 19, 2015
Accepted:December 18, 2015
Published:January 25, 2016
Copyright:© 2016 Ranco et al. This is an open access article distributed under the terms of the
Creative Commons Attribution License, which permits unrestricted use, distribution, and reproduction in any medium, provided the original author and source are credited.
Data Availability Statement:For access to a similar proprietary dataset, please contact Research Scientist Nicola Barbieri ([email protected]). Access to proprietary data will be possible provided that a collaboration with Yahoo is established. Financial data were acquired from the sitehttp://www. kibot.com/Historical_Data/Russell_3000_Historical_ Tick_Data.aspxand, in our same way, anyone can request them [email protected].
population with respect to various economic, political, and cultural phenomena. Humans’ interactions with technological systems are generating massive datasets documenting collective behaviour in a previously unimaginable fashion [1,2]. By properly dealing with such data col-lections, for instance representing them by means of network structures [3,4], it is possible to extract relevant information about the evolution of the systems considered (i.e. trading [5], dis-ease spreading [6,7], political elections [8]).
A particularly interesting case of study is that of the financial markets. Markets can be seen as collective decision making systems, where exogenous (news) as well as endogenous (price movements) signals convey valuable information on the value of a company. Investors contin-uously monitor these signals in the attempt of forecasting future price movements. Because of their trading based on these signals, the information is incorporated into prices, as postulated by the Efficient Market Hypothesis [9]. Therefore the flow of news and data on the activity of investors can be used to forecast price movements. The literature on the relation between news and price movement is quite old and vast. In order to correlate news and price returns one needs to assess whether the former is conveying positive or negative information about a com-pany, a particular sector or on the whole market. This is typically done with the sentiment anal-ysis, often performed with dedicated semantic algorithms as described and reviewed in the Methods Section.
In this paper, we combine the information coming from the sentiment conveyed by public news with the browsing activity of the users of a finance specialized portal to forecast price returns at daily and intra-day time scale. To this aim we leverage a unique dataset consisting of a fragment of the log of Yahoo! Finance, containing the news articles displayed on the web site and the respective number of“clicks”, i.e. the visualizations made by the users. Our analysis considers 100 highly capitalized US stocks in a one-year period between 2012 and 2013.
For each of these companies we build a signed time series of the sentiment expressed in the related news. The sentiment expressed in each article mentioning a company is weighted by the number of views of the article. In our dataset each click action is associated with a time-stamp recording the exact point in time when such action took place. Thus we are able to con-struct time series at the time resolution of the minute. To the best of our knowledge, this is the first time that an analysis like the one described in this paper is conducted at such intra-day granularity. The main idea behind this approach is that the sentiment analysis gives informa-tion on the news, while the browsing volume enable us to properly weigh news according to the attention received from the users.
We find that news on the same company are extremely heterogeneous in the number of clicks they receive, an indication of the huge difference in their importance and the interest these news generate on users. For 70% of the companies examined, there is a significant corre-lation between the browsing volumes of financial news related to the company, and its traded volumes or absolute price returns. More important, we show that for more than 50% of the companies (at hourly time scale), and for almost 40% (at daily time scale), the click weighted average sentiment time series Granger-cause price returns, indicating a rather large degree of predictability.
Data
Stocks considered
Our analysis is conducted on highly capitalized stocks belonging to the Russell 3000 Index traded in the US equity markets, which we monitor for a period of one year between 2012 and 2013. Among all companies, we selected the 100 stocks with the largest number of news pub-lished onYahoo! Finance during the investigated period. The ticker list of the investigated
Reduction Agency, grant HDTRA1-11-1-0048; Progetto di Interesse CNR CrisisLab; and EUROPEAN COMMISSION CRISIS-ICT-2011-288501. The authors declare that Michele Treccani is working for Mediobanca S.p.A. and Ilaria Bordino is working for Yahoo! Labs. The authors also declare that QUANTLab is not a commercial affiliation. Mediobanca S.p.A. and Yahoo! Labs provided support in the form of salaries for authors IB and MT but did not have any additional role in the study design, data collection and analysis, decision to publish, or preparation of the manuscript. The specific roles of these authors are articulated in the“author contributions”section.
stocks with a distinctive numerical company identifier follows: 1 KBH, 2 LEN, 3 COST, 4 DTV, 5 AMGN, 6 YUM, 7 UPS, 8 V, 9 AET, 10 GRPN, 11 ZNGA, 12 ABT, 13 LUV, 14 RTN, 15 HAL, 16 ATVI, 17 MRK, 18 GPS, 19 GILD, 20 LCC, 21 NKE, 22 MCD, 23 UNH, 24 DOW, 25 M, 26 CBS, 27 COP, 28 CHK, 29 CAT, 30 HON, 31 TWX, 32 AIG, 33 UAL, 34 TXN, 35 BIIB, 36 WAG, 37 PEP, 38 VMW, 39 KO, 40 QCOM, 41 ACN, 42 NOC, 43 DISH, 44 BBY, 45 HD, 46 PG, 47 JNJ, 48 AXP, 49 MAR, 50 TWC, 51 UTX, 52 MA, 53 BLK, 54 EBAY, 55 DAL, 56 NWSA, 57 MSCI, 58 LNKD, 59 TSLA, 60 CVX, 61 AA, 62 NYX, 63 JCP, 64 CMCSA, 65 NDAQ, 66 IT, 67 YHOO, 68 DIS, 69 SBUX, 70 PFE, 71 ORCL, 72 HPQ, 73 S, 74 LMT, 75 XOM, 76 IBM, 77 NFLX, 78 INTC, 79 CSCO, 80 GE, 81 WFC, 82 WMT, 83 AMZN, 84 VOD, 85 DELL, 86 F, 87 TRI, 88 GM, 89 FRT, 90 VZ, 91 FB, 92 BAC, 93 MS, 94 JPM, 95 C, 96 BA, 97 GS, 98 MSFT, 99 GOOG, 100 AAPL. The numerical identifiers are assigned according to the increasing order of the total number of published news in Yahoo! Finance.
We considered three main sources of data for the selected stocks:
Market data
The first source contains information on price returns and trading volume of the stock at the resolution of the minute. We consider different time scales of investigation, corresponding to 1, 10, 30, 65, and 130 minutes. The above values are chosen because they are sub-multiple of the trading day in the US markets (from 9:30 AM to 4:00 PM, corresponding to 390 minutes). For each time scale and each stock we extract the following time series:
• V, the traded volume in that interval of time,
• R, the logarithmic price return in the time scale,
• σ, the return absolute value, a simple proxy for the stock volatility.
The precise definition of these variables is given inS1 Text. Since trade volumes and abso-lute price returns are known to display a strong intra-day pattern, we de-seasonalize the corre-sponding time series (in the same SI SectionS1 Textwe provide the details about this
procedure). This procedure is necessary in order to avoid the detection of spurious correlation and Granger causality due to the presence of a predictable intra-day pattern.
News data
The second source of data consists of the news published on Yahoo! Finance together with the time series of the aggregated clicks made by the users browsing each page. Yahoo! Finance is a web portal for news and data related to financial companies, offering news and information around stock quotes, stock exchange rates, corporate press releases, financial reports, and mes-sage boards for discussion. Providing consumers with a broad range of comprehensive online financial services and information, Yahoo! Finance has consistently been a leader in its cate-gory: In May 2008 (see www.comscore.com/Insights/Press-Releases/2008/07/Yahoo!-Finance-Top-Financial-News-and-Research-Site-in-US) it was the top financial website with 18.5 mil-lion U.S. visitors, followed by AOL Money & Finance with 15.2 milmil-lion visitors (up 48 percent) and MSN Money with 13.7 million visitors (up 13 percent). As of today, recent estimates released in July 2015 (see www.niemanlab.org/2015/07/newsonomics-how-much-is-the-financial-times-worth-and-who-might-buy-it) confirm that Yahoo! Finance, with more than 72 million visitors, is still the leader finance website in the US, and the fourth in the whole world.
Microsoft) or financial entities (e.g., market indexes, commodities, derivatives) that are men-tioned in its text. The dataset analyzed in this work does not consist of public data. It was extracted from a browsing log of the Yahoo! Finance web portal. The log stores all the actions made by the users who visit the website, such as views, clicks and comments on every page dis-played on the portal. Specifically, we extracted the news articles disdis-played on Yahoo! Finance and the respective number of“clicks”, i.e. the visualizations made by the users. We considered 100 US stocks in a one-year period between 2012 and 2013.
For each considered company we build a signed time series of the sentiment expressed in the related news. The sentiment expressed in each article mentioning a company is weighted by the number of views of the article. In our dataset each click action is associated with a time-stamp recording the exact point in time when such action took place. Thus we are able to con-struct time series at the time resolution of the minute. While building the dataset, we observed the corporate policy of Yahoo with respect to the confidentiality of the data and the tools used in this research. Any sensitive identifier of Yahoo user was discarded after the extraction and aggregation process. Moreover our dataset does not store single actions or users, but only aggregated browsing volumes of financial articles displayed on Yahoo! Finance. Although the original log of Yahoo! Finance is proprietary and cannot obviously be shared, for repeatability of our analysis we can provide the browsing-volume time series extracted for the 100 compa-nies as supplementary material.
In order to automatically detect whether the article is conveying positive or negative news on the company, we perform a sentiment analysis. To obtain a sentiment score, we classify each article withSentiStrength[10], a state-of-the-art tool for extracting positive and negative sentiment from informal texts. The tool is based on a dictionary of“sentiment”words, which are manually picked by expert editors and annotated with a number indicating the amount of positivity or negativity expressed by them. The original dictionary ofSentiStrengthis not tai-lored to any specific knowledge or application domain, thus it is not the most proper choice to compute afinancialsentiment. To solve this issue, following a practice that is common in most research on sentiment analysis and price returns [11], we adapt the original dictionary by incorporating a list of sentiment keywords of special interest and significance for the financial domain [12]. InS1 Textwe discuss the robustness of this choice as well as the way news are associated to stocks.
Supported by previous research that studied stock price reaction to news headlines [13–18], we simplify our data processing pipeline by performing the sentiment analysis computation on the title of each article, instead of using its whole content. The main reason for this choice is that the tone of the news is typically highlighted in the title, while the use in the text of many neutral words can increases the noise and reduces the ability of assessing the sentiment. Finally, the choice also depended on the availability of data: the log at our disposal did not always con-tained the text of the news and this would have forced us to use a significant subsample.
The sentiment score is a simple sign (−1, 0, +1) for each news depending on whether there
are more positive or negative words in the title.
Browsing Data
the clicks on all the articles, even published earlier, that mention a particular company, it is possible to derive an estimation of the attention around that company.
In summary, for each time scale and for each stock, the variables we extract from the data-base are (seeS1 Text):
• C, the time series of the total number of clicks in a time window,
• S, the sum of the sentiment of all news related to each company,
• WS, the sum of the sentiment of all news weighted by the number of clicks.
The first quantityCis non negative and measures the level of attention in a given time inter-val for news about a specific company. TheSvariable is the usual sentiment indicator
employed in numerous studies and provides the aggregated sentiment of the company specific news published in a given time interval. The most important and novel quantity isWS, which combines the two previous ones by assigning a sign to each click depending on the sentiment of the clicked news. As for the market variables, we remove the intra-day pattern from the click time series. In fact, both the publication of news [16] and the clicking activity of users [19] show a strong intra-day seasonality. These patterns are probably related to the way humans carry out their activities during the day (e.g. small activity during lunchtime, more hectic activ-ity at the beginning or at the end of the business day).
Methods
Sentiment Analysis
Regarding the analysis of search-engine queries, some recent works [20–25] have studied the relation between the daily number of queries related to a particular stock and the trading vol-ume over the same stock.
An incomplete list of contributions on the role of news includes studies investigating (i) the relation between exogenous news and price movements [13,26–28], (ii) the correlation between high or low pessimism of media and high market trading volume [14]; (iii) the relation between the sentiment of news, earnings and return predictability [29,30], (iv) the role of news in the trading action [16,31–33]; (v) the role of macroeconomic news in the performance of stock returns [34], and (vi) the high-frequency market reaction to news [35].
For example, in a recent paper [21], related to ours, authors show that daily trading vol-umes of stocks traded at NASDAQ can be forecasted with the daily volvol-umes of queries related to the same stocks. In another paper a similar analysis shows that an increase in queries pre-dicts higher stock prices in the next two weeks [36]. In [25] authors test the explanatory power of investor attention—measured as the search frequency at daily level of stock names in Baidu Index—for abnormal daily returns and find evidence that the former Granger causes stock price returns in excess with respect to the market index return, whereas there is little evidence for the opposite causal relation. As for social networks and micro-blogging plat-forms [37], Twitter data is becoming an increasingly popular choice for financial forecasting. For example some have investigated whether the daily number of tweets predicts SP 500 stock prices [38,39]. A textual analysis approach to Twitter data can be found in other works [15,
40–43] where the authors find clear relations between mood indicators and Dow Jones Indus-trial Average. Some other authors have used news, Wikipedia data or search trends to predict market movements [26,44–46].
frequency, investigated in this paper. Second, as we will empirically show below, the universe of news considered is very heterogeneous in terms of their relevance as a signal of future price movement. For example, in a day there might be several positive but almost irrelevant news and only one negative but very important news on a company. Without weighting the rele-vance of the news, one could easily draw a wrong conclusion. The intuition behind the current work is that the number of times a news is viewed by users is a measure of its importance as well as of the surprise it conveys. Moreover the users we consider are not generic, but are those who use one of the most important news and search portals for financial information, namely Yahoo! Finance.
Spearman Correlation
To overcome these limitations we collected for each stock and for each time scale a total of six time series, namelyV,R,σ,C,S, andWS, and we study their dependence by making use of two tools. First, given two time seriesXtandYt, we consider the Spearman’s correlation coefficient
rðX;YÞ ¼
hrX trY ti hrX tihrY ti
ffiffiffiffiffiffiffiffiffiffiffiffiffiffiffiffiffiffiffiffiffiffiffiffiffiffiffiffiffiffiffiffiffiffiffiffiffiffiffiffiffiffiffiffiffiffiffiffiffiffiffiffiffiffiffiffiffiffiffi
ðhrX2ti hrX ti
2Þðh
rY2ti hrY ti
2Þ
q ð1Þ
whererXtandrYtcorrespond to the rank of thet-th realization of theXandYrandom variables, respectively, andhiis the time average value. The correlationρ(X,Y) quantifies the linear con-temporaneous dependence without relying on the Normal assumption forXandY. In order to assess the statistical significance of the measured value we perform a statistical test of the null hypothesis that the correlation is zero by randomizing the time series.
Granger Causality
Our main goal is testing for the presence of statistical causality between the variables. To this end our second tool is the Granger causality test [47]. Granger’s test is a common test used in time series analysis to determine if a time seriesXtis useful in forecasting another time series
Yt.Xtis said toGranger-cause YtifYtcan be better predicted using both the histories ofXtand
Ytrather than using only the history ofYt. The Granger causality can be assessed by regressing
Yton its own time-lagged values and on those ofXt. An F-test is then used to examine whether
the null hypothesis thatYtis not Granger-caused byXtcan be rejected with a given confidence
level (in this paper we use a p-value of 5%).
Results
The most important aspect of our analysis is to test whether one can forecast financial vari-ables, and more specifically price returns, by using the information on the browsing activity of the users. Namely if, by weighting the sentiment of the clicked news by the number of clicks each news receives, one can improve significantly the predictability of returns.
Heterogenous attention
number of clicks a news receives and therefore in the importance users give to it. It is also a warning that not weighting properly the importance of the news can lead to overstate the importance of the many irrelevant news and to understate the importance of the few really important ones.
Synchronous correlation
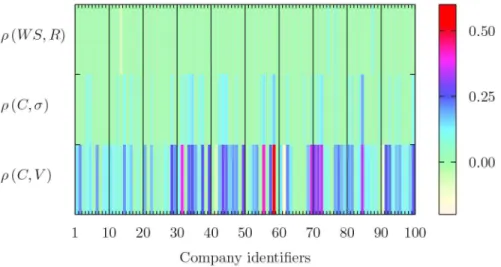
In order to understand how the relation between financial and news variables depends on the time scale, we perform a synchronous correlation analysis. For each of the 100 companies, we compute the Spearman’s correlation coefficientρbetween the three sensible pairs made by one “news”time series and one“financial”time series.Fig 2summarizes the results for the 65 min time series. The x axis lists the companies, uniquely identified by a number that provides the rank of the company in the order from the least to the most cited one (as measured by the abso-lute number of associated news). Thus, 1 corresponds to the company KBH with the least num-ber of news, while 100 to the most cited AAPL. We label the y axis with the pairs (C,V), (C,σ), and (WS,R), while the color scale indicates the level of correlation. We compute the correlation sampling the original time series every 65 minutes, equalizing to zero those values whose signifi-cance does not reject the null hypothesis of zero correlation with 5% confidence.Fig 2shows in general a positive and significant correlation between browsing activity and price volatility and volume, whereas the evidence of linear dependence between sentiment time series and price returns is mild, similarly to the result obtained by Mao [15]. In the fourth row ofTable 1we report the percentage of the 100 companies for which we reject the null hypothesis of zero corre-lation at 5% confidence level and. Since we use multiple correcorre-lation tests in order to establish whether their is a significant relationship between key news and online quantities and key mar-ket variables, inS1 Textwe report results corrected for multiple hypotheses testing. Applying the conservative correction proposed by Bonferroni, the evidence of linear dependence enterily survives for click, volatility, and trade volume time series, whereas the hypothesis of zero-Spear-man’s correlation between price returns and weighted sentiment is no more rejected.
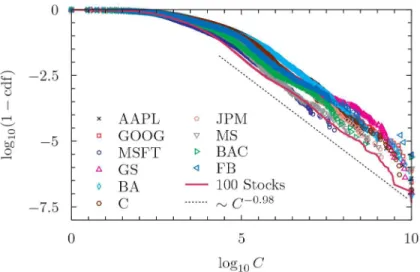
Fig 1. Complementary of the cumulative distribution function of the number of clicks a news receives for the ten assets with the largest number of news and the aggregate portfolio of 100 stocks.Both coordinates have been rescaled by a common factor preserving the power law scaling of the right tail and normalizing the maximum number of clicks to the value 1010. The dotted line corresponds to a power law with tail exponent fitted from the portfolio time series. We provide details about the standard error and the complete list of tail exponents for all the companies inS1 Text.
Time scale
In order to investigate how the correlation changes with the time scale, inTable 1we also show the percentage of rejection for the 1, 10, 30, and 130 minutes time scales. As a general com-ment, we observe that the number of companies with a significant correlation becomes higher at finer time resolution. This is a known fact for market variables (e.g. volume and volatility), while we document it for the first time at intraday scale also for browsing variables. The pres-ence of a significant linear relation between the attention given to news articles (signed on the basis of the sentiment expressed in them) related to a given stock and the price return is mild. In particular the low fraction of companies rejecting the null hypothesis is compatible with the expected number of false positives due to multiple testing. Please refer toS1 Textfor the detailed results of a multiple test based on the Bonferroni correction.
Dynamics of attention
The time scale might in principle depend on the relevance of the news. As we have seen, not all news are equal in terms of the attention they receive from the users. To investigate this depen-dence, we study the dynamics of the number of clicks an article received after its publication. We compute the cumulative number of clicks received by a given news until a given minute after the publication. We perform this for all minutes in a week after the publication. We then normalize
Table 1. Percentage of companies for which we reject the null hypothesis of zero Spearman correla-tion at 5% confidence level.
Time interval (minutes) ρ(WS,R) ρ(C,σ) ρ(C,V)
1 7 86 95
10 3 72 90
30 5 54 85
65 4 36 79
130 4 26 76
doi:10.1371/journal.pone.0146576.t001
Fig 2. Spearman’s correlation coefficients for the de-seasonalized time series of all the 100 companies at hourly scale.The x axis reports the list of companies identified by a unique number, as detailed in the main text. Among the several possibilities, we consider only three couples and the color scale corresponds to the level of correlation. We plot those values for which we reject the null of zero correlation at 5% significance level and equalize non significant values to zero (light green color).
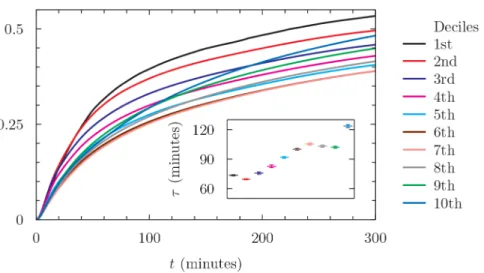
this cumulative time series by dividing it by the total amount of clicks received by the news. We construct ten groups of news based on the deciles of the total number of news they eventually receive, and we compute for each group the average cumulative sum of clicks. The result is shown inFig 3. The inset reports for each decile the typical time scale of attention obtained by an exponential fit of the curves. Remarkably, the time scale of attention is an increasing function of the importance of the news (as measured by the total number of clicks). Irrelevant news are immediately recognized as such, while important news continue to receive attention well after their publication. In general, the time scale of the users’attention ranges between one and two hours after the publication, suggesting that this intraday time scale is probably the most appro-priate to detect dependencies among financial variables and browsing activity.
Causality
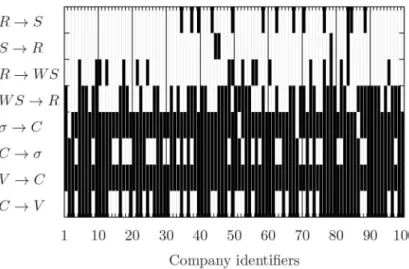
The synchronous correlation is an important measure of dependence, but not necessarily a sign of causality. Thus we perform a causality analysis by applying Granger’s test. We present the results of this analysis, for the 65-minute time horizon, inFig 4. The x axis lists the compa-nies as done inFig 2, while the y axis labels the eight tests that we perform. Black cells corre-spond to rejection of the null hypothesis of no Granger causality, and the opposite for the white cells. When considering the non-negative variables (V,C, andσ) we observe strong causal relations. Specifically, in 65% of the cases the clicking activity causes the trading volume and in 69% of the cases it causes price volatility. The causality is very strong also in the opposite direction, i.e. volume and volatility cause click volume. This is probably due in part to a reac-tion of users to anomalously high activity in the market (in terms of volume and/or volatility), while in part it might be a statistical effect due to the fact that all the three variables are very autocorrelated in time, creating strong Granger causal relations in both directions.
We obtain the most interesting and unexpected results when considering the signed vari-ables (R,S, andWS). All these variables are weakly serially autocorrelated. When we consider the sentiment of the news (S, without the clicks), we find that only in 4% of the casesScauses returns, and in 13% of the cases price return causesS. Especially the first value is expected Fig 3. Time evolution of the cumulative number of clicks per news in a time interval of five hours after the publication.We normalize the cumulated amount by a constant which corresponds to the total number of clicks received by a single news during the first week after publication. The news are grouped in deciles according to the total number of clicks they have received until October 2013 and the curves represent average values. Inset: estimated values and standard errors of the attention time scale obtained by an exponential fit of the decile curves.
under the null, since at 5% confidence level we expect 5% of false positive. This means that the simple sentiment of the news does not allow to forecast price returns at intraday (hourly) time scale. On the contrary, when we consider the clicks weighted by the sentiment of the news (WS), we find that in 53% of the cases it allows predicting returns and only in 19% of the cases the opposite occurs. In general, companies with more news have higher causality. Our conclu-sions are even more striking when correcting the test for multiple hypotheses, as done for the Spearman correlation case. The evidence of causality between price returns and unweighted sentiment of the news almost vanishes whereas the signal of causality between weighted senti-ment and returns entirely survives. Interestingly, the evidence of causality in the opposite direc-tion—i.e. returns Granger-causing weighted sentiment—weakens and an interesting
asymmetric behavior between the two directions clearly emerges. InS1 Textwe report the table with detailed results.
Weighting news by users
’
browsing behavior
These results show that, on a hourly time scale, the simple news sentiment time series alone (i.e. the one without browsing activity) is not able to predict the price returns; instead, if we add the information provided by the browsing activity, we are then able to properly weigh the news (and its sentiment) by the importance the users give to it by clicking the page. Thus, we find the interesting result that the browsing activity combined with the sentiment analysis of the news increases significantly the level of prediction of price returns for the stocks.
Comparison with existing literature
Most of the existing studies on sentiment and predictability of returns focus on daily or longer time scale. In order to compare properly our result with the existing literature, we present in
Table 2the results of the above Granger tests on a daily time scale.Table 2shows that, without the browsing activity,ScausesRfor 18% of the companies andRGranger-causesSin 9% of the cases. Thus there is now some predictability of sentiment, even if the number of companies is quite limited. This is consistent with the existing literature, which reports a weak daily predict-ability of returns by using sentiment. It is important to note that by adding the browsing Fig 4. Granger Causality tests at hourly scale between de-seasonalized time series (x axis as inFig 2).
The white cells correspond to tests for which we do not reject the null hypothesis of no Granger causality at 5% significance level. A black cell corresponds to a statistically significant Granger causality.
activity we can double the number of companies for which there is predictability. In fact,WS
Granger-causesRfor 37% of the companies and 11% in the opposite direction.
Discussion
The semantic analysis of the news on a specific company is known to have a small predictive power on the future price movements. At the light of our findings, we argue that this effect could be related to the distribution in the attention that the news receive, as clearly emerge in
Fig 1: its scale-free behaviour reflects the extreme heterogeneity in the information they convey and the surprise they generate in the readers.
Our in-sample analysis shows that by adding the clicking activity of the web users, we can greatly increase the predictive power of the news for the price returns. This occurs because the time series built with only the sentiment of the news gives the same weight to all the news. In this way even irrelevant news are considered, adding noise to the sentiment time series and reducing the predictive power of the signal. Adding the browsing activity means giving a mean-ingful weight to each news according to its importance, as measured by the attention it receives by the users, and it enhances the forecast ability of our approach.
The approach to collective evaluation that we proposed in this paper can be useful in many other non financial contexts, since the overflow of information is a common aspect in our lives. In the financial domain, a natural extension of the present work concerns market instabilities and crashes. The analysis presented here is in fact unconditional, i.e. it does not target large price movements or, more generally, abnormal returns. From our societal perspective it would be extremely valuable to have a collective evaluation system, like the one presented here, capa-ble of sifting the relevant information from the pool of data, news, blogs, etc, and to provide early warning indicators of large price movements. Since we have reported evidences in favour of return predictability at intraday time scale—especially at hourly scale—this approach could be also used for real-time indicators, as well as for high-frequency instabilities and systemic price cojumps [49,50], which are becoming increasingly more frequent in our highly auto-mated financial world.
Supporting Information
S1 Text. Supporting Information for“Coupling news sentiment with web browsing data predicts intra-day stock prices”.
(PDF)
Table 2. Number of companies for which we reject the null hypothesis of no Granger causality at 5% confidence level.
Causality relation Hourly scale Daily scale
S!R 4 18
R!S 13 9
R!WS 19 11
WS!R 53 37
V!C 100 97
C!V 65 52
C!σ 69 52
σ!C 96 16
Acknowledgments
The authors warmly thank Lucio Calcagnile for the valuable technical support during the final stage of this work. The opinions expressed here are solely those of the authors and do not rep-resent in any way those of their employers.
Author Contributions
Conceived and designed the experiments: GR IB GB GC FL MT. Performed the experiments: GR IB GB GC FL MT. Analyzed the data: GR IB GB GC FL MT. Contributed reagents/materi-als/analysis tools: GR IB GB GC FL MT. Wrote the paper: GR IB GB GC FL MT.
References
1. King G. Ensuring the data-rich future of the social sciences.Science 331, 719–721 (2011). doi:10. 1126/science.1197872PMID:21311013
2. Vespignani A. Predicting the behavior of techno-social systems.Science 325, 425–428 (2009). doi: 10.1126/science.1171990PMID:19628859
3. Bonanno G. et al. Networks of equities in financial markets.Eur. Phys. J. 38, 363–371 (2004). doi:10. 1140/epjb/e2004-00129-6
4. Caldarelli G.Scale-Free Networks: complex webs in nature and technology( Oxford University Press, Oxford, 2007).
5. Tumminello M., Aste T., Di Matteo T. & Mantegna R. N. A tool for filtering information in complex sys-tems.P.N.A.S. 102, 10421–10426 (2005). doi:10.1073/pnas.0500298102PMID:16027373
6. Achrekar, H., Gandhe, A., Lazarus, R., Yu, S.-H. & Liu, B. Predicting flu trends using twitter data. In Computer Communications Workshops (INFOCOM WKSHPS),2011 IEEE Conference on, 702–707 (IEEE, 2011).
7. Tizzoni M. et al. Real-time numerical forecast of global epidemic spreading: case study of 2009 A/ H1N1pdm.BMC medicine10, 165 (2012). doi:10.1186/1741-7015-10-165PMID:23237460
8. Caldarelli G. et al. A multi-level geographical study of Italian political elections from Twitter data.PloS one 9, e95809 (2014). doi:10.1371/journal.pone.0095809PMID:24802857
9. Malkiel B. G. & Fama E. F. Efficient capital markets: A review of theory and empirical work.J. Finance 25, 383–417 (1970). doi:10.2307/2325486
10. Thelwall M., Buckley K., Paltoglou G., Cai D. & Kappas A. Sentiment strength detection in short informal text.J. Am. Soc. Inf. Sci. Technol. 61, 2544–2558 (2010). doi:10.1002/asi.21416
11. Wang, C., Tsai, M., Liu, T., & Chang, C. Financial Sentiment Analysis for Risk Prediction. In Proceed-ings of the Sixth International Joint Conference on Natural Language Processing, 802–808, (2013).
12. Loughran T. & McDonald B. When is a liability not a liability? Textual analysis, dictionaries, and 10-Ks. J. Finance66, 35–65 (2011). doi:10.1111/j.1540-6261.2010.01625.x
13. Chan W. S. Stock price reaction to news and no-news: drift and reversal after headlines.J. Fin. Econ. 70, 223–260 (2003). doi:10.1016/S0304-405X(03)00146-6
14. Tetlock P. C. Giving content to investor sentiment: The role of media in the stock market.J. Finance62, 1139–1168 (2007). doi:10.1111/j.1540-6261.2007.01232.x
15. Mao, H., Counts, S. & Bollen, J. Predicting financial markets: Comparing survey, news, Twitter and search engine data.Preprint arXiv:1112.1051(2011).
16. Lillo F., MiccichèS., Tumminello M., Piilo J. & Mantegna R. N. How news affect the trading behavior of different categories of investors in a financial market.Quant. Finance15, 213–229 (2015). doi:10. 1080/14697688.2014.931593
17. Reis, J. C., Benvenuto, F., Vaz de Melo, P., Prates, O., Kwak, H., & An, J. Breaking the News: First Impressions Matter on Online News InICWSM’15: Proceedings of The International Conference on Weblogs and Social Media,2015, (2015).
18. Ruiz-Martinez, J.M., Valencia-Garcia, R., & Garcia-Sanchez, F. Semantic-Based Sentiment analysis in financial news. InProceedings of the First International Workshop on Finance and Economics on the Semantic Web (FEOSW 2012) in conjunction with 9th Extended Semantic Web Conference (ESWC 2012), (2012).
20. Bank M., Larch M. & Peter G. Google search volume and its influence on liquidity and returns of german stocks.Fin. Mar. Port. Man. 25, 239–264 (2011). doi:10.1007/s11408-011-0165-y
21. Bordino I.et al. Web search queries can predict stock market volumes.PloS One7, e40014 (2012). doi: 10.1371/journal.pone.0040014PMID:22829871
22. Preis T., Reith D. & Stanley H. E. Complex dynamics of our economic life on different scales: insights from search engine query data.Philos. T. R. Soc. A. 368, 5707–5719 (2010). doi:10.1098/rsta.2010. 0284
23. Kristoufek L. Can Google Trends search queries contribute to risk diversification?Sci.Rep. 3 (2013). doi:10.1038/srep02713
24. Vlastakis N. & Markellos R. N. Information demand and stock market volatility.J. Ban. Fin. 36, 1808– 1821 (2012). doi:10.1016/j.jbankfin.2012.02.007
25. Zhang W., Shen D., Zhang Y. & Xiong X. Open source information, investor attention, and asset pricing. Economic Modelling33, 613–619 (2013). doi:10.1016/j.econmod.2013.03.018
26. Curme C., Preis T., Stanley H. E. & Moat H. S. Quantifying the semantics of search behavior before stock market moves.P.N.A.S. 111, 11600–11605 (2014). doi:10.1073/pnas.1324054111PMID: 25071193
27. Cutler D. M., Poterba J. M. & Summers L. H. What moves stock prices?J. Port. Man. 15, 4–12 (1989). doi:10.3905/jpm.1989.409212
28. Vega C. Stock price reaction to public and private information.J. Fin. Econ. 82, 103–133 (2006). doi: 10.1016/j.jfineco.2005.07.011
29. Tetlock P. C., Saar-Tsechansky M. & Macskassy S. More than words: Quantifying language to mea-sure firms’fundamentals.J. Finance63, 1437–1467 (2008). doi:10.1111/j.1540-6261.2008.01362.x
30. Schumaker R. P. & Chen H. Textual analysis of stock market prediction using breaking financial news: The AZFin text system.ACM (TOIS)27, 12 (2009).
31. Engelberg J. E., Reed A. V. & Ringgenberg M. C. How are shorts informed? Short sellers, news, and information processing.J. Fin. Econ. 105, 260–278 (2012). doi:10.1016/j.jfineco.2012.03.001
32. Alanyali M., Moat H. S. & Preis T. Quantifying the relationship between financial news and the stock market.Sci. Rep. 3 (2013). doi:10.1038/srep03578PMID:24356666
33. Zhang Y. et al. Internet information arrival and volatility of sme price index.Physica A 399, 70–74 (2014). doi:10.1016/j.physa.2013.12.034
34. Birz G. & Lott J. R Jr. The effect of macroeconomic news on stock returns: New evidence from newspa-per coverage.J. Ban. Fin. 35, 2791–2800 (2011). doi:10.1016/j.jbankfin.2011.03.006
35. Gross-Klussmann A. & Hautsch N. When machines read the news: Using automated text analytics to quantify high frequency news-implied market reactions.J. Emp. Fin. 18, 321–340 (2011). doi:10.1016/ j.jempfin.2010.11.009
36. Da Z., Engelberg J. & Gao P. In search of attention.J. Finance66, 1461–1499 (2011). doi:10.1111/j. 1540-6261.2011.01679.x
37. De Choudhury, M., Sundaram, H., John, A. & Seligmann, D. D. Can blog communication dynamics be correlated with stock market activity? InProceedings of the nineteenth ACM conference on Hypertext and hypermedia, 55–60 (ACM, 2008).
38. Mao, Y., Wei, W., Wang, B. & Liu, B. Correlating S&P 500 stocks with Twitter data. InProceedings of the First ACM International Workshop on Hot Topics on Interdisciplinary Social Networks Research, 69–72 (ACM, 2012).
39. Ruiz, E. J., Hristidis, V., Castillo, C., Gionis, A. & Jaimes, A. Correlating financial time series with micro-blogging activity. InProceedings of the fifth ACM international conference on Web search and data mining, 513–522 (ACM, 2012).
40. Bollen J., Mao H. & Zeng X. Twitter mood predicts the stock market.J. Comp. Sci. 2, 1–8 (2011). doi: 10.1016/j.jocs.2010.12.007
41. Bollen, J., Pepe, A. & Mao, H. Modeling public mood and emotion: Twitter sentiment and socio-eco-nomic phenomena. InProceedings of the Fifth International AAAI Conference on Weblogs and Social Media, 450–453 (2011).
42. Zhang X., Fuehres H. & Gloor P. A. Predicting stock market indicators through Twitter“I hope it is not as bad as I fear”.Proc. Soc. Beh. Sci. 26, 55–62 (2011). doi:10.1016/j.sbspro.2011.10.562
43. Zheludev I., Smith R. & Aste T. When can social media lead financial markets?.Sci. Rep. 4 (2014). doi: 10.1038/srep04213
45. Preis T., Moat H. S. & Stanley H. E. Quantifying trading behavior in financial markets using Google Trends.Sci. Rep. 3 (2013). doi:10.1038/srep01684
46. Moat H. S. et al. Quantifying wikipedia usage patterns before stock market moves.Sci. Rep. 3 (2013). doi:10.1038/srep01801
47. Granger C. Investigating causal relations by econometric models and cross-spectral methods. Econo-metrica 37, 424–438 (1969). doi:10.2307/1912791
48. Zipf G.Human Behavior and the Principle of Least Effort( Addison-Wesley, Cambridge, MA, 1949).
49. Bormetti G. et al. Modelling systemic price cojumps with Hawkes factor models.Quant. Finance 15, 1137–1156 (2015). doi:10.1080/14697688.2014.996586