A Single-Cell Gene-Expression Profile Reveals
Inter-Cellular Heterogeneity within Human
Monocyte Subsets
Susanne T. Gren1,2, Thomas B. Rasmussen3, Sabina Janciauskiene4, Katarina Håkansson1, Jens G. Gerwien5, Olof Grip2
*
1Cellular Pharmacology, Novo Nordisk A/S, Måløv, Denmark,2Department of Clinical Sciences Malmö, Lund University, Malmö, Sweden,3Clinical Immunology, Copenhagen University Hospital, Copenhagen, Denmark,4Department of Respiratory Medicine, Hannover Medical School, Hannover, Germany,5Global Biobanking Management, Novo Nordisk A/S, Måløv, Denmark
Abstract
Human monocytes are a heterogeneous cell population classified into three different sub-sets: Classical CD14++CD16-, intermediate CD14++CD16+, and non-classical
CD14+CD16++monocytes. These subsets are distinguished by their differential expression of CD14 and CD16, and unique gene expression profile. So far, the variation in inter-cellular gene expression within the monocyte subsets is largely unknown. In this study, the cellular variation within each human monocyte subset from a single healthy donor was described by using a novel single-cell PCR gene-expression analysis tool. We investigated 86 different genes mainly encoding cell surface markers, and proteins involved in immune regulation. Within the three human monocyte subsets, our descriptive findings show multimodal expression of key immune response genes, such asCD40,NFⱪB1,RELA,TLR4,TLR8and TLR9. Furthermore, we discovered one subgroup of cells within the classical monocytes,
which showed alterations of 22 genes e.g.IRF8,CD40,CSF1R,NFⱪB1,RELA and TNF.
Additionally one subgroup within the intermediate and non-classical monocytes also dis-played distinct gene signatures by altered expression of 8 and 6 genes, respectively. Hence the three monocyte subsets can be further subdivided according to activation status and dif-ferentiation, independently of the traditional classification based on cell surface markers. Demonstrating the use and the ability to discover cell heterogeneity within defined popula-tions of human monocytes is of great importance, and can be useful in unravelling inter-cel-lular variation in leukocyte populations, identifying subpopulations involved in disease pathogenesis and help tailor new therapies.
Introduction
Blood monocytes are a heterogeneous population of innate immune leukocytes. They are involved in the innate immune response to pathogens by phagocytosis, the release of reactive oxygen species, cytokines and chemokines and by antigen presentation, thereby modulating and activating cells within the adaptive immune system [1]. The diversity within the human
OPEN ACCESS
Citation:Gren ST, Rasmussen TB, Janciauskiene S, Håkansson K, Gerwien JG, Grip O (2015) A Single-Cell Gene-Expression Profile Reveals Inter-Single-Cellular Heterogeneity within Human Monocyte Subsets. PLoS ONE 10(12): e0144351. doi:10.1371/journal. pone.0144351
Editor:Xu G. Yu, Massachusetts General Hospital, UNITED STATES
Received:August 31, 2015
Accepted:November 17, 2015
Published:December 9, 2015
Copyright:© 2015 Gren et al. This is an open access article distributed under the terms of the
Creative Commons Attribution License, which permits unrestricted use, distribution, and reproduction in any medium, provided the original author and source are credited.
Data Availability Statement:All relevant data are within the paper and its Supporting Information files.
blood monocyte subpopulations has become evident in recent years. Based on the differential expression of the co-receptor to lipopolysaccharide (LPS) CD14 and the Fcγreceptor (Fcγ R)-III CD16, human monocytes can be divided into different subpopulations [2]. First, two sub-populations were recognized, namely the CD14+CD16-and the CD14-CD16+monocytes [3], that were shown to have distinct biological functions [4] and a proportional increase of the CD14-CD16+monocyte subset were seen in a variety of chronic and inflammatory diseases [5–8]. Thus, later it became evident that the CD16+monocytes could be further divided into two subsets according to the level of CD14 expression. Three monocyte subpopulations have now been identified and characterized in humans [9], whereas two subsets are identified accord-ing to the expression of GR1 and Ly6C in mice [2]. The human monocytes have been given the following notation: Classical (CD14++CD16-), Intermediate (CD14++CD16+) and Non-classical (CD14+CD16++) monocytes [10]. Classical and intermediate monocytes are shown to be homo-logs to the mouse Gr+Ly6C+, whereas the non-classical monocytes resemble the mouse Gr-Ly6C -monocytes [9]. The heterogeneity within monocytes has been unravelled by the expression of cell surface markers and by using gene expression profiling. Human classical monocytes express a diversity of genes that favours their involvement in migration, bacterial sensing, phagocytosis, immune responses and many pro-inflammatory genes, which support their role in inflammation. In contrast, intermediate monocytes display genes that account for a profile that is more prone to antigen-presenting [11] whereas genes up-regulated in non-classical monocytes are mainly involved in patrolling, sensing of nucleic acids and viruses [9].
Several studies have implied that LPS-stimulated intermediate and non-classical monocytes are the most pro-inflammatory among the three subsets [9,11]. We have previously shown that the classical monocytes are the most pro-inflammatory in regard to cytokine secretion and MMP release when stimulated with LPS and immune complexes [12]. This is in agreement with the high expression of CD14 and the FcγRI CD64 [11,12]. In relation to disease pathogen-esis, the subdivision of CD16+monocytes showed that in chronic and autoimmune diseases, for example Crohn’s disease (CD), the intermediate monocytes were expanded in the periph-eral blood in patients with active inflammation [7,12–14], whereas the classical subset was decreased [12]. However, the role of the classical, intermediate and non-classical human mono-cytes in health and disease has not been fully elucidated.
Previous gene-expression profiling has distinguished the three monocyte subsets and addressed mechanisms of transcriptional regulation and differential functional genes [11,15,16]. However, an increasing body of evidence indicates that cell subpopulations can be comprised of cells with distinct gene expression profiles, though this is masked when using techniques such as micro-array analysis. To the best of our knowledge, no studies have performed single-cell gene expression analysis of the three monocyte subsets, a technique that can elucidate the inter-cellular heterogeneity. Here, we investigated the three monocyte subsets using the single-cell gene analy-sis technique from Fluidigm. We investigated 86 selected genes, involved mainly in adhesion, migration, phagocytosis, tissue remodelling and immune functionality, in order to obtain a greater knowledge of the heterogeneity within each monocyte subset. Our results showed a hith-erto unknown inter-cellular variation within the three human monocyte subsets, which other techniques such as micro-array analysis and flow cytometry are unable to identify.
Results
Gene expression profile
Live, single cells within the three human monocyte subsets were single-cell-sorted according to forward and side scatter, and the expression of the cellular surface markers CD14 and CD16 (Fig
these authors are articulated in the 'author contributions' section.
classical monocytes were converted to cDNA and amplified with 85 target genes (Table 1). The 85 genes analysed were chosen based on differential expression shown in earlier micro-array results [11,15], and by their relation to cell function, as well as biological or immune regulated processes. The genes were plotted into a PCA score plot showing that the single-sorted cells were clustered according to their subset, classical, intermediate or non-classical, verifying that the cells were sorted correctly (Fig 1B). The expression of each gene was analysed using the SINGuLAR R package. No signal in the Fluidigm qPCR were interpreted as expression below detection limit and referred to as non-expression. We found a differential expression of 80 genes within the 3 subgroups of monocytes (Fig 1CandTable 2). Five of the genes, CCR7, MMP12, MRC1, ULBP1 and ULBP2 were not expressed by any of the subsets. Four genes, CCR2, CD163, CLEC4E, and SERPINB2 were exclusively not expressed by the non-classical subset. Expression of IL6 was not detectable in the classical subset and very low expression was observed in the intermediate and non-classical subset. MMP9 was weakly expressed by the classical and non-classical monocytes and no expression was found in the intermediate subset. TLR3 was not expressed by the classical and intermediate, but weakly by the non-classical monocytes, whereas TREM2 was weakly expressed by the classical subset but not by the intermediate and non-classical subsets. Expres-sion of CCR5 and RAET1G was found only in the intermediate monocytes. These data show that there is great diversity within the three monocyte subsets and that the subsets have a differential gene expression profile with regard to the genes investigated in this study.
Comparison of gene expression investigated by single-cell PCR gene
expression analysis versus micro-array
Previous microarray data have shown that genes within diverse cellular and immunologic pro-cess are differentially expressed within the three subsets. We therefore wanted to validate our gene expression data generated by Fluidigm (Table 2) with existing array data. We compared our single cell gene-expression data to current expression profiles published by Wong et al. by looking at the general expression pattern since data have not been derived using the same methods. In agreement with the study conducted by Wong et al., the classical monocytes showed the highest expression of CCR1, CCR2, CD14, CD163, CD36, SELL, and SERPINB2 whereas the intermediate showed highest expression of CD40, CD74, HLA-DRA, MARCO and TIMP, and the non-classical showed the highest expression of C1QA, ITGAL, and SIGLEC10. However, our data deviated from Wong et al., by showing the highest expression of CTSL and HMOX1 by the intermediate monocytes and CX3CR1 by the classical monocytes, which were found by Wong et al. to be most highly expressed by the non-classical subset.
Functional characteristics of the three subsets
To investigate unique characteristics of each monocyte subset, the genes examined were Fig 1. Single-cell gene expression analysis on human monocytes.Human monocytes were single-cell sorted according to the expression of the cell surface markers CD14 and CD16 and gene expression on single cells was assessed. A) Representative plot of flow cytometry analysis demonstrating the monocyte subset gating strategy, used to single-cell sort monocytes from the three classified monocyte subsets (n =1). Classical (CD14++CD16-)
monocytes, intermediate (CD14++CD16+) monocytes and non-classical (CD14++CD16+) monocytes are depicted in the upper left quadrant, upper right
quadrant and lower right quadrant, respectively. B) Principal component analyses (PCA) of single-cell PCR gene expression analysis data showing genetic clustering of the three monocyte subsets. The PCA plot confirmed the classification of the three human monocyte subsets done by flow cytometry, visualized by gene families. Each dot represents a single cell. C) Heatmap of gene expression values for PCA showing hierarchical clustering of single-cell PCR gene expression data from the three human monocyte sub-populations. The analysis revealed cellular heterogeneity by distinct gene signatures. Red
circles = classical monocytes (n= 94 cells), green triangles = intermediate monocytes (n= 92 cells), and blue pluses = non-classical monocytes (n= 80 cells).
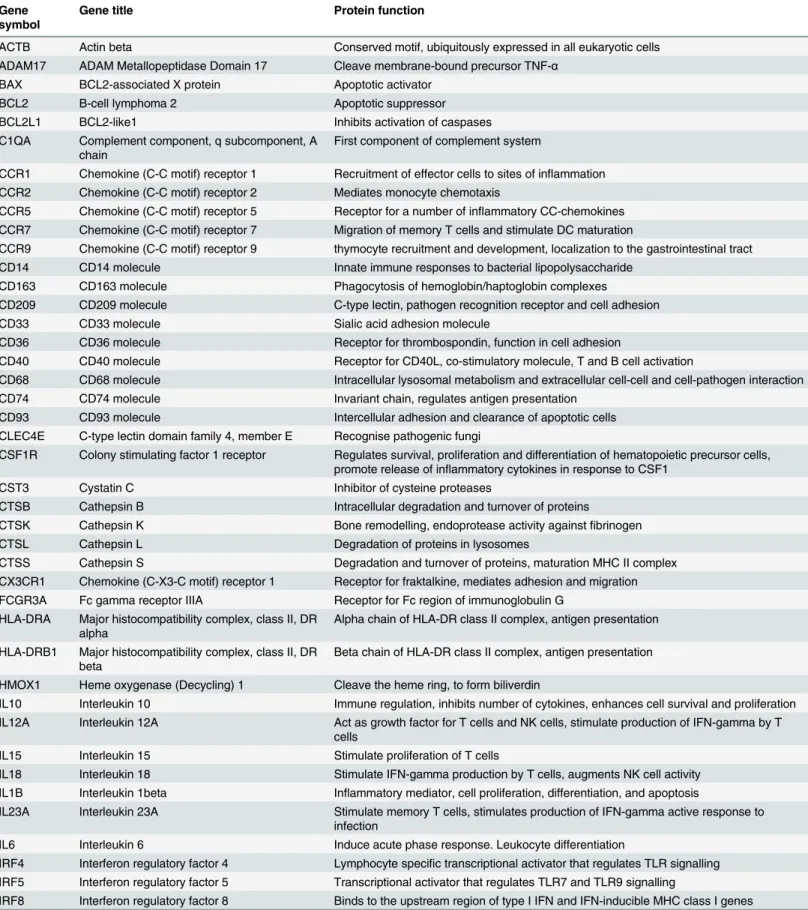
Table 1. Genes of interest investigated in the three monocyte subsets.
Gene symbol
Gene title Protein function
ACTB Actin beta Conserved motif, ubiquitously expressed in all eukaryotic cells ADAM17 ADAM Metallopeptidase Domain 17 Cleave membrane-bound precursor TNF-α
BAX BCL2-associated X protein Apoptotic activator
BCL2 B-cell lymphoma 2 Apoptotic suppressor
BCL2L1 BCL2-like1 Inhibits activation of caspases
C1QA Complement component, q subcomponent, A chain
First component of complement system
CCR1 Chemokine (C-C motif) receptor 1 Recruitment of effector cells to sites of inflammation CCR2 Chemokine (C-C motif) receptor 2 Mediates monocyte chemotaxis
CCR5 Chemokine (C-C motif) receptor 5 Receptor for a number of inflammatory CC-chemokines CCR7 Chemokine (C-C motif) receptor 7 Migration of memory T cells and stimulate DC maturation
CCR9 Chemokine (C-C motif) receptor 9 thymocyte recruitment and development, localization to the gastrointestinal tract CD14 CD14 molecule Innate immune responses to bacterial lipopolysaccharide
CD163 CD163 molecule Phagocytosis of hemoglobin/haptoglobin complexes
CD209 CD209 molecule C-type lectin, pathogen recognition receptor and cell adhesion
CD33 CD33 molecule Sialic acid adhesion molecule
CD36 CD36 molecule Receptor for thrombospondin, function in cell adhesion
CD40 CD40 molecule Receptor for CD40L, co-stimulatory molecule, T and B cell activation
CD68 CD68 molecule Intracellular lysosomal metabolism and extracellular cell-cell and cell-pathogen interaction CD74 CD74 molecule Invariant chain, regulates antigen presentation
CD93 CD93 molecule Intercellular adhesion and clearance of apoptotic cells CLEC4E C-type lectin domain family 4, member E Recognise pathogenic fungi
CSF1R Colony stimulating factor 1 receptor Regulates survival, proliferation and differentiation of hematopoietic precursor cells, promote release of inflammatory cytokines in response to CSF1
CST3 Cystatin C Inhibitor of cysteine proteases
CTSB Cathepsin B Intracellular degradation and turnover of proteins
CTSK Cathepsin K Bone remodelling, endoprotease activity againstfibrinogen
CTSL Cathepsin L Degradation of proteins in lysosomes
CTSS Cathepsin S Degradation and turnover of proteins, maturation MHC II complex CX3CR1 Chemokine (C-X3-C motif) receptor 1 Receptor for fraktalkine, mediates adhesion and migration FCGR3A Fc gamma receptor IIIA Receptor for Fc region of immunoglobulin G
HLA-DRA Major histocompatibility complex, class II, DR alpha
Alpha chain of HLA-DR class II complex, antigen presentation
HLA-DRB1 Major histocompatibility complex, class II, DR beta
Beta chain of HLA-DR class II complex, antigen presentation
HMOX1 Heme oxygenase (Decycling) 1 Cleave the heme ring, to form biliverdin
IL10 Interleukin 10 Immune regulation, inhibits number of cytokines, enhances cell survival and proliferation IL12A Interleukin 12A Act as growth factor for T cells and NK cells, stimulate production of IFN-gamma by T
cells
IL15 Interleukin 15 Stimulate proliferation of T cells
IL18 Interleukin 18 Stimulate IFN-gamma production by T cells, augments NK cell activity IL1B Interleukin 1beta Inflammatory mediator, cell proliferation, differentiation, and apoptosis
IL23A Interleukin 23A Stimulate memory T cells, stimulates production of IFN-gamma active response to infection
IL6 Interleukin 6 Induce acute phase response. Leukocyte differentiation
IRF4 Interferon regulatory factor 4 Lymphocyte specific transcriptional activator that regulates TLR signalling IRF5 Interferon regulatory factor 5 Transcriptional activator that regulates TLR7 and TLR9 signalling
IRF8 Interferon regulatory factor 8 Binds to the upstream region of type I IFN and IFN-inducible MHC class I genes
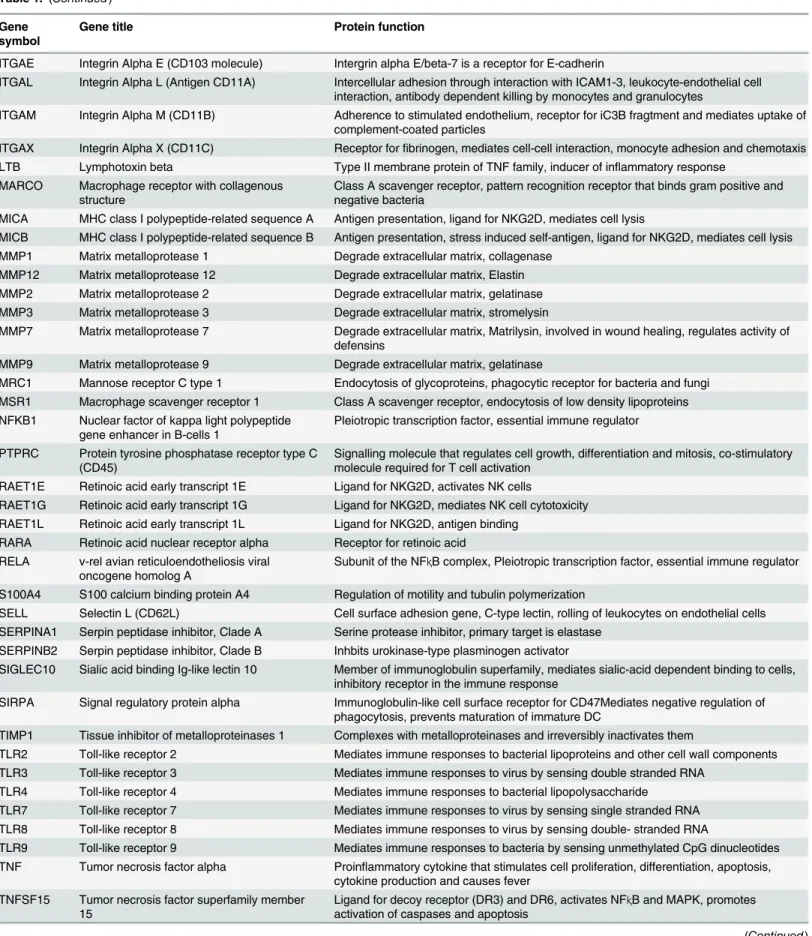
Table 1. (Continued)
Gene symbol
Gene title Protein function
ITGAE Integrin Alpha E (CD103 molecule) Intergrin alpha E/beta-7 is a receptor for E-cadherin
ITGAL Integrin Alpha L (Antigen CD11A) Intercellular adhesion through interaction with ICAM1-3, leukocyte-endothelial cell interaction, antibody dependent killing by monocytes and granulocytes
ITGAM Integrin Alpha M (CD11B) Adherence to stimulated endothelium, receptor for iC3B fragtment and mediates uptake of complement-coated particles
ITGAX Integrin Alpha X (CD11C) Receptor forfibrinogen, mediates cell-cell interaction, monocyte adhesion and chemotaxis LTB Lymphotoxin beta Type II membrane protein of TNF family, inducer of inflammatory response
MARCO Macrophage receptor with collagenous structure
Class A scavenger receptor, pattern recognition receptor that binds gram positive and negative bacteria
MICA MHC class I polypeptide-related sequence A Antigen presentation, ligand for NKG2D, mediates cell lysis
MICB MHC class I polypeptide-related sequence B Antigen presentation, stress induced self-antigen, ligand for NKG2D, mediates cell lysis MMP1 Matrix metalloprotease 1 Degrade extracellular matrix, collagenase
MMP12 Matrix metalloprotease 12 Degrade extracellular matrix, Elastin MMP2 Matrix metalloprotease 2 Degrade extracellular matrix, gelatinase MMP3 Matrix metalloprotease 3 Degrade extracellular matrix, stromelysin
MMP7 Matrix metalloprotease 7 Degrade extracellular matrix, Matrilysin, involved in wound healing, regulates activity of defensins
MMP9 Matrix metalloprotease 9 Degrade extracellular matrix, gelatinase
MRC1 Mannose receptor C type 1 Endocytosis of glycoproteins, phagocytic receptor for bacteria and fungi MSR1 Macrophage scavenger receptor 1 Class A scavenger receptor, endocytosis of low density lipoproteins NFKB1 Nuclear factor of kappa light polypeptide
gene enhancer in B-cells 1
Pleiotropic transcription factor, essential immune regulator
PTPRC Protein tyrosine phosphatase receptor type C (CD45)
Signalling molecule that regulates cell growth, differentiation and mitosis, co-stimulatory molecule required for T cell activation
RAET1E Retinoic acid early transcript 1E Ligand for NKG2D, activates NK cells
RAET1G Retinoic acid early transcript 1G Ligand for NKG2D, mediates NK cell cytotoxicity RAET1L Retinoic acid early transcript 1L Ligand for NKG2D, antigen binding
RARA Retinoic acid nuclear receptor alpha Receptor for retinoic acid RELA v-rel avian reticuloendotheliosis viral
oncogene homolog A
Subunit of the NFⱪB complex, Pleiotropic transcription factor, essential immune regulator
S100A4 S100 calcium binding protein A4 Regulation of motility and tubulin polymerization
SELL Selectin L (CD62L) Cell surface adhesion gene, C-type lectin, rolling of leukocytes on endothelial cells SERPINA1 Serpin peptidase inhibitor, Clade A Serine protease inhibitor, primary target is elastase
SERPINB2 Serpin peptidase inhibitor, Clade B Inhbits urokinase-type plasminogen activator
SIGLEC10 Sialic acid binding Ig-like lectin 10 Member of immunoglobulin superfamily, mediates sialic-acid dependent binding to cells, inhibitory receptor in the immune response
SIRPA Signal regulatory protein alpha Immunoglobulin-like cell surface receptor for CD47Mediates negative regulation of phagocytosis, prevents maturation of immature DC
TIMP1 Tissue inhibitor of metalloproteinases 1 Complexes with metalloproteinases and irreversibly inactivates them
TLR2 Toll-like receptor 2 Mediates immune responses to bacterial lipoproteins and other cell wall components TLR3 Toll-like receptor 3 Mediates immune responses to virus by sensing double stranded RNA
TLR4 Toll-like receptor 4 Mediates immune responses to bacterial lipopolysaccharide
TLR7 Toll-like receptor 7 Mediates immune responses to virus by sensing single stranded RNA TLR8 Toll-like receptor 8 Mediates immune responses to virus by sensing double- stranded RNA
TLR9 Toll-like receptor 9 Mediates immune responses to bacteria by sensing unmethylated CpG dinucleotides TNF Tumor necrosis factor alpha Proinflammatory cytokine that stimulates cell proliferation, differentiation, apoptosis,
cytokine production and causes fever TNFSF15 Tumor necrosis factor superfamily member
15
to have the highest expression of CD93, CD209, CLEC4E, which are genes involved in pathogen recognition and phagocytosis. Also genes encoding proteins involved in migration and adhesion such as the chemokine receptors, CCR1, CCR2, CCR9, CX3CR1, ITGAM and SELL were most highly expressed by the classical monocytes. The expression of genes encoding scavenger recep-tors was mostly expressed by the classical and intermediate monocytes. As shown earlier, the intermediate cells had the highest expression of genes involved in co-stimulation and antigen presentation, but also genes involved in NK cell and CD8 T cell activation, such as MICB, RAET1E, RAET1G, RAET1L and ULBP3 were enriched on intermediate monocytes. Further-more, we also found that the intermediate monocytes had the highest expression of genes involved in cell differentiation and cell function, e.g. the genes encoding the transcription factors IRF5 and IRF8, the NFⱪB1 and RELA genes involved in heterodimer formation of the central immunologic regulatory transcription factor NFⱪB, and CSF1R where the encoded protein con-trols cell differentiation. Also, genes encoding the cytokines IL1β, IL12A, IL18 and IL23A, prote-ases, such as cathepsins and MMPs, and protease inhibitors, CST3, TIMP1 and SERPINA1 were highly expressed by the intermediate monocytes. In contrast, the non-classical monocytes showed the highest expression of TNF and the metalloprotease ADAM17 gene, which are involved in the processing of TNF from the cell surface. Low expression of genes involved in bac-terial phagocytosis were found in the non-classical monocyte subsets, thus they had the highest expression of C1QA, a complement component, and the FcγR3A involved in antibody-mediated phagocytosis. Genes encoding the TLR8 and 9 proteins, which are classical, innate pattern recog-nition receptors (PRR) were also highly expressed by the non-classical monocytes.
Detection of inter-cellular variation
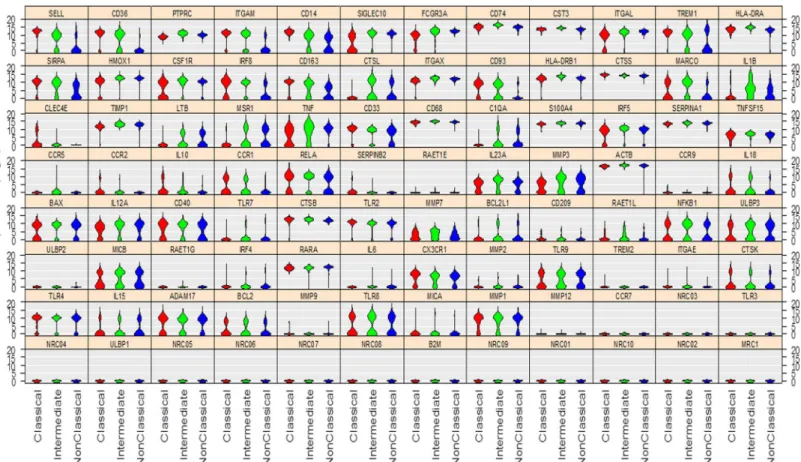
In contrast to previous gene expression profiling studies [9,11,15], the aim of the current study was to investigate the biological genetic variability within the monocyte subsets by using the Fluidigm single-cell gene expression tool. The probes used for the PCR amplification have been tested with DNA, and were able to amplify and detect transcripts. This technique is there-fore able to assess selected genes within the individual cells, and investigate possible multi-modal gene expression within cell populations. Using a Hartigans dip test, we identified genes within the three subsets that had multimodal expression (Table 4, andFig 2). Within the classi-cal, intermediate and non-classical subsets, 37, 39 and 36 genes, respectively showed multi-modal expression (Table 4). Some of the genes showed a general multimodal expression in all three subsets such as the co-stimulatory molecule CD40, the scavenger receptor MARCO, the adhesion molecules CD33, CD93 and CX3CR1, the apoptosis genes BAX and BCL2, the genes encoding the cytokines IL12A, IL15 and IL23A, TLR8 and TLR9 and the proteases, CTSK, Table 1. (Continued)
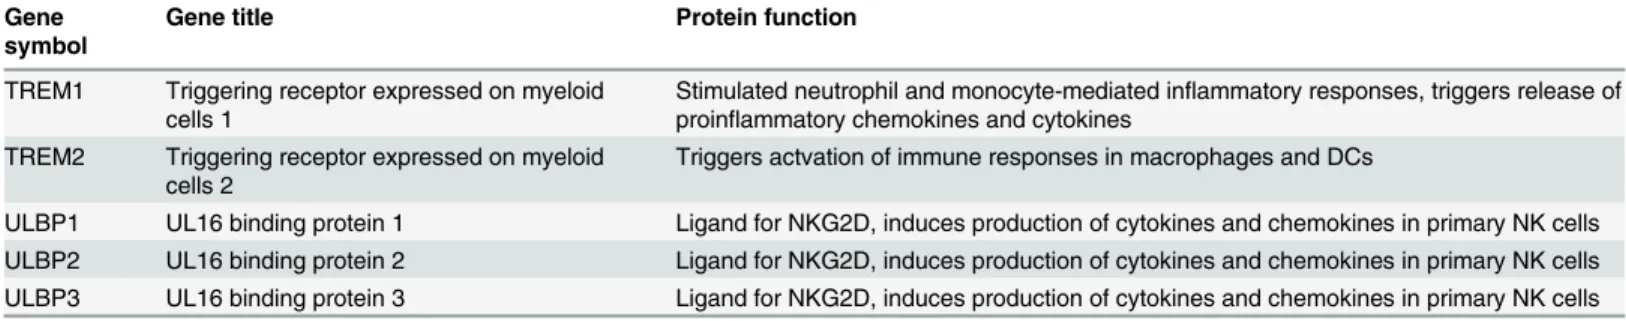
Gene symbol
Gene title Protein function
TREM1 Triggering receptor expressed on myeloid cells 1
Stimulated neutrophil and monocyte-mediated inflammatory responses, triggers release of proinflammatory chemokines and cytokines
TREM2 Triggering receptor expressed on myeloid cells 2
Triggers actvation of immune responses in macrophages and DCs
ULBP1 UL16 binding protein 1 Ligand for NKG2D, induces production of cytokines and chemokines in primary NK cells ULBP2 UL16 binding protein 2 Ligand for NKG2D, induces production of cytokines and chemokines in primary NK cells ULBP3 UL16 binding protein 3 Ligand for NKG2D, induces production of cytokines and chemokines in primary NK cells
Protein function adapted fromGeneCards.org
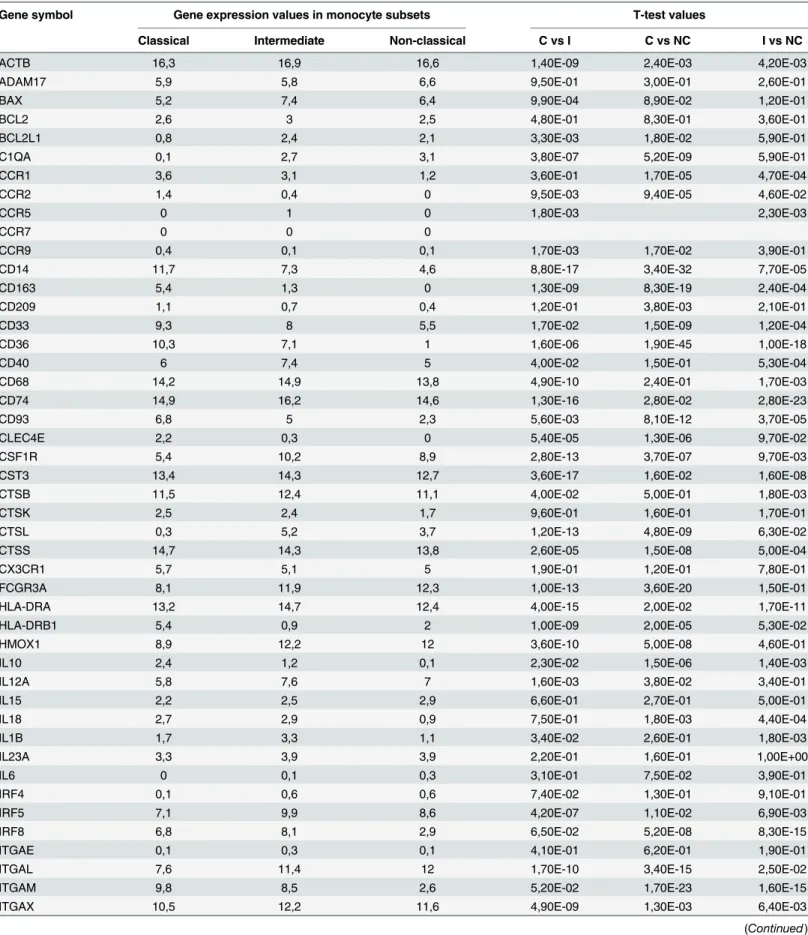
Table 2. Relative Log2 transformed gene expression levels of the three subsets and statistical significance the subsets in between.
Gene symbol Gene expression values in monocyte subsets T-test values
Classical Intermediate Non-classical C vs I C vs NC I vs NC
ACTB 16,3 16,9 16,6 1,40E-09 2,40E-03 4,20E-03
ADAM17 5,9 5,8 6,6 9,50E-01 3,00E-01 2,60E-01
BAX 5,2 7,4 6,4 9,90E-04 8,90E-02 1,20E-01
BCL2 2,6 3 2,5 4,80E-01 8,30E-01 3,60E-01
BCL2L1 0,8 2,4 2,1 3,30E-03 1,80E-02 5,90E-01
C1QA 0,1 2,7 3,1 3,80E-07 5,20E-09 5,90E-01
CCR1 3,6 3,1 1,2 3,60E-01 1,70E-05 4,70E-04
CCR2 1,4 0,4 0 9,50E-03 9,40E-05 4,60E-02
CCR5 0 1 0 1,80E-03 2,30E-03
CCR7 0 0 0
CCR9 0,4 0,1 0,1 1,70E-03 1,70E-02 3,90E-01
CD14 11,7 7,3 4,6 8,80E-17 3,40E-32 7,70E-05
CD163 5,4 1,3 0 1,30E-09 8,30E-19 2,40E-04
CD209 1,1 0,7 0,4 1,20E-01 3,80E-03 2,10E-01
CD33 9,3 8 5,5 1,70E-02 1,50E-09 1,20E-04
CD36 10,3 7,1 1 1,60E-06 1,90E-45 1,00E-18
CD40 6 7,4 5 4,00E-02 1,50E-01 5,30E-04
CD68 14,2 14,9 13,8 4,90E-10 2,40E-01 1,70E-03
CD74 14,9 16,2 14,6 1,30E-16 2,80E-02 2,80E-23
CD93 6,8 5 2,3 5,60E-03 8,10E-12 3,70E-05
CLEC4E 2,2 0,3 0 5,40E-05 1,30E-06 9,70E-02
CSF1R 5,4 10,2 8,9 2,80E-13 3,70E-07 9,70E-03
CST3 13,4 14,3 12,7 3,60E-17 1,60E-02 1,60E-08
CTSB 11,5 12,4 11,1 4,00E-02 5,00E-01 1,80E-03
CTSK 2,5 2,4 1,7 9,60E-01 1,60E-01 1,70E-01
CTSL 0,3 5,2 3,7 1,20E-13 4,80E-09 6,30E-02
CTSS 14,7 14,3 13,8 2,60E-05 1,50E-08 5,00E-04
CX3CR1 5,7 5,1 5 1,90E-01 1,20E-01 7,80E-01
FCGR3A 8,1 11,9 12,3 1,00E-13 3,60E-20 1,50E-01
HLA-DRA 13,2 14,7 12,4 4,00E-15 2,00E-02 1,70E-11
HLA-DRB1 5,4 0,9 2 1,00E-09 2,00E-05 5,30E-02
HMOX1 8,9 12,2 12 3,60E-10 5,00E-08 4,60E-01
IL10 2,4 1,2 0,1 2,30E-02 1,50E-06 1,40E-03
IL12A 5,8 7,6 7 1,60E-03 3,80E-02 3,40E-01
IL15 2,2 2,5 2,9 6,60E-01 2,70E-01 5,00E-01
IL18 2,7 2,9 0,9 7,50E-01 1,80E-03 4,40E-04
IL1B 1,7 3,3 1,1 3,40E-02 2,60E-01 1,80E-03
IL23A 3,3 3,9 3,9 2,20E-01 1,60E-01 1,00E+00
IL6 0 0,1 0,3 3,10E-01 7,50E-02 3,90E-01
IRF4 0,1 0,6 0,6 7,40E-02 1,30E-01 9,10E-01
IRF5 7,1 9,9 8,6 4,20E-07 1,10E-02 6,90E-03
IRF8 6,8 8,1 2,9 6,50E-02 5,20E-08 8,30E-15
ITGAE 0,1 0,3 0,1 4,10E-01 6,20E-01 1,90E-01
ITGAL 7,6 11,4 12 1,70E-10 3,40E-15 2,50E-02
ITGAM 9,8 8,5 2,6 5,20E-02 1,70E-23 1,60E-15
MMP1 and MMP3. Apart from the genes with multimodal expression in all three subsets, the classical subset showed multimodal expression of the phagocytosis-associated gene CLEC4E, the scavenger receptor gene CD163 and the FcγR3A gene, adhesion and migration genes Table 2. (Continued)
Gene symbol Gene expression values in monocyte subsets T-test values
Classical Intermediate Non-classical C vs I C vs NC I vs NC
LTB 0,5 2,8 3,4 9,80E-07 7,60E-09 3,50E-01
MARCO 4,3 6,7 2,2 1,30E-03 2,30E-03 2,40E-10
MICA 0,8 0,5 0,8 5,70E-01 9,60E-01 5,20E-01
MICB 3,1 4,7 3,7 1,80E-02 3,40E-01 1,70E-01
MMP1 7,3 7,3 7,5 9,90E-01 7,60E-01 7,80E-01
MMP12 0 0 0 9,20E-01 7,40E-01 8,10E-01
MMP2 0,3 0,7 0,5 8,90E-02 3,20E-01 4,50E-01
MMP3 3,8 6,1 5,7 7,30E-05 7,50E-04 6,10E-01
MMP7 2,5 3,4 2,5 1,40E-02 8,70E-01 9,20E-03
MMP9 0,1 0 0,1 3,20E-01 9,50E-01 3,10E-01
MRC1 0 0 0
MSR1 0,8 3,7 4,4 2,90E-06 1,00E-08 3,60E-01
NFKB1 4,2 5,8 4,1 4,10E-02 9,10E-01 2,90E-02
PTPRC 8,8 11 10 5,40E-34 2,10E-15 1,10E-10
RAET1E 0,1 0,4 0,4 5,20E-05 4,90E-04 4,00E-01
RAET1G 0 0,1 0 1,60E-01 1,60E-01
RAET1L 1,1 2,1 1,5 9,50E-03 3,20E-01 1,40E-01
RARA 11,8 11,8 11,6 8,50E-01 6,20E-01 5,70E-01
RELA 6,4 8,2 5,2 1,70E-02 1,10E-01 4,50E-05
S100A4 13,1 13,8 13,3 1,00E-08 2,70E-01 2,50E-02
SELL 11,9 7,3 2,4 7,90E-15 7,60E-43 4,30E-12
SERPINA1 13,2 13,9 13,1 4,90E-09 7,50E-01 1,40E-02
SERPINB2 0,9 0,1 0 5,00E-03 1,40E-03 3,20E-01
SIGLEC10 4,6 10 10,1 1,50E-15 1,00E-16 9,50E-01
SIRPA 9,4 7,4 4,1 3,20E-04 5,50E-19 1,10E-07
TIMP1 11,7 13 12,2 2,70E-10 1,50E-01 1,20E-02
TLR2 10 9 8,8 1,90E-02 1,40E-02 7,70E-01
TLR3 0 0 0,1 3,10E-01 3,10E-01
TLR4 8,4 8 7,6 4,20E-01 1,50E-01 5,00E-01
TLR7 0,2 1,5 0,5 1,70E-03 3,20E-01 3,10E-02
TLR8 4,7 5,3 5 4,40E-01 6,90E-01 7,10E-01
TLR9 3,8 4,2 4,6 4,30E-01 2,00E-01 6,00E-01
TNF 5,8 8,4 9,8 6,30E-04 8,00E-10 2,90E-02
TNFSF15 5,8 7 6,4 2,40E-05 1,90E-02 4,50E-03
TREM1 11,2 7,8 4,4 1,60E-08 2,40E-18 9,50E-05
TREM2 0,1 0 0 3,20E-01 3,30E-01
ULBP1 0 0 0
ULBP2 0 0 0 3,10E-01 3,10E-01
ULBP3 3,8 5,2 5 3,00E-02 8,20E-02 7,00E-01
C = Classical, I = Intermediate, NC = Non-Classical
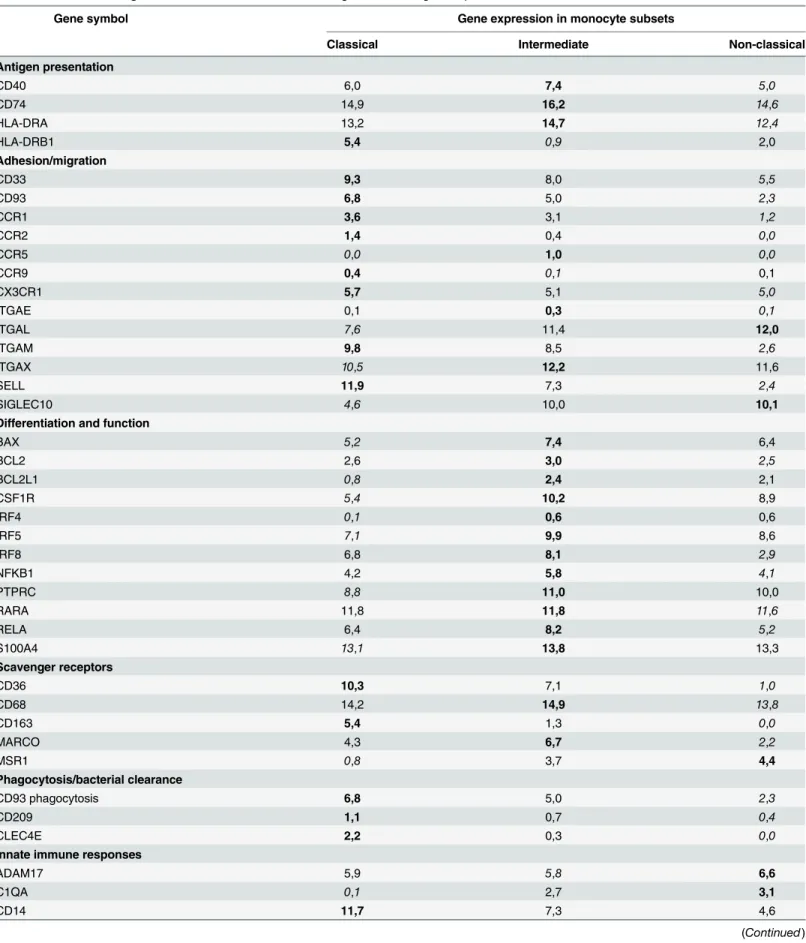
Table 3. Functional categorization. The data indicate relative Log2 transformed gene expression levels.
Gene symbol Gene expression in monocyte subsets
Classical Intermediate Non-classical
Antigen presentation
CD40 6,0 7,4 5,0
CD74 14,9 16,2 14,6
HLA-DRA 13,2 14,7 12,4
HLA-DRB1 5,4 0,9 2,0
Adhesion/migration
CD33 9,3 8,0 5,5
CD93 6,8 5,0 2,3
CCR1 3,6 3,1 1,2
CCR2 1,4 0,4 0,0
CCR5 0,0 1,0 0,0
CCR9 0,4 0,1 0,1
CX3CR1 5,7 5,1 5,0
ITGAE 0,1 0,3 0,1
ITGAL 7,6 11,4 12,0
ITGAM 9,8 8,5 2,6
ITGAX 10,5 12,2 11,6
SELL 11,9 7,3 2,4
SIGLEC10 4,6 10,0 10,1
Differentiation and function
BAX 5,2 7,4 6,4
BCL2 2,6 3,0 2,5
BCL2L1 0,8 2,4 2,1
CSF1R 5,4 10,2 8,9
IRF4 0,1 0,6 0,6
IRF5 7,1 9,9 8,6
IRF8 6,8 8,1 2,9
NFKB1 4,2 5,8 4,1
PTPRC 8,8 11,0 10,0
RARA 11,8 11,8 11,6
RELA 6,4 8,2 5,2
S100A4 13,1 13,8 13,3
Scavenger receptors
CD36 10,3 7,1 1,0
CD68 14,2 14,9 13,8
CD163 5,4 1,3 0,0
MARCO 4,3 6,7 2,2
MSR1 0,8 3,7 4,4
Phagocytosis/bacterial clearance
CD93 phagocytosis 6,8 5,0 2,3
CD209 1,1 0,7 0,4
CLEC4E 2,2 0,3 0,0
Innate immune responses
ADAM17 5,9 5,8 6,6
C1QA 0,1 2,7 3,1
Table 3. (Continued)
Gene symbol Gene expression in monocyte subsets
Classical Intermediate Non-classical
FCGR3A 8,1 11,9 12,3
HMOX1 8,9 12,2 12,0
LTB 0,5 2,8 3,4
MICA 0,8 0,5 0,8
MICB 3,1 4,7 3,7
RAET1E 0,1 0,4 0,4
RAET1G 0,0 0,1 0,0
RAET1L 1,1 2,1 1,5
SERPINB2 0,9 0,1 0,0
SIRPA 9,4 7,4 4,1
TLR2 10,0 9,0 8,8
TLR3 0,0 0,0 0,1
TLR4 8,4 8,0 7,6
TLR7 0,2 1,5 0,5
TLR8 4,7 5,3 5,0
TLR9 3,8 4,2 4,6
TNFSF15 5,8 7,0 6,4
TREM1 11,2 7,8 4,4
TREM2 0,1 0,0 0,0
ULBP3 3,8 5,2 5,0
Cytokines
IL10 2,4 1,2 0,1
IL12A 5,8 7,6 7,0
IL15 2,2 2,5 2,9
IL18 2,7 2,9 0,9
IL1B 1,7 3,3 1,1
IL23A 3,3 3,9 3,9
IL6 0,0 0,1 0,3
TNF 5,8 8,4 9,8
Proteases and protease inhibitors
CST3 13,4 14,3 12,7
CTSB 11,5 12,4 11,1
CTSK 2,5 2,4 1,7
CTSL 0,3 5,2 3,7
CTSS 14,7 14,3 13,8
MMP1 7,3 7,3 7,5
MMP2 0,3 0,7 0,5
MMP3 3,8 6,1 5,7
MMP7 2,5 3,4 2,5
MMP9 0,1 0,0 0,1
TIMP1 11,7 13,0 12,2
SERPINA1 13,2 13,9 13,1
Bold= highest gene expression, Standard = medium gene expression,Italic= lowest gene expression among the three monocyte subsets
CCR1, CCR2, ITGAL, and SICLEG10, the cytokines IL10, IL18 and TNF, and genes involved in differentiation such as the transcription factor IRF5. The intermediate monocytes showed generally multimodal expression of the genes involved in apoptosis and adhesion such as Table 4. Multimodal expression in the three monocyte subsets.
G.ene symbol Gene expression modality Gene symbol Gene expression modality
Classical Intermediate Non-Classical Classical Intermediate Non-Classical
ACTB 0,86 0,68 0,97 IRF8 0,00 0,00 0,00
ADAM17 0,00 0,00 0,00 ITGAE 1,00 1,00 1,00
BAX 0,00 0,00 0,00 ITGAL 0,00 0,83 0,95
BCL2 0,00 0,00 0,00 ITGAM 0,00 0,00 0,00
BCL2L1 0,94 0,00 0,00 ITGAX 0,99 0,86 0,95
C1QA 1,00 0,00 0,00 LTB 0,99 0,00 0,00
CCR1 0,00 0,00 0,31 MARCO 0,00 0,00 0,00
CCR2 0,03 1,00 1,00 MICA 0,98 1,00 0,99
CCR5 1,00 0,99 1,00 MICB 0,00 0,00 0,00
CCR9 1,00 1,00 1,00 MMP1 0,00 0,00 0,00
CD14 0,86 0,00 0,00 MMP2 1,00 1,00 0,99
CD163 0,00 0,15 1,00 MMP3 0,00 0,00 0,00
CD209 0,94 0,99 1,00 MMP7 0,34 0,03 0,22
CD33 0,02 0,00 0,00 MMP9 1,00 1,00 1,00
CD36 0,11 0,00 0,49 MSR1 0,92 0,00 0,00
CD40 0,00 0,00 0,00 NFKB1 0,00 0,00 0,00
CD68 0,70 0,99 0,99 PTPRC 0,96 0,72 0,95
CD74 0,76 0,95 0,98 RAET1E 1,00 0,97 0,99
CD93 0,00 0,00 0,00 RAET1G 1,00 1,00 1,00
CLEC4E 0,00 1,00 1,00 RAET1L 0,86 0,12 0,67
CSF1R 0,00 0,94 0,00 RARA 0,98 1,00 0,83
CST3 0,52 0,62 0,88 RELA 0,00 0,00 0,00
CTSB 0,25 0,75 0,70 S100A4 0,82 0,95 0,91
CTSK 0,00 0,00 0,00 SELL 0,97 0,00 0,00
CTSL 1,00 0,00 0,00 SERPINA1 0,99 0,96 0,99
CTSS 0,85 0,99 0,99 SERPINB2 0,34 1,00 1,00
CX3CR1 0,00 0,00 0,00 SIGLEC10 0,00 0,10 0,70
FCGR3A 0,05 0,96 0,95 SIRPA 0,25 0,00 0,01
HLA.DRA 0,90 0,94 0,61 TIMP1 0,96 0,93 0,90
HLA.DRB1 0,00 0,92 0,02 TLR2 0,85 0,72 0,04
HMOX1 0,00 0,84 0,98 TLR3 1,00 1,00 1,00
IL10 0,00 0,49 1,00 TLR4 0,00 0,00 0,00
IL12A 0,00 0,00 0,00 TLR7 1,00 0,02 1,00
IL15 0,00 0,00 0,00 TLR8 0,00 0,00 0,00
IL18 0,00 0,00 0,24 TLR9 0,00 0,00 0,00
IL1B 0,07 0,00 0,67 TNF 0,00 0,00 0,70
IL23A 0,00 0,00 0,00 TNFSF15 0,83 0,80 0,75
IL6 1,00 1,00 1,00 TREM1 0,66 0,00 0,00
IRF4 1,00 0,98 0,99 TREM2 1,00 1,00 1,00
IRF5 0,00 0,72 0,00 ULBP3 0,00 0,00 0,00
Bold= Multimodal expressionP<0.05,Italic= Unimodal expression
BCL2L1 and SELL, respectively, and the scavenger receptor genes CD36, MARCO and MSR1. Furthermore, it was in particular genes involved in regulating immune responses such as C1QA, CD14, IL1β, IL18, TNF, TLR7, TREM1, and SIRPα, and genes encoding the proteases, CTSL and MMP7 that showed multimodal expression. The non-classical monocytes exhibited, in addition to the genes which also showed multimodal expression by the classical and inter-mediate monocytes, multimodal expression of genes involved in apoptosis, differentiation and activation such as BCL2L1, CSF1R, and IRF5. Similar to the intermediate subset, the non-clas-sical monocytes also showed multimodal expression in a range of immune responsive genes such as ADAM17, C1QA, CD14, LTB, TREM and SIRPαas well as the genes encoding the pro-teases, CTSK, CTSL, MMP1 and MMP3.
We demonstrate here that single-cell gene-expression analysis is a valuable tool in detecting multi-modality within cell populations. To exclude that the bi-modality we observed is not caused by a so-called“drop out effect”due to technology artefact, we calculated the relationship between log-transformed transcript expression data and Hartigan’s dip test p-value. When we include the cells with an expression we found no difference comparing uni- and bi-modal genes (p = 0.54). If genes with low expression were more prone to drop out effects we would have expected an overrepresentation of these amongst the bi-modal genes.
Fig 2. Multimodal variation in expression levels across the three monocyte subsets.Violin plot demonstrating multimodal variation in gene expression levels of the 85 genes examined in the monocyte subsets. The classical monocytes, intermediate monocytes and non-classical monocytes are indicated in the figure by red, green and blue, respectively. The data depict the multimodal expression levels of the genes listed inTable 4calculated by using the Hartigans dip test (P<0.05).
Classification of subpopulations
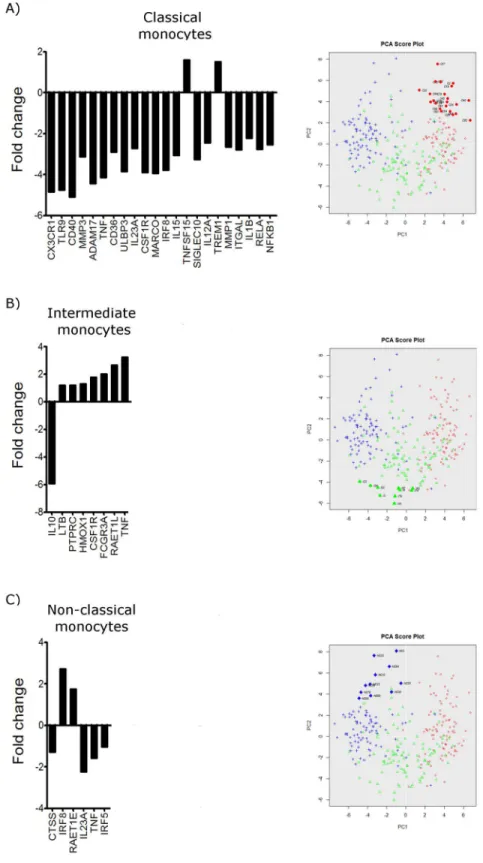
With single-cell gene expression profile we are able to study the heterogeneity between and within cell populations. In addition to the multimodal analysis we also analysed co-expression of genes within the classical monocytes, intermediate monocytes and non-classical monocytes in order investigate potential subgroups with distinct gene expression profiles. Using the PCA of single-cell PCR gene expression analysis data it was possible to identify one subgroup of monocytes that diverged from the main populations (Fig 3andS1 Table). Within the popula-tion of classical monocytes, we found one subgroup that showed differential expression of 22 genes (Fig 3A). Of these genes, only 2 genes showed a higher expression than the main popula-tion, namely TNFSF15 and TREM1. The remaining genes were all found to have lower expres-sion than in the main population. Within the intermediate subset, we also identified a
subgroup of cells displaying differential gene expression of eight genes (Fig 3B). Compared to the main population of intermediate monocytes, only IL10 was found to have lower expression whereas LTB, PTPRC, HMOX1, CSF1R, FCGR3A, RAETL1 and TNF were all found to be sig-nificantly more highly expressed. Likewise, within the non-classical monocytes we found a sub-group of cells with a co-expression of IRF8 and RAET1E at higher levels than the main
population but showing lower gene expression of CTSS, IL123A, IRF5 and TNF (Fig 3C). Comparing the expression of genes within the subgroup of cells identified by the PCA plot, we demonstrate that the classical, intermediate and non-classical human blood monocytes each contain a subgroup of cells characterized by distinct gene signatures. This highlights the great diversity and possible plasticity within the human monocyte sub-populations.
Discussion
Comprehensive genome-wide analyses have shown distinct heterogeneity within human monocytes [9,11,15]. Three subsets have been identified in humans, namely the classical, inter-mediate and non-classical monocytes. In this study we have used the single-cell PCR gene anal-ysis technique from Fluidigm, and confirmed existing data defining three monocyte subsets and demonstrated differential gene expression among the classical, intermediate and non-clas-sical monocytes. Moreover, the differential expression of genes encoding cell surface molecules identified, for instance, the expression of CD163 and TREM2 in classical monocytes and the expression of CCR5 and RAET1G in intermediate monocytes, could be useful when discrimi-nating the three monocyte subsets by methods such as flow cytometry. Furthermore, we have shown inter-cellular variation of genes within each subset, which highlights the heterogeneity of monocytes as a diverse group of innate immune leukocytes containing possible further func-tional subclasses. Thus, by our study, performed with one donor, we here demonstrate the pos-sibilities of subgrouping the monocytes using single-cell PCR gene expression analysis.
The single-cell gene expression analysis presented here demonstrates high phagocytic capacity (CD93, CD209, CLEC4E, and SIRPA) of the classical monocytes, which is in agree-ment with previous studies. Also, a high expression of a broad range of innate sensing receptor genes, pro-inflammatory genes and genes linked to innate immune responses (CD14, TLR2, TLR4 and TREM1) are observed for the classical monocytes [9,11,15]. In addition to these findings we have previously shown that the classical monocytes secrete high levels of IL-1β,
IL-subgroup is marked by filled red circles in the PCA score plot. B) Bar graph demonstrating the differentially expressed genes by the subgroup within the intermediate monocyte subset identified on the PCA score plot. The subgroup is marked by filled green triangles in the PCA score plot. C) Bar graph demonstrating the differentially expressed genes by the subgroup within the non-classical monocyte subset identified on the PCA score plot. The subgroup is marked by filled blue pluses in the PCA score plot.
10, and TNFα, and that most IL-6 and MMP1 is produced in response to LPS and immune-complex activation by the classical subset compared to the intermediate and non-classical sub-set [12]. In accordance to earlier micro-array studies, we also saw the highest expression of genes involved in migration. These findings, together with our previous results showing the highest migratory capacity of the classical monocytes towards CCL2 [12] may underline the capacity of classical monocytes to support inflammation and mount an immune response towards microbial pathogens.
The intermediate monocytes had high antigen presenting potential, which has also been demonstrated by their property to induce CD4+T cell proliferation [15]. Moreover, the inter-mediate monocytes were the only subset that expressed CCR5, a chemokine receptor responsi-ble for recruiting dendritic cell (DC) precursors from blood to the draining lymph nodes [17]. In addition, our data demonstrate higher gene expression of several cytokines (IL1β, IL12A, IL18, and IL23A) which are important in inducing functionally distinct CD4+T helper (Th) cells. IL12 plays a role in the differentiation of Th1 cells, whereas IL6 and IL23 are important in driving and sustaining the differentiation of Th17 cells [18]. Moreover, IL12, IL15, IL18 and TNFSF15 are involved in the induction of T cell receptor-independent cytokine production by CD4+T cells [19–21]. The intermediate monocytes also showed a higher expression of genes linked to the activation status such as apoptosis regulation (BAX and BCL2), cell differentiation and regulation (CSF1R, IRF5, IRF8, NFⱪB1, RELA and PTPRC). This may suggest that these cells are more activated than the classical monocytes.
The CD16+monocytes have been shown to adhere to the endothelium and mediate arrest through the CX3CL1-CX1CR3 interaction [22]. Additionally, the non-classical monocytes are thought to patrol the vasculature and selectively respond to viral infected- or damaged cells. In line with previous data, in non-classical monocytes we found considerably higher expression of genes coupled to complement (C1QA) and FcR-mediated phagocytosis (FcRγ3A), adhesion (ITGAL and SIGLEC10) and TLR9. However, we find that the genes encoding TLR7 and TLR8, which sense nucleic acids and viruses, are mostly expressed by the intermediate subset. Moreover, we find the highest expression of the CX3CR1 gene in the classical subset, albeit with small variation among the three subsets. This latter finding conflicts with previous data showing high cell surface expression of CX3CR1 on non-classical monocytes and their capacity to respond to damaged cells and viral infections. However, these observations in gene expres-sion do not always correspond to the actual protein expresexpres-sion. Thus difficulty in functional interpretation of genes is a limitation to transcriptome analysis and may explain the discrepan-cies between observed protein expression and gene analysis data.
needed to establish if this is in fact the case, thus these potentially different activation states could be of importance in light of the monocytes ability to extravasate into tissues and respond to pathogenic stimulation. For example, cells expression high levels of CCR2 together with CLEC4E, TLR4, and TNF-a might be more prone for migration and response to bacteria, in contrast to monocytes expressing low levels of CCR2. Also, cells expressing high levels of FCGR3A, CD36 and CD163 might be more prone for scavenging and phagocytosis. Several genes encoding immune responses also show multimodal expression within the intermediate subset together with genes encoding the proteases. Though our study has been carried out using monocytes from a healthy donor, the data presented here serve as a basis for discovering targets on certain subpopulations of cells that may be implicated in disease pathogenesis. In addition, single-cell PCR analyses have revealed that colon cancer tissues contain cell popula-tions distinct from healthy colon, which were not identified by immunohistochemistry or flow cytometry [25]. Moreover we identified a subgroup of cells within the classical group of mono-cytes that may be less activated given lower expression of, for example genes within the NFⱪB complex, IRF8, and genes encoding several cytokines such as IL1b, IL12A, IL15, IL23A and TNF. In contrast, we describe here a subgroup of cells among the intermediate monocytes, showing higher gene expression of TNF and FCGR3A and lower expression of IL10, suggesting that the cells of this subgroup are more differentiated towards an immune-activated phenotype. The transcription factor IRF8 is known to be involved in the differentiation of monocytes and DCs [26–28]. The subgroup identified in the non-classical cells showed higher gene expression of IRF8 and lower gene expression of IRF5, IL23A and TNF. This could imply that this sub-group of cells is more differentiated towards dendritic cells. Of note, non-classical monocytes are likewise shown to have a higher propensity to become dendritic cells [29].
The advantage of using single-cell gene expression profiling methods compared to micro-array is the ability to distinguish potential target cells or subgroups of cells implicated in disease pathogenesis. However, the limitation of the single-cell gene expression technique is its being dependent on a predesigned panel of primers compared to the broad dataset obtained using micro-array, which is not limited to investigating predesigned genes only.
Materials and Methods
Monocyte Purification
A buffy coat from a healthy donor was purchased from the Clinical Immunology Blood Bank, The State University Hospital, Copenhagen. Peripheral Blood Mononuclear Cells (PBMC) were obtained using Ficoll-paque Plus (GE-Healthcare Bio-sciences AB, Uppsala, SE) density centrifugation. Untouched monocytes were isolated from PBMC by negative selection using antibody-coated magnetic bead separation (EasySep Human Monocyte Enrichment Kit with-out CD16 depletion, Stemcell Technologies, Vancouver, Canada) according to the manufactur-ers’instructions. The study was approved by the Regional Ethics Committee in Lund, Sweden.
FACS
CD16. Each cell population was sorted into a 96-well plate using fluorescence-activated cell sort-ing (FACS) on a BD FACS ARIAII.
Single-cell gene expression analysis
The monocytes were sorted into 96-well plates by FACS with the target of one cell in each well containing 5μl RT Mix solution (mixture of VILO reaction mix, SUPERase-ln and 10% NP40 according to the manufacturer’s protocol). Samples were frozen on dry ice and after thawing, synthesis of cDNA was performed with SuperScript VILO (Invitrogen). Specific targets ampli-fication (STA) was done with a mixture of 85 PCR primers (seeTable 1) using Taqman preamp master mix (Invitrogen) running 22 cycles. The probes used have all been tested with DNA and were able to amplify and detect transcripts. Residual primers were subsequently removed by treatment with Exonuclease I (New England Biolabs).
After the clean-up step, 6μl of STA PCR product from each sample was transferred to a new microtiter plate and a standard qPCR (TaqMan 2x Universal PCR Master Mix, Applied Biosystems) with a Taqman assay (Invitrogen) directed against 18S, was performed to identify empty wells. Wells with no 18S Ct value or with an 18S Ct value above 40 were considered empty.
Single-cell qPCR was performed on a Fluidigm BiomarkHD instrument using SSO Fast Eva-Green SUpermix (Bio-Ras Laboratories) according to the manufacturer’s protocol. All primer pairs from genes listed inTable 1were used. The data were analysed using the SINGuLAR R package (Fluidigm) and expression values were normalised to that of ACTB.
Sub-groups for each monocyte sub-type were defined from the initial principal component analysis (PCA) plot (Fig 1B). Differentially regulated genes in each sub-group were identified by comparing gene expression in the subgroup versus the rest of the cells in the sub-type using a Students t-test. Differentially regulated genes were defined as those with a p-value<0.05 and a log2 fold change of at least 1.
Supporting Information
S1 Table. List of genes differentially expressed by the monocyte subgroups. (DOCX)
Acknowledgments
The authors would like to thank Anette Klestrup for valuable technical assistance.
Author Contributions
Conceived and designed the experiments: STG SJ KH OG. Performed the experiments: STG TBR. Analyzed the data: STG TBR JGG. Contributed reagents/materials/analysis tools: STG TBR. Wrote the paper: STG OG JGG SJ TBR KH.
References
1. Auffray C, Sieweke MH, Geissmann F (2009) Blood monocytes: development, heterogeneity, and rela-tionship with dendritic cells. Annu Rev Immunol 27: 669–692. doi:10.1146/annurev.immunol.021908.
132557[pii]. PMID:19132917
2. Ziegler-Heitbrock L (2014) Reprint of: Monocyte subsets in man and other species. Cell Immunol. S0008-8749(14)00108-7 [pii]; doi:10.1016/j.cellimm.2014.06.008
mono-4. Ancuta P, Liu KY, Misra V, Wacleche VS, Gosselin A, Zhou X, et al. (2009) Transcriptional profiling reveals developmental relationship and distinct biological functions of CD16+ and. BMC Genomics 10: 403. 1471-2164-10-403 [pii]; doi:10.1186/1471-2164-10-403PMID:19712453
5. Castano D, Garcia LF, Rojas M (2011) Increased frequency and cell death of CD16+ monocytes with Mycobacterium tuberculosis infection. Tuberculosis (Edinb) 91: 348–360. S1472-9792(11)00065-5
[pii]; doi:10.1016/j.tube.2011.04.002
6. Fingerle G, Pforte A, Passlick B, Blumenstein M, Strobel M, Ziegler-Heitbrock HW (1993) The novel subset of CD14+/CD16+ blood monocytes is expanded in sepsis patients. Blood 82: 3170–3176.
PMID:7693040
7. Grip O, Bredberg A, Lindgren S, Henriksson G (2007) Increased subpopulations of CD16(+) and CD56 (+) blood monocytes in patients with active Crohn's disease. Inflamm Bowel Dis 13: 566–572. doi:10.
1002/ibd.20025PMID:17260384
8. Kawanaka N, Yamamura M, Aita T, Morita Y, Okamoto A, Kawashima M, et al. (2002) CD14+,CD16+ blood monocytes and joint inflammation in rheumatoid arthritis. Arthritis Rheum 46: 2578–2586. doi:
10.1002/art.10545PMID:12384915
9. Cros J, Cagnard N, Woollard K, Patey N, Zhang SY, Senechal B, et al. (2010) Human CD14dim mono-cytes patrol and sense nucleic acids and viruses via TLR7 and TLR8 receptors. Immunity 33: 375–
386. S1074-7613(10)00317-1 [pii]; doi:10.1016/j.immuni.2010.08.012PMID:20832340
10. Ziegler-Heitbrock L, Ancuta P, Crowe S, Dalod M, Grau V, Hart DN, et al. (2010) Nomenclature of monocytes and dendritic cells in blood. Blood 116: e74–e80. blood-2010-02-258558 [pii]; doi:10.1182/
blood-2010-02-258558PMID:20628149
11. Wong KL, Tai JJ, Wong WC, Han H, Sem X, Yeap WH, et al.(2011) Gene expression profiling reveals the defining features of the classical, intermediate, and nonclassical human monocyte subsets. Blood 118: e16–e31. blood-2010-12-326355 [pii]; doi:10.1182/blood-2010-12-326355PMID:21653326 12. Thiesen S, Janciauskiene S, Uronen-Hansson H, Agace W, Hogerkorp CM, Spee P, et al.(2014) CD14
(hi)HLA-DR(dim) macrophages, with a resemblance to classical blood monocytes, dominate inflamed mucosa in Crohn's disease. J Leukoc Biol 95: 531–541. jlb.0113021 [pii]; doi:10.1189/jlb.0113021
PMID:24212097
13. Rogacev KS, Seiler S, Zawada AM, Reichart B, Herath E, Roth D, et al.(2011) CD14++CD16+ mono-cytes and cardiovascular outcome in patients with chronic kidney disease. Eur Heart J 32: 84–92.
ehq371 [pii]; doi:10.1093/eurheartj/ehq371PMID:20943670
14. Rossol M, Kraus S, Pierer M, Baerwald C, Wagner U (2012) The CD14(bright) CD16+ monocyte subset is expanded in rheumatoid arthritis and promotes expansion of the Th17 cell population. Arthritis Rheum 64: 671–677. doi:10.1002/art.33418PMID:22006178
15. Zawada AM, Rogacev KS, Rotter B, Winter P, Marell RR, Fliser D, et al.(2011) SuperSAGE evidence for CD14++CD16+ monocytes as a third monocyte subset. Blood 118: e50–e61.
blood-2011-01-326827 [pii]; doi:10.1182/blood-2011-01-326827PMID:21803849
16. Schmidl C, Renner K, Peter K, Eder R, Lassmann T, Balwierz PJ, et al.(2014) Transcription and enhancer profiling in human monocyte subsets. Blood 123: e90–e99. blood-2013-02-484188 [pii]; doi:
10.1182/blood-2013-02-484188PMID:24671955
17. Imhof BA, Aurrand-Lions M (2004) Adhesion mechanisms regulating the migration of monocytes. Nat Rev Immunol 4: 432–444. doi:10.1038/nri1375nri1375 [pii]. PMID:15173832
18. Zhou L, Chong MM, Littman DR (2009) Plasticity of CD4+ T cell lineage differentiation. Immunity 30: 646–655. S1074-7613(09)00198-8 [pii]; doi:10.1016/j.immuni.2009.05.001PMID:19464987 19. Holmkvist P, Roepstorff K, Uronen-Hansson H, Sanden C, Gudjonsson S, Patschan O, et al.(2015) A
major population of mucosal memory CD4(+) T cells, coexpressing IL-18Ralpha and DR3, display innate lymphocyte functionality. Mucosal Immunol 8: 545–558. mi201487 [pii]; doi:10.1038/mi.2014.
87PMID:25269704
20. Papadakis KA, Prehn JL, Landers C, Han Q, Luo X, Cha SC, et al.(2004) TL1A synergizes with IL-12 and IL-18 to enhance IFN-gamma production in human T cells and NK cells. J Immunol 172: 7002–
7007. PMID:15153521
21. Sattler A, Wagner U, Rossol M, Sieper J, Wu P, Krause A, et al.(2009) Cytokine-induced human IFN-gamma-secreting effector-memory Th cells in chronic autoimmune inflammation. Blood 113: 1948–
1956. blood-2008-02-139147 [pii]; doi:10.1182/blood-2008-02-139147PMID:19104082
22. Ancuta P, Rao R, Moses A, Mehle A, Shaw SK, Luscinskas FW, et al.(2003) Fractalkine preferentially mediates arrest and migration of CD16+ monocytes. J Exp Med 197: 1701–1707. doi:10.1084/jem.
23. Shalek AK, Satija R, Adiconis X, Gertner RS, Gaublomme JT, Raychowdhury R, et al.(2013) Single-cell transcriptomics reveals bimodality in expression and splicing in immune Single-cells. Nature 498: 236–
240. nature12172 [pii]; doi:10.1038/nature12172PMID:23685454
24. Kippner LE, Kim J, Gibson G, Kemp ML (2014) Single cell transcriptional analysis reveals novel innate immune cell types. PeerJ 2: e452. doi:10.7717/peerj.452452 [pii]. PMID:25024920
25. Dalerba P, Kalisky T, Sahoo D, Rajendran PS, Rothenberg ME, Leyrat AA, et al.(2011) Single-cell dis-section of transcriptional heterogeneity in human colon tumors. Nat Biotechnol 29: 1120–1127.
nbt.2038 [pii]; doi:10.1038/nbt.2038PMID:22081019
26. Yamamoto M, Kato T, Hotta C, Nishiyama A, Kurotaki D, Yoshinari M, et al.(2011) Shared and distinct functions of the transcription factors IRF4 and IRF8 in myeloid cell development. PLoS One 6: e25812. doi:10.1371/journal.pone.0025812PONE-D-11-09702 [pii]. PMID:22003407
27. Tamura T, Tailor P, Yamaoka K, Kong HJ, Tsujimura H, O'Shea JJ, et al.(2005) IFN regulatory factor-4 and -8 govern dendritic cell subset development and their functional diversity. J Immunol 174: 2573–
2581. 174/5/2573 [pii]. PMID:15728463
28. Guilliams M, Ginhoux F, Jakubzick C, Naik SH, Onai N, Schraml BU, et al.(2014) Dendritic cells, mono-cytes and macrophages: a unified nomenclature based on ontogeny. Nat Rev Immunol 14: 571–578.
nri3712 [pii]; doi:10.1038/nri3712PMID:25033907