Article
Effects of a silenced gene in Boolean network models
Emir Haliki, Nadide Kazanci
Faculty of Science, Department of Physics, Ege University, Bornova 35040, Turkey E-mail: [email protected], [email protected], [email protected]
Received 5 January 2017; Accepted 8 January 2017; Published 1 March 2017
Abstract
Gene regulation and their regulatory networks are one of the most challenging research problems of computational biology and complexity sciences. Gene regulation is formed by indirect interaction between
DNA segments which are protein coding genes to configure the expression level of one another. Prevention of expression of any genes in gene regulation at the levels of transcription or translation indicates the gene
silencing event. The present study examined what types of results in gene silencing would bring about in the dynamics of Boolean genetic regulatory mechanisms. The analytical study was performed in gene expression variations of Boolean dynamics first, then the related numerical analysis was simulated in real networks in
the literature.
Keywords gene silencing; gene regulation; Boolean network; cell-cycle; gene expression; cellular phenotype.
1 Introduction
Gene silencing is a usual term used in blocking expression of any genes inside a cell, implying prevention of a gene to express. In complete set of genes of a cell, most of them are important for a variety of reasons
(Bouchard, 1994; Cavalli-Sforza et al., 1994; Giaever et al., 2002). However, some of them can have mutations, leading to them not functioning in a normal way, which is undesirable for the cell. Several techniques exist to eradicate the mutated genes. A gene can be cut out from a cell, by recombinant
technologies with several methods, which is called the gene knock-out (Colot et al., 2006; Han et al., 2002). There is another way named the gene knock-down, blocking only the expression of a gene while gene is still
present (Szulc et al., 2006; Tiscornia et al., 2003). A gene knock-down mechanism is called the gene silencing, meaning the degradation of that gene for the DNA, after which a gene can no longer produce protein no products can be made in the absence of RNA (Herman and Baylin, 2003). These processes are
different but both of them have similar objectives. Although gene silencing can emerge at transcriptional and translational levels, transcriptional regulatory networks provide an investigation platform for its effects in a
cellular phenotype (Agustino-Martinez, 2011; Hammond et al., 2001).
The expression of most protein-coding genes in eukaryotes is regulated predominantly at the Network Biology
ISSN 22208879
URL: http://www.iaees.org/publications/journals/nb/onlineversion.asp RSS: http://www.iaees.org/publications/journals/nb/rss.xml
Email: [email protected] EditorinChief: WenJun Zhang
Network Biology, 2017, 7(1): 10-20
IAEES www.iaees.org transcriptional level (Johnson and McKnight, 1989). Transcription mechanism includes transcription factors bound to promoter sites around a gene (Mermelstein et al., 1989). Gene regulatory networks (GRN) or
transcriptional regulatory networks indicate that sets of genes encoding transcriptional regulators mutually regulate expression level of each other and determine the very basis of any cell's fate (Wagner, 1994). On the other hand, many genes are regulated by the RNA interference (RNAi). For example, miRNAs of mammals
are predicted to control the activity of ~ % of all protein-coding genes. Functional studies point out that miRNAs take part in the regulation of almost every cellular process which has been investigated so far. RNA
interference is a gene silencing mechanism that can also naturally appears during or after the transcription throughout the life (Haynes et al., 2012). If gene silencing occurred naturally as the result of evolution or selection or a random process, it could account for significant changes in sustainability of an organism.
It is very crucial impression of modeling the qualitative behavior of biological networks where molecules are represented as nodes and the molecular interactions are so called edges (Din, 2014; Zhang,
2012, 2015, 2016a, 2016b). Thus, investigation of gene silencing requires that an appropriate gene regulatory network model should be selected. Gene regulatory network models are mainly categorized into three groups namely, logical models, continuous models and single-molecule models. Those that fall into logical category
are discrete models so that they can explain the existing network qualitatively, allowing a basic knowledge of the dynamics and functions of a network under different conditions (Bolouri and Davidson, 2002). Their
applicability covers a wide range of systems including biological phenomena, one of which is the Boolean modeling technique introduced by Kauffman (Glass and Kauffman, 1973; Kauffman, 1993). Under the Boolean model, the state of the genes, which are Boolean variables and the phenotypic transitions which they
can make are determined by the states of the other genes in the network with the Boolean logic functions governing each gene (Albert, 2004). One of the aspects of all Boolean model is that microarray experiments
must first be processed to binary in the experimental data from time series as the Boolean functions of the networks can only process binary data (Hakamada et al., 2001). Successfully applied to several different
organisms, Boolean GRN models are a simple and useful model to describe genetic regulatory systems (Hickman and Hodgman, 2009).
Our purpose here is to investigate the effects of gene silencing on a cellular phenotype using Boolean
GRN models. What are its effects on a phenotype if it happens incidentally? We made an analysis for the probability of changes at the expression levels of other genes, obtaining some numerical results for its effects
in cell cycles of some real Boolean GRNs in literature.
2 Method
Under the working principle of Boolean GRNs, genes (and also their product proteins) are nodes of the network assigned to a binary value , with for active and for inactive. Any cellular phenotypes are represented by their expression patterns Φ , , … , where is the number of genes. Gene interactions are directed edges. Since genes are described as either active or inactive independently of their RNA levels, edge weights do not have to be quantified biologically. Such interactions are captured by the network adjacency matrix , which is the GRN itself, with elements representing an interaction arrow from gene to gene (Lau et al., 2007), and the allowed values are given by
, , . For the two genes and , if an interaction exist, it can be either activating or inhibiting . The change in the expression state of each gene of the phenotype Φ as time progresses in discrete timesteps under the condition below
,
,
,
which reflects the regulation of gene i's expression by other genes. Under the gene regulation rule, and after its completion for each gene, phenotype goes to the next timestep. A sequence of updating phenotypes forms the trajectory. The phenotype which repeats itself in the trajectory is the stable state once it has been reached.
There can be some limit cycles as well (Glass and Kauffman, 1973; Kauffman, 1969).
In order to investigate the effects of gene silencing on other genes, we first have to define that event
(Jablonka and Lamb, 2005) in Boolean manner. Gene silencing can be considered a type of loss-of-function mutation in which the altered gene product lacks the molecular function of the silenced gene (Nowak, 2006). In our model one particular active gene is chosen and its state is fixed at zero, regardless of the state what
remains of the GRN. To examine the effect of the silenced gene on the expression of other genes, such a path can be traced.
By the silencing of active gene
Φ , , … , , … , , fixed
we define a new threshold function for the gene, which counted as a target of , by subtracting the contribution of silenced gene from the sum of
with the gene regulation condition becoming as follows
, , ,
3 Application
A silenced gene still sustains its existence in the regulatory network compared to the gene knock-out process.
Thus, only its expression is inactivated. Here are two different things to be considered. First, change of at least one gene's expression means that of the phenotype, in which case silenced gene changes the phenotype
already by turning its active expression level into inactive. Second, change in the expression level of the silenced gene can induce that in other gene's expression levels. Therefore, the number of regulatory connections of silenced gene is of great importance. More evidently, other affected genes also indicate a
IAEES
Fig. 1 A g
shows tha silenced. I genes to t target gene Prob Boolean any seco sums ( of silenc counted. alteration exactly th The out-conn isolated other gen generalized flow at if the conne
Inner branches the target in e ( s) deter
bability of af GRN model.
nd layer bran ) for , o
ed gene is su Thus the tot n of the affec
he same, tota
e effect of sil nection (a tran
from the netw nes. If we do
w chart demon ction is activa indicate value ncluding itself rmine the altera
ffected ’s a . First, we ob
nch, it is / or accessible
ubtracted), so tal number o cted gene. Wi
al probability
lenced gene nscription fac
work, no alte not have any
Network
nstrating ’s a tory state a es of the new th (self regulation ation.
lteration can serve that tw
. The states. In mo
o does the po f accessible ith the additio
for one gene
on multiple ctor arrow fr
erations can b y idea of the
k Biology, 2017
alteration condit and right branc hreshold functi n loop). As for
be obtained wo branches pr
e denominato re detail, neg
sitive . A states is on of the pro
is calculated
genes depen rom silenced
be expected. silenced gen
7, 7(1): 10-20
tions under the ch that if it is ion which is th r some given v
from the gen rovide us wit
r is n gative c And an acces . Finally oducts of prob
d as following
nds on the nu gene to a tar
On the other e, number of
e influence of t
inhibitory he regulatory co values of ,
neralized sche th 1/2 probab number of po
an be
ssible state, w y, on the third babilities for
g
umber of con rget gene) of
r hand, it can f its out-conn
w the silenced
before the ontributions of
earlier express
eme of gene bility for eac
ssible thresho
maximum (c which is zero, d layer 2/4 br two branche
nnections. If f the silenced
n be out-conn ections and t
www.iaees.org . Left branch has been f non-silenced sion levels of
silencing in h. Then, for
old function contribution
, need to be rings us the es which are
there is no d gene or its
of network in which it is, the following equation would be achieved
, which was found as the silenced gene's alteration probability on a cellular phenotype (at least one other gene
than itself) for any random Boolean GRNs. is the out-degree (Ebel et al., 2002) of the silenced gene and its maximum . Note that we consider just one silenced gene in a phenotype to simplify the computation of its effects.
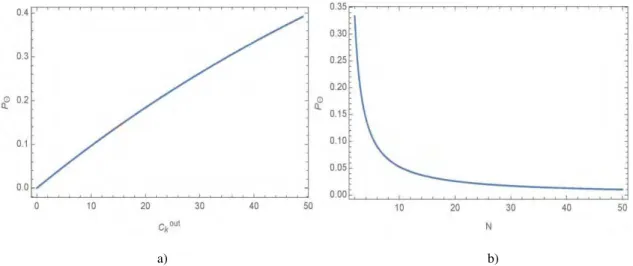
Real biological GRNs abide by the rules of randomly distributed networks, preventing us from having to write down any relation between the possible out-degree and network size, . Thus, they need to be regarded as two different variables in the equation above ( ). In the limit of maximum out-degree ( ), the alteration probability approaches to its maximum (Fig. 2a). Probability function cannot go on since the
maximum value of the out-degree is . If we re-write with in its maximum value, and increase the network size to infinity
lim
the limit converges to /√ . 9 which is found to be the maximum alteration probability limit for any Boolean network after silencing of a gene. As with influence of silenced gene on other genes, any
changes in expression of affected genes do mean the same thing that is, contribution of silenced gene to phenotypic variation by attracting other genes to itself. Altered genes may affect others which also affect some others such as in a chain reaction so on. On the other hand, if we fix the silenced gene's out-degree to a
constant and increase the network size then alteration probability decreases due to the growing number of accessible states ( ) and changes asymptotically (Fig. 2b).
a) b)
Fig. 2 a) Silenced gene's alteration probability with respect to the out-degree in a random GRN composed of 50 genes. The
potential of silenced gene's influence rises curvilinear with its out-degree having a maximum on 9, . 9 . b) Alteration probability with respect to the number of genes in network. is fixed to 1, which turn out to be equation
IAEES Now
dynamic statesΦst same cla number initial co We computat cycle, wh and unde
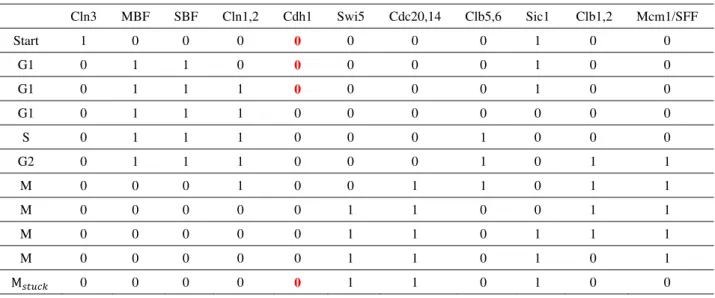
Fig. 3 Cel
yellow loo
Table 1 C
stationary Start G1 G1 G1 S G2 M M M M M G1 G w we are her
s start from
table also c ass so that the
of attracted p onditions of ce set out with
tions (Fig. 3) hich is compo
er the regulati
ll-cycle networ ops are self-deg
Cell-cycle trajec G1 state again. Cln3 MB 1 0 0 1 0 1 0 1 0 1 0 1 0 0 0 0 0 0 0 0 0 0 0 0 0 0 re concerned
m all possibl alled basin o ey are all ass
phenotypes i ell-cycle, we h the cell cy
). It has a sig osed of two a
ion dynamics
rk of S. cerevis gredation proces
ctory by activati . BF SBF 0 1 1 1 1 1 0 0 0 0 0 0 0 Network with some r
le initial sta of attraction. sociated with
is the basin s studied effec ycle network
gnificant supe active and nin
s, one cell-cyc
siae. Green lin sses which are a
ion of Cln3 gen
Cln1,2 Cdh 0 1 0 1 1 1 1 0 1 0 1 0 1 0 0 0 0 0 0 0 0 1 0 1 0 1
k Biology, 2017
real Boolean
ates Φ w All initial p the same sta
size of relate cts of gene sil k of the mod
er state (large ne inactive ge
cle trajectory
nks for an activ also inhibitory.
ne via start sign
h1 Swi5 0 0 0 0 0 0 0 1 1 1 1 1 0
7, 7(1): 10-20
GRN model
with , , henotypes at able state (Kr
ed stable stat lencing on rea del organism
est basin size enes. By exci
y appears as in
vating, dotted r
nal. After all oth
Cdc20,14 0 0 0 0 0 0 1 1 1 1 1 0 0 s whose phen
… , , and ttracted to th rawitz and Sh
te. Now that al data. m S. cerevisia
e) indicating ting the state
n table (Table
red links for an
her phases S, G
Clb5,6 Sic 0 1 0 1 0 1 0 0 1 0 1 0 1 0 0 0 0 1 0 1 0 1 0 1 0 1 w notypic gene
arrive at s he same basin
hmulevich, 2
stable pheno
ae (Li et al. the G1 phase by activating
e 1).
n inhibiting inte
G2 and M, cell r
1 Clb1,2 0 0 0 0 0 1 1 1 1 0 0 0 0 www.iaees.org e expression some stable n are in the 2007). Thus,
otypes were
, 2004) for
e of the cell g Cln3 gene
eraction. And
reaches to the
Since real networks show a certainty about the structure of the links, probabilistic calculations tend to be meaningless. We applied the gene silencing to observe likely phenotypic and trajectory variations. First, Sic1
gene which has an out-degree of two was silenced and the new trajectory is shown in Table 2, where we encountered a chain reaction. Having transcriptional attacks to two genes (Clb1,2 and Clb5,6), Sic1 altered the expression level of Clb5,6. More clearly, ∑ , , with Sic1’s , ,
contribution to the sum of Clb5,6 whose expression was also zero in previous timestep, before silencing of Sic1. After silencing, contribution of Sic1 is gone and , . Thus Clb5,6 is activated when
needed to remain inactive. In next timesteps, altered Clb5,6 affects Mcm1/SFF and it affects Swi5, Cdc20, Clb1,2 so on. When the7 timestep has reached the flow stopped, and only the silenced gene's expression level is comparatively different from the original cell-cycle loop. Other genes' expressions reached the
metaphase such as in the non-silenced procedure, but from a different trajectory. It caused new cell cycle to stop that Sic1 was not active again, which implies an effect of silence on the system.
Table 2 New cell-cycle trajectory after the silencing of Sic1. Changes in the expression levels of other genes are shown in red
and bold.
Cln3 MBF SBF Cln1,2 Cdh1 Swi5 Cdc20,14 Clb5,6 Sic1 Clb1,2 Mcm1/SFF
Start 1 0 0 0 1 0 0 0 0 0 0
G1 0 1 1 0 1 0 0 0 0 0 0
G1 0 1 1 1 1 0 0 1 0 0 0
G1 0 1 1 1 0 0 0 1 0 0 1
S 0 1 1 1 0 1 1 1 0 1 1
G2 0 0 0 1 0 1 1 1 0 1 1
M 0 0 0 0 0 1 1 0 0 1 1
M 0 0 0 0 0 1 1 0 0 1 1
A similar event is observable in the silence of Cdh1. After Cdh1 whose out-degree is 1 was
silenced, it did not lead to any expression levels on any genes without general disturbance of cell cycle (Table 3). However, when the system reached to fifth state of the M phase, cell-cycle cannot continue because
silenced Cdh1 was not active again.
Table 3 New cell-cycle trajectory after the silencing of Cdh1. Cdh1 stopped the cell-cycle on its own.
Cln3 MBF SBF Cln1,2 Cdh1 Swi5 Cdc20,14 Clb5,6 Sic1 Clb1,2 Mcm1/SFF
Start 1 0 0 0 0 0 0 0 1 0 0
G1 0 1 1 0 0 0 0 0 1 0 0
G1 0 1 1 1 0 0 0 0 1 0 0
G1 0 1 1 1 0 0 0 0 0 0 0
S 0 1 1 1 0 0 0 1 0 0 0
G2 0 1 1 1 0 0 0 1 0 1 1
M 0 0 0 1 0 0 1 1 0 1 1
M 0 0 0 0 0 1 1 0 0 1 1
M 0 0 0 0 0 1 1 0 1 1 1
M 0 0 0 0 0 1 1 0 1 0 1
IAEES We literature trajectory conseque the origi cerevisia biologica activated
Fig. 4 Cel have activ S G G G G G G G applied the g e in 2008 (D
y is in Tabl ences in table
inal one exce ae. When the
ally invalid p
d again.
ll-cycle GRN o vation threshold Start Start 1 G1 0 G1/S 0 G2 0 G2 0 G2/M 0 G2/M 0 M 0 M 0 G 0 gene silencing Davidich and
le 4. Ste9, R es 5, 6, 7. Fir
ept the level trajectory co phase not the
f S. pombe. Dy ds which are diff
SK Cd 0 1 0 0 0 0 0 0 0 0 Network g to super sta Bornholdt, 2
Rum1 and W st, both of wh
l of the silen ompleted and e G1. The on
ynamical differe fferent than zero
Table 4 C
dc2,13 Ste9 0 1 0 1 0 0 1 0 1 0 1 0 1 0 0 0 0 1 0 1
k Biology, 2017
ate caused by 2008) with s
Wee1 of the hich caused t
nced gene, a d system reac nly reason fo
ences between o. Cell-cycle loop 9 Rum1 1 1 0 0 0 0 0 0 1 1
7, 7(1): 10-20
y GRN of S. p somewhat sim
e super state the phenotype
as also detec ches the 9 t or this is that
S. Cerevisiae G
of S. pombe. Slp1 Cdc2
0 0
0 0
0 0
0 0
0 0
0 1
1 1
1 0
0 0
0 0
pombe model milar results.
were silenc e fall into me
cted in the si time step, ce t the three si
GRN are Cdc2,
2,13* Wee1 0 1 0 1 0 1 0 1 0 0 1 0 1 0 0 0 0 1 0 1 w l organism (F
The origina
ced separatel etaphase from
ilenced Cdh1 ll cycle impl ilenced genes
13 and Cdc2,13
1 Cdc25 0 0 0 0 1 1 1 1 0 0 www.iaees.org Fig. 4) in the al cell-cycle
ly with the m a path like
1 gene ofS.
loded into a s cannot be
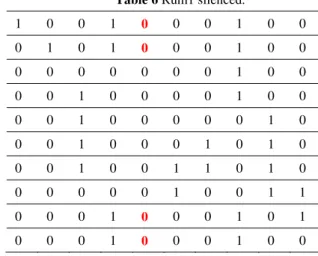
Table 5 Ste9 silenced. Table 6 Rum1 silenced.
Start 1 0 0 0 1 0 0 1 0 0 1 0 0 1 0 0 0 1 0 0
G1 0 1 0 0 1 0 0 1 0 0 0 1 0 1 0 0 0 1 0 0
G1/S 0 0 0 0 0 0 0 1 0 0 0 0 0 0 0 0 0 1 0 0
G2 0 0 1 0 0 0 0 1 0 0 0 0 1 0 0 0 0 1 0 0
G2 0 0 1 0 0 0 0 0 1 0 0 0 1 0 0 0 0 0 1 0
G2/M 0 0 1 0 0 0 1 0 1 0 0 0 1 0 0 0 1 0 1 0
G2/M 0 0 1 0 0 1 1 0 1 0 0 0 1 0 0 1 1 0 1 0
M 0 0 0 0 0 1 0 0 1 1 0 0 0 0 0 1 0 0 1 1
M 0 0 0 0 1 0 0 1 0 1 0 0 0 1 0 0 0 1 0 1
unk. 0 0 0 0 1 0 0 1 0 0 0 0 0 1 0 0 0 1 0 0
Table 7 Wee1 silenced.
Start 1 0 0 1 1 0 0 0 0 0
G1 0 1 0 1 1 0 0 0 0 0
G1/S 0 0 0 0 0 0 0 0 0 0
G2 0 0 1 0 0 0 0 0 0 0
G2 0 0 1 0 0 0 0 0 1 0
G2/M 0 0 1 0 0 0 1 0 1 0
G2/M 0 0 1 0 0 1 1 0 1 0
M 0 0 0 0 0 1 0 0 1 1
M 0 0 0 1 1 0 0 0 0 1
unk. 0 0 0 1 1 0 0 0 0 0
4 Discussion
As for Boolean network formalism of GRNs, gene silencing applied to the systems was studied. What type of effects silenced gene had on other genes were algebraically and probabilistically explored first, then some
numerical examinations were performed in real data. According to the obtained results, when gene silencing was applied one by one to active genes of the super states to which GRNs carried cellular phenotypes, there
are if little likelihood for other genes to change expressions (max. /√ ). However, the system in a whole cell cycle mostly tries to adjust itself to the original cycle again. And constantly inactivated expressions of silenced genes make the phenotype stuck in related phases causing the cell cycle trajectory to
be stopped. Moreover, genes having been silenced also exist which carry the system to different cellular phases (possibility of apoptosis or invasion). This issue can be investigated by looking at the tasks of silenced
Network Biology, 2017, 7(1): 10-20
IAEES www.iaees.org References
Agustino Martinez A. 2011. Escherichia coli transcriptional regulatory network. Network Biology, 1(1):
21-33
Albert R. 2004. Boolean modeling of genetic regulatory networks. Lecture Notes Physics, 650: 459-481 Bolouri H, Davidson EH. 2002. Modeling transcriptional regulatory networks. BioEssays, 24(12): 1118-1129
Bouchard TJ. 1994. Genes, environment, and personality. Science, 264(5166): 1700-1701
Cavalli-Sforza LL, Menozzi P, Piazza A. 1994. The history and geography of human genes. 5-7, Princeton
University Press, USA
Colot HV, Park G, Turner GE, et al. 2006. A high-throughput gene knockout procedure for Neurospora reveals functions for multiple transcription factors. Proceedings of the National Academy of Sciences of
USA, 103(27): 10352-10357
Davidich MI, Bornholdt S. 2008. Boolean network model predicts cell cycle sequence of fission yeast. Plos
One, 3(2): 1-8
Din Q. 2014. Stability analysis of a biological network. Network Biology, 4(3): 123-129
Ebel H, Mielsch LI, Bornholdt S. 2002. Scale-free topology of e-mail networks. Physical Review E, 66(3):
1-4
Giaever G, Chu AM, Ni L, et al. 2002. Functional profiling of theSaccharomyces cerevisiaegenome. Nature,
418(6896): 387-391
Glass L, Kauffman SA. 1973. The logical analysis of continuous, non-linear biochemical control networks. Journal of Theoretical Biology, 39(1): 103-129
Hammond SM, Caudy AA, Hannon GJ. 2001. Post-transcriptional gene silencing by double-stranded RNA. Nature Reviews Genetics, 2: 110-119
Hakamada K, Hanai T, Honda H. 2001. Identifying genetic network using experimental time series data by Boolean algorithm. Genome Informatics,12: 272-273
Han H, Tanigaki K, Yamamoto N, et al. 2002. Inducible gene knockout of transcription factor recombination signal binding protein-J reveals its essential role in T versus B lineage decision. International Immunology, 14(6):637-645
Haynes KA, Ceroni F, Flicker D. 2012. A sensitive switch for visualizing natural gene silencing in single cells. ACS Synthetic Biology, 1(3): 99-106
Herman JG, Baylin SB. 2003. Gene silencing in cancer in association with promoter hypermethylation. New England Journal of Medicine, 349(21): 2042-2054
Hickman GJ, Hodgman TC. 2009. Inference of gene regulatory networks using boolean-network inference
methods. Journal of Bioinformatics and Computational Biology, 7(6): 1013-1029
Jablonka E, Lamb MJ. 2005. Evolution in four dimensions. 47-79, Massachusets Institute of Technology
Press, USA
Johnson PF, McKnight SL. 1989. Eukaryotic transcriptional regulatory proteins. Annual Review of Biochemistry, 58: 799-839
Lau KY, Ganguli S, Tang C. 2007. Function constrains network architecture and dynamics: a case study on the yeast cell cycle Boolean network. Physical Review E, 75: 1-9
Li F, Long T, Lu Y, et al. 2004. The yeast cell-cycle network is robustly designed. Proceedings of the National Academy of Sciences of USA, 101(14): 4781-4786
Kauffman SA. 1969. Metabolic stability and epigenesis in randomly constructed genetic nets. Journal of
Theoretical Biology, 22(3): 437-467
University Press, UK
Krawitz P, Shmulevich I. 2007. Basin entropy in Boolean network ensembles. Physical Review Letters,
98(15): 1-4
Mermelstein FH, Flores O, Reinberg D. 1989. Initiation of transcription by RNA polymerase II. Biochimicaet Biophysica Acta, 1009(1): 1-10
Szulc J, Wiznerowicz M, Sauvain MO, et al. 2006. A versatile tool for conditional gene expression and knockdown. Nature Methods, 3(2): 109-116
Tiscornia G, Singer O, Ikawa M, et al. 2003. A general method for gene knockdown in mice by using lentiviral vectors expressing small interfering RNA. Proceedings of the National Academy of Sciences of USA, 100(4): 1844-1848
Nowak MA. 2006. Evolutionary dynamics. 209-249, Harvard University Press, USA
Wagner A. 1994. Evolution of gene networks by gene duplications: a mathematical model and its
implications on genome organization. Proceedings of the National Academy of Sciences of USA, 91(10): 4387-4391
Zhang WJ. 2012. Computational Ecology: Graphs, Networks and Agent-based Modeling. World Scientific,
Singapore
Zhang WJ. 2015. A generalized network evolution model and self-organization theory on community
assembly. Selforganizology, 2(3): 55-64
Zhang WJ. 2016a. A mathematical model for dynamics of occurrence probability of missing links in
predicted missing link list. Network Pharmacology, 1(4): 86-94