A Controlled Study of Tuberculosis Diagnosis
in HIV-Infected and Uninfected Children in
Peru
Richard A. Oberhelman1*, Giselle Soto-Castellares2,3, Robert H. Gilman2,4,5, Maria E. Castillo6,7, Lenka Kolevic6, Trinidad Delpino6, Mayuko Saito2,4¤a, Eduardo
Salazar-Lindo8, Eduardo Negron8, Sonia Montenegro9, V. Alberto Laguna-Torres3, Paola Maurtua-Neumann10¤b, Sumona Datta4,11,12, Carlton A. Evans4,11,12
1Tulane School of Public Health and Tropical Medicine, New Orleans, Louisiana, United States of America, 2Asociación Benéfica Proyectos en Informatica, Salud, Medicina, y Agricultura (PRISMA), Lima, Peru, 3US Naval Medical Research Unit Six, Lima, Peru,4Department of Microbiology, Faculty of Sciences and Philosophy, Universidad Peruana Cayetano Heredia, Lima, Peru,5Department of International Health, Johns Hopkins Bloomberg School of Public Health, Baltimore, Maryland, United States of America, 6Infectious Diseases Service, Instituto Nacional de Salud del Niño, Lima, Peru,7Department of Pediatrics, Faculty of Medicine, Universidad Peruana Cayetano Heredia, Lima, Peru,8Department of Pediatrics, Hospital Nacional Cayetano Heredia, Lima, Peru,9Universidad de Concepción, Concepción, Chile, 10Department of Pediatrics, Tulane University School of Medicine, New Orleans, Louisiana, United States of America,11Infectious Diseases & Immunity, Imperial College London, and Wellcome Trust Imperial College Centre for Global Health Research, London, United Kingdom,12 IFHAD: Innovation For Health And Development, London, United Kingdom
¤a Current address: Department of Virology, Tohoku Graduate School of Medicine, Sendai, Japan
¤b Current address: Department of Pediatrics, College of Medicine, University of South Alabama, Mobile, Alabama, United States of America
Abstract
Background
Diagnosing tuberculosis in children is challenging because specimens are difficult to obtain and contain low tuberculosis concentrations, especially with HIV-coinfection. Few studies included well-controls so test specificities are poorly defined. We studied tuberculosis diag-nosis in 525 children with and without HIV-infection.
Methods and Findings
‘Cases’were children with suspected pulmonary tuberculosis (n = 209 HIV-negative; n = 81 HIV-positive) and asymptomatic‘well-control’children (n = 200 negative; n = 35 HIV-positive). Specimens (n = 2422) were gastric aspirates, nasopharyngeal aspirates and stools analyzed by a total of 9688 tests.
All specimens were tested with an in-house hemi-nested IS6110 PCR that took<24 hours. False-positive PCR in well-controls were more frequent in HIV-infection (P0.01): 17% (6/35) HIV-positive well-controls versus 5.5% (11/200) HIV-negative well-controls; caused by 6.7% (7/104) versus 1.8% (11/599) of their specimens, respectively. 6.7% (116/
OPEN ACCESS
Citation:Oberhelman RA, Soto-Castellares G, Gilman RH, Castillo ME, Kolevic L, Delpino T, et al. (2015) A Controlled Study of Tuberculosis Diagnosis in HIV-Infected and Uninfected Children in Peru. PLoS ONE 10(4): e0120915. doi:10.1371/journal. pone.0120915
Academic Editor:Jean Louis Herrmann, Hopital Raymond Poincare - Universite Versailles St. Quentin, FRANCE
Received:June 9, 2014
Accepted:February 9, 2015
Published:April 30, 2015
Copyright:This is an open access article, free of all copyright, and may be freely reproduced, distributed, transmitted, modified, built upon, or otherwise used by anyone for any lawful purpose. The work is made available under theCreative Commons CC0public domain dedication.
Data Availability Statement:All data are within the paper and its Supporting Information files.
1719) specimens from 25% (72/290) cases were PCR-positive, similar (P>0.2) for HIV-posi-tive versus HIV-negaHIV-posi-tive cases.
All specimens were also tested with auramine acid-fast microscopy, microscopic-obser-vation drug-susceptibility (MODS) liquid culture, and Lowenstein-Jensen solid culture that took6 weeks and had 100% specificity (all 2112 tests on 704 specimens from 235 well-controls were negative). Microscopy-positivity was rare (0.21%, 5/2422 specimens) and all microscopy-positive specimens were culture-positive. Culture-positivity was less frequent (P0.01) in HIV-infection: 1.2% (1/81) HIV-positive cases versus 11% (22/209) HIV-nega-tive cases; caused by 0.42% (2/481) versus 4.7% (58/1235) of their specimens,
respectively.
Conclusions
In HIV-positive children with suspected tuberculosis, diagnostic yield was so low that 1458 microscopy and culture tests were done per case confirmed and even in children with cul-ture-proven tuberculosis most tests and specimens were false-negative; whereas PCR was so prone to false-positives that PCR-positivity was as likely in specimens from well-controls as suspected-tuberculosis cases. This demonstrates the importance of control participants in diagnostic test evaluation and that even extensive laboratory testing only rarely contribut-ed to the care of children with suspectcontribut-ed TB.
Trial Registration
This study did not meet Peruvian and some other international criteria for a clinical trial but was registered with theClinicalTrials.govregistry: ClinicalTrials.govNCT00054769
Introduction
HIV-infection is associated with tuberculosis (TB) disease, atypical clinical and x-ray charac-teristics and low mycobacterial concentrations that delay TB diagnosis, potentially increasing
morbidity, mortality and TB transmission [1,2]. Challenges diagnosing pulmonary TB are
sim-ilar and synergistic for patients with Human Immunodeficiency Virus (HIV) co-infection and
children [3], are confounded by difficulty obtaining sputum from children and are worsened
by the inadequacy of laboratory tests. Sensitive liquid culture is generally costly, while tradi-tional solid culture methods are slower and less sensitive. Even with optimal resources, labora-tory confirmation of presumed pediatric TB diagnoses is achieved in only a minority of cases
[4–7]. Consequently, clinicians usually rely on their clinical impression and/or clinical scoring
systems that are poorly validated [8–10]. We still depend heavily on tools that have been
avail-able and inadequate for more than a century to presumptively diagnose TB disease in children:
tuberculin skin test, chest x-ray, history and physical examination [11].
While TB diagnosis in adults co-infected with HIV has been widely studied, optimal ap-proaches, specimens and tests are less well characterized in pediatric patients and are under-mined by the lack of a gold standard for determining which children have TB. Patient series from South Africa reported HIV co-infection in 32% of children with culture-confirmed TB
[12] and similar culture positivity of induced sputum specimens in HIV-positive and
HIV-neg-ative children [13]. However, other data suggest that diagnostic yields in pediatric patients with
suspected pulmonary TB were lower in HIV-infected than HIV-negative children [14–15] and
TB Diagnostics in Children with and without HIV Co-Infection
PLOS ONE | DOI:10.1371/journal.pone.0120915 April 30, 2015 2 / 17
(Wellcome Trust/MRC/DFID); The Wellcome Trust; and Imperial College Biomedical Research Centre. NAMRU-6 work was supported by Work Unit Number 62787 S17 H B0002. The funders had no role in study design, data collection and analysis, decision to publish, or preparation of the manuscript.
most studies have focused on high-burden countries in southern Africa. The epidemiology of TB and HIV are very different in Latin America versus southern Africa, with markedly lower
overall HIV seroprevalence among new cases (for example,<5% in Peru versus>50% in
southern Africa).
In children, especially those living with HIV-infection, even a low percentage of false-posi-tive laboratory results may disproportionately affect test interpretation because they may have comparable frequency to true-positives. This has been the subject of little research and few evaluations of pediatric TB diagnosis included control children who do not have suspected TB. Previous studies evaluating pediatric TB diagnostic approaches, specimens and tests have usu-ally assumed that any positive laboratory result confirms TB and there is a lack of knowledge concerning false-positivity rates and how these may be affected by HIV co-infection.
Recently the disposable cartridge-based GeneXpert MTB/RIF commercial assay has been approved for TB diagnosis with subsidized pricing available to selected health-care providers in selected countries. However, in most resource-constrained settings subsidies are unavailable and costs per test are typically $60-$100. This is too expensive for widespread use in these set-tings because TB principally affects socioeconomically disadvantaged groups. In contrast, costs
per test for in-house PCR TB diagnostic assays are<$5 per specimen and this affordability
may in some settings balance the procedural and logistical challenges of using in-house PCR
assays [16–17].
We have published a study of diagnostic approaches for TB in HIV-negative Peruvian chil-dren with suspected pulmonary TB and well-controls that defined the microbiological contri-bution of specimens and tests, including a low-cost in-house polymerase chain reaction (PCR)
technique [18]. In this current report we assess the performance of these laboratory tests in
concurrently tested HIV-infected children, and demonstrate the contrast with previously pub-lished results for HIV-negative children.
Materials and Methods
Ethics statement
Participants were enrolled by written parental informed consent and for children7 years
ad-ditional written child participant assent. The project was approved by the institutional review boards of Tulane Medical Center, Johns Hopkins Bloomberg School of Public Health, Asocia-ción Benéfica PRISMA, the US Naval Medical Research Center (Bethesda, MD), Hospital Nacional Cayetano Heredia, and the Instituto Nacional de Salud del Niño of Lima, Peru. Em-piric treatment for TB was administered according to World Health Organization and Peru-vian Ministry of Health guidelines. Therapeutic decisions including hospitalization and treatment were determined by local physicians who were independent from this study.
HIV-positive cases and well-controlsare reported here for the first time compared with
new analysis of our previously reported data for HIV-negative participants [18]. Eleven
itali-cized data points for HIV-negative participants inTable 1and four data points inTable 2are
repeated from our previous publication [18] for comparison; all other data and analyses are
unique to this manuscript.
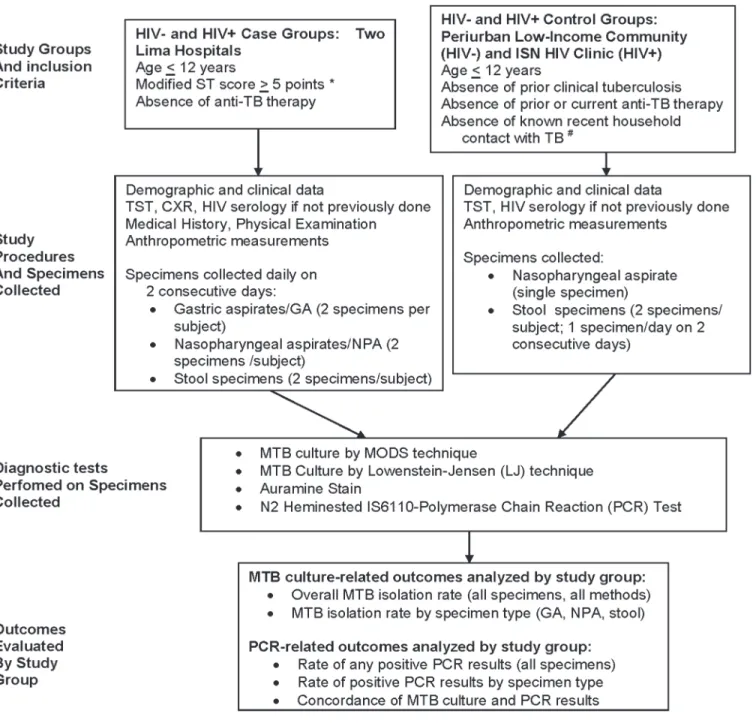
Study design is shown inFig 1.Recruitmenttook place continuously 2002–2007 and all
participants were age<13 years.
Participant classificationused the criteria of Stegen and Jones [19] (“Jones Score”in
Af-rica) for pediatric TB diagnosis as revised by Toledo. This“Stegen-Toledo”(ST) score is used
throughout Latin America [20] and is graded as the sum of: 2 points for known tuberculosis
contact in the last 2 years; 2 points for x-ray suggestive of tuberculosis; 2 points for cough for
Table 1. Study population demographic and clinical features. 116 HIV-positive children 409 HIV-negative children P-value for HIV-negative vs HIV-positive children
81 TB cases with ST>3
35 well-controls P-value for cases vs well-controls 209 TB cases with ST>4
200 well-controls
P-value for cases vs well-controls
290 cases
235 well-controls
Years old Median 3 5 3 4 0.08 0.08 0.3
IQR 1–6 3–7 1–7 2–7
Gender % male 49 57 0.4 50 54 0.5 0.9 0.7
95%CI 38–61 39–74 43–57 47–61
Weight-for-age Median 74 89 <0.001 96 94 NS <0.001 0.01
IQR 65–88 80–95 86–106 87–103
Low income % 76 67 0.4 47 78 <0.001 <0.001 0.2
95%CI 64–86 45–84 40–54 71–83
Cough % 96 5.7 <0.001 75 27 <0.001 <0.001 0.006
95%CI 92–100 0–13 69–81 21–33
Highly probable TB (ST score>6)
% 21 0 <0.001 71 0 <0.001 <0.001 ND
95%CI 12–30 0–9.9 65–77 0–1.8
Hemoptysis % 6.2 0 <0.001 3.4 1.0 0.1 0.3 0.6
95%CI 1.0–11 0–9.9 1.0–5.8 0–2.4
Fever % 54 5.7 <0.001 28 15 0.0007 <0.001 0.2
95%CI 43–65 0–13 22–34 9.6–19
Anorexia % 40 2.9 <0.001 40 23 0.0002 0.9 0.007
95%CI 30–51 0–8.4 33–46 17–28
Recent weight loss % 43 2.9 <0.001 28 11 <0.001 0.016 0.1
95%CI 32–54 0–8.4 22–34 6.5–15
Diarrhea % 44 11 0.0008 13 17 0.3 <0.001 0.4
95%CI 33–55 0.89–22 8.8–18 12–22
Vomiting % 26 2.9 0.004 13 6.5 0.03 0.008 0.4
95%CI 16–35 0–8.4 8.4–17 3.1–9.9
CD4 count % 365 660 0.01 ND ND ND NA NA
95%CI 133–749 130–1012 ND ND
Abnormal chest x-ray*+ % 99 ND ND 83 ND ND <0.001 ND
95%CI 96–100 ND 77–88 ND
Alveolar infiltrate + % 23 ND ND 5.2 ND ND <0.001 ND
95%CI 13–32 ND 1.9–8.5 ND
Interstitial infiltrate + % 84 ND ND 54 ND ND <0.001 ND
95%CI 76–92 ND 47–62 ND
Nodular infiltrate + % 6.7 ND ND 4.1 ND ND 0.2 ND
95%CI 1.0–12 ND 1.1–7.0 ND
Calcification + % 0.0 ND ND 1.1 ND ND 0.3 ND
95%CI 0–4.6 ND 0.1–4.0 ND
Pleural thickening + % 1.3 ND ND 3.3 ND ND 0.3 ND
95%CI 0.3–6.9 ND 1.2–7.1 ND
Cavity/cavities + % 0 ND ND 1.7 ND ND 0.3 ND
95%CI 0–4.6 ND 0.3–4.8 ND
Lymphadenopathy + % 3.8 ND ND 7.2 ND ND 0.3 ND
95%CI 0.8–11 ND 3.4–11 ND
Hilar swelling + % 34 ND ND 44 ND ND 0.2 ND
95%CI 24–46 ND 36–51 ND
(Continued) TB Diagnostics in Children with and without HIV Co-Infection
points for positive tuberculin skin test (5 mm induration in HIV-positive children;10 mm for HIV-negative children as was local practice). Usually the Stegen-Toledo score also includes 7 points for a positive tuberculosis culture, but this was excluded because culture results were a primary outcome of our study and were not available at the time of enrollment. The Stegen-To-ledo score is interpreted as: unlikely tuberculosis (0 or 2 points); suspicious for tuberculosis (4
points); probable tuberculosis (6 points); or highly probable tuberculosis (>6 points).
Participantswere:
-“cases”with clinical evidence suggestive of pulmonary TB at the Instituto de Salud del Niño and the Hospital Nacional Cayetano Heredia; and
-“well-controls”who were asymptomatic and enrolled concurrently from households in a
low-income shantytown, all in Lima, Peru as described [18].
Inclusion criteria for caseswere based on the Stegen-Toledo score. Because there is no gold standard for pediatric TB diagnosis, we defined cases as children with suspected TB, i.e. a
Ste-gen-Toledo score>4 (i.e. probable or highly-probable TB). HIV-positive cases with
Stegen-To-ledo score>3 (i.e. also including score = 4 indicating suspicious for TB) were included as cases
for the primary analysis because HIV co-infected children are usually treated empirically if the clinical suspicion of TB disease is lower than for HIV-negative children. A supplementary anal-ysis considered the same inclusion criteria for HIV-negative and HIV-positive cases i.e. only
cases with Stegen-Toledo score>4.
Inclusion criteria for well-controlswere 1) absence of cough, fever, or evidence of pulmo-nary disease at the time of enrollment; and 2) no prior diagnosis of TB disease. We aimed to re-cruit only well-control children who were each age and sex matched to cases and had no known or suspected household contact with pulmonary TB in the past 2 years. These criteria could not be applied perfectly for HIV-positive well-controls because HIV-infection is uncom-mon in Peru, which impeded recruitment.
Screening for HIV infectionby duplicate commercial antibody assays was requested for all
participants. Children<18 months old also had HIV PCR. Participants who declined HIV
Table 1. (Continued)
116 HIV-positive children
409 HIV-negative children
P-value for HIV-negative vs
HIV-positive children
81 TB cases with ST>3
35
well-controls
P-value for cases vs well-controls
209 TB cases with ST>4
200 well-controls
P-value for cases vs well-controls
290 cases
235 well-controls
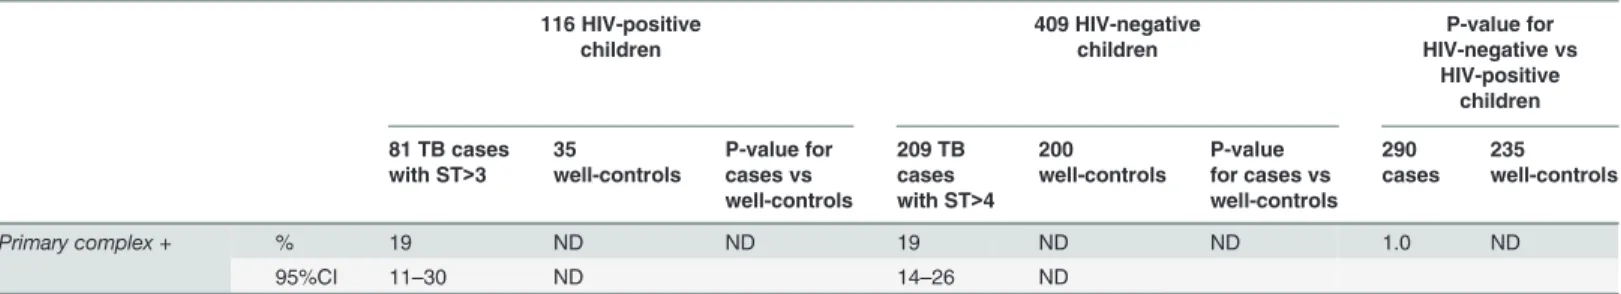
Primary complex + % 19 ND ND 19 ND ND 1.0 ND
95%CI 11–30 ND 14–26 ND
+ All cases had x-rays that defined their ST score. Detailed research x-ray scoring was only available for 93% (75/81) HIV-positive cases and 83% (173/ 209) HIV-negative cases (seeResults).
*no participants had miliary or bullous chest x-rayfindings so thesefindings are not listed in the table
Note: ND = not done because controls did not have these symptoms and did not have chest x-rays; NS = not significant (P>0.05); NA = not applicable as data was not collected; TB = tuberculosis; ST = the Stegen-Toledo score assessing the likelihood of TB disease (seeMethods); low income = below the monthly minimum wage in Peru that was 400 Soles (approximately $115 USD monthly) at the time of the study; weight-for-age was based on Centers for Diseases Control growth standards.
Table 2. PCR and culture results. Test Positive specimens 116 HIV-positive children 409 HIV-negative children HIV-negative vs HIV-positive
Children 81 TB cases
with ST>3 6 specimens per child
35 well controls with 3 specimens per child
TB cases vs well-controls
209 TB cases with ST>4 6 specimens per child
200 well controls with 3 specimens per child
TB cases vs well-controls
290 TB cases 235 well controls
% 95%CI n N % 95%CI n N P-value % 95%CI n N % 95% CI n N P-value P-value P-value
PCR Any 22% 13–31 18 81 17% 4.7–30 6 35 NA 26% 20–32 54 209 5.5% 2.3–8.7 11 200 NA 0.5 0.01
Microscopy & culture
Any 1.2% 0.0–3.6 1 81 0.0% 0.0–9.9 0 35 NA 11% 6.3–15 22 209 0.0% 0.0–1.9 0 200 NA 0.01 1.0
P-value PCR vs microscopy & culture
<0.0001 0.01 NA <0.0001 0.0008 NA NA NA
Specimens PCR NPA 4.9% 8 162 8.6% 0.0–18 3 35 0.4 7.0% 4.5–9.4 29 415 2.0% .05–3.9 4 201 0.01 0.4 0.03
GA 4.3% 1.2–7.5 7 162 ND ND ND ND ND 9.9% 7.0–13 41 416 ND ND ND ND NA 0.03 NA
Stool 7.6% 3.5–12 12 157 5.8% .28–11 4 69 0.6 4.7% 2.6–6.7 19 407 1.8% .47–3.1 7 398 0.02 0.2 0.04
NPA+GA+ Stool 5.6% 3.6–7.8 27 481 6.7% 1.9–12 7 104 0.7 7.2% 5.8–8.6 89 1238 1.8% .76–2.9 11 599 <0.001 0.2 0.003
Microscopy & culture
NPA 0.0% 0.0–2.3 0 162 0.0% 0.0–9.9 0 35 1.0 4.8% 2.8–6.9 20 414 0.0% 0.0–1.9 0 201 <0.001 0.004 1.0
GA 1.2% 0.0–2.9 2 162 ND ND ND ND ND 8.0% 5.3–11 33 415 ND ND ND ND NA 0.002 NA
Stool 0.0% 0.0–2.4 0 157 0.0% 0.0–5.3 0 69 1.0 1.2% .16–2.3 5 406 0.0% 0.0–1.0 0 399 0.03 0.2 1.0
NPA+GA+ Stool 0.42% 0.0–1.0 2 481 0.0% 0.0–3.6 0 104 0.5 4.7% 3.5–5.9 58 1235 0.0% 0.0–0.64 0 600 <0.001 <0.001 1.0 P-value PCR vs
microscopy & culture
<0.001 0.01 NA 0.01 0.001 NA NA NA
The percentage and number of children and specimens from children with at least one positive PCR or culture.
The Stegen-Toledo cut-off for inclusion in this analysis differed between HIV-positive and HIV-negative children (seeMethods).
Note: TB = tuberculosis; NPA = nasopharyngeal aspirate; GA = gastric aspirate; NA = not applicable; ND = not done; ST = the Stegen-Toledo score assessing the likelihood of TB disease (seeMethods).
testing and had no known HIV exposure or clinical evidence of HIV/AIDS were included and
classified as HIV-negative because in Lima HIV infects<0.5% adults and<0.1% children aged
<12 years.
Fig 1. Study flow chart.
Demographic datawere collected from all participants. Cases had medical history, physical examination and a chest x-ray read by a research pediatric radiologist who used a standardized reading scale and who was blinded to all clinical data. Presence of symptoms during the 15 days prior to enrollment were recorded.
Specimenswere all collected before any anti-TB therapy and we aimed to collect 1 specimen of each type per day. All specimens were collected within 5 days of enrollment.
Specimens from caseswere 2 of each of the following specimens: stool specimens; nasopha-ryngeal aspirates (NPA) collected by inserting a soft flexible nasophanasopha-ryngeal tube into the naso-pharynx, lavaging with 5 ml sterile physiological saline solution, and aspirating with an electrical suction device or hand-held aspirator; and gastric aspirates collected early mornings
(6–7 am) following an overnight fast by brief (<10 minute) nasogastric intubation (if
aspira-tion was unsuccessful then gastric lavage was done but the frequency of this was not recorded). Specimens from well-controlswere 2 stool specimens and 1 nasopharyngeal aspirate. The gastric aspirates and repeat nasopharyngeal aspirates were omitted to increase acceptability.
Laboratory tests
All specimens were transported to the laboratory the same day as collection at 4°C without
buffering or neutralization. Specimens were processed as described [18] by sodium hydroxide
centrifuge decontamination followed by:
1. Auramine smear microscopy stain (smear test);
2. Lowenstein-Jensen solid culture [21–22];
3. Microscopic-observation drug-susceptibility (MODS) culture that in order to maximize di-agnostic sensitivity was performed without using any of the didi-agnostic specimens for
con-current drug-susceptibility testing, as described previously [18,21,22]; and
4. hemi-nested IS6110-PCR procedure (“PCR”) [16,18] that used standard precautions to
pre-vent PCR products from contaminating specimens including separate restricted access rooms for specimen processing versus manipulation of PCR products. All PCR assays in-cluded positive and negative PCR controls that in all cases gave appropriate positive and negative results, respectively.
Analysis
Chi-square and McNemar’s tests were used for categorical variables and two-tailed T-test or
Wilcoxon rank sum test for continuous variables. Confidence intervals, numerators and de-nominators for key outcomes are stated in the text only when they are not presented in the ta-bles and/or figures. Participants with any culture-positive specimen by any test were classified as culture-positive. To reduce the risk of failed contaminated cultures being misinterpreted, culture-negative cases were only included in the analysis if all specimens had at least 1 inter-pretable, un-contaminated Lowenstein-Jensen and MODS result. Participants with at least one PCR-positive specimen were classified as PCR-positive. Analysis was performed using STATA Version 11 (STATA Corp., College Station, TX) and EpiInfo (Version 6, Centers for Disease Control and Prevention; Atlanta, GA, USA) software and all data are calculated to 2 significant figures. The dataset for this study is included as supplemental information along with a legend
defining specific variables (S1 Dataset). All laboratory techniques were performed by qualified
biologists who were trained, supervised, used written standard operating procedures with inter-nal quality control and were blinded to the results of all other tests, including HIV-status.
TB Diagnostics in Children with and without HIV Co-Infection
Results
Participantsconstituted 525 children in 4 groups with sufficient data to meet our protocol
cri-teria for inclusion in the analysis [18]:
209 HIV-negative cases;
81 HIV-positive cases;
200 HIV-negative well-controls; and
35 HIV-positive well-controls.
Non-participants excluded from the analysis(n = 54) were the following children enrolled in the study: 9 HIV-negative cases; 4 HIV-positive cases; 31 HIV-negative well-controls; and 10 HIV-positive well-controls. These exclusions were caused by: parents refusing study proce-dures (n = 12); loss to follow-up (n = 14); and missing data (n = 28).
Participant characteristicsare shown inTable 1. The patient groups had similar character-istics except: HIV-positive well-controls were older; HIV-positive cases had lower weight-for-age; and fewer HIV-negative cases had low income than other groups. As expected, symptoms of illness reported during the last 15 days were more common in cases than in controls.
HIV-positive subjects received co-trimoxazole, but antiretroviral therapy for children did
not begin to become available until a year after recruitment ended. Mean CD4 count of the 66 HIV-positive TB cases with this information (365) was significantly lower than the mean value for the 27 HIV-positive controls with CD4 data (660; P = 0.01). No HIV-positivity was newly diagnosed by this study and 82% of HIV-negative statuses were laboratory confirmed.
X-rays (
Table 1
)
All cases had x-rays that defined their Stegen-Toledo score. Detailed research x-ray scoring
data are shown inTable 1and were only available for 93% (75/81) HIV-positive cases and 83%
(173/209) HIV-negative cases.
Stegen-Toledo scoreswere lower for HIV-positive cases versus HIV-negative cases whether HIV-positive children with Stegen-Toledo score 4 (suspicions for TB) were included (in the primary analysis) or excluded (for the secondary analysis that used the same Stegen-Toledo
in-clusion criteria for HIV-positive as HIV-negative cases;Fig 2; both comparisons P<0.001).
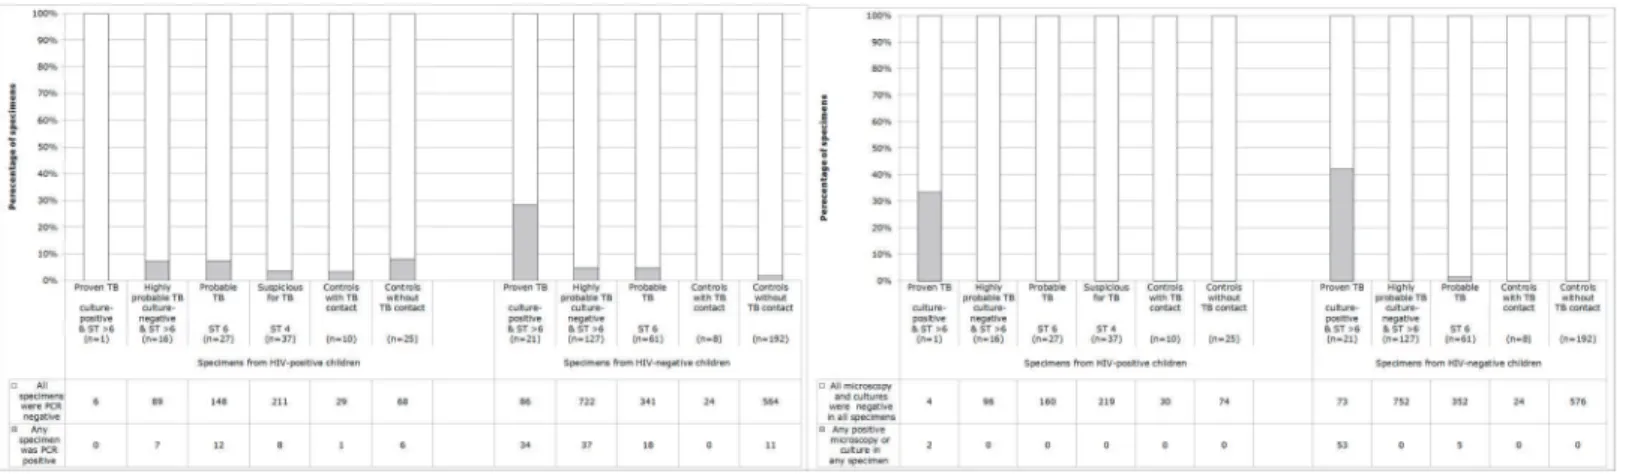
Fig 2. Tuberculosis (TB) test results for specimens from HIV-positive and HIV-negative case and well-control children.Data are analysed by assessment of probability of TB disease indicated by the Stegen-Toledo (ST) clinical score (seeMethods). (A) TB PCR results. (B) Microscopy and culture test results: auramine microscopy, microscopic-observation drug-susceptibility (MODS) liquid culture, and Lowenstein Jensen solid culture.
Similarly, several symptoms were more frequent in HIV-positive cases than HIV-negative
(cough, fever, weight loss, diarrhea, vomiting,Table 1).
Test resultsinTable 2do not compare case children versus well-control children because this would be invalid because cases each had 6 specimens tested (including 2 gastric aspirates that yielded most positives), whereas controls each had only 3 specimens tested (without gas-tric aspirates).
False-positive PCR (
Table 2
)
18 specimens from well-controls were PCR positive, causing 17 well-controls to be PCR posi-tive. No follow-up to determine clinical diagnoses, treatment, or treatment outcome were in-cluded in our research protocol because these would be influenced by the test results that were being assessed by this study. However, for ethical reasons only these 17 PCR-positive well-con-trols were followed up at least 3 monthly for 1 year including at least 1 chest x-ray during this follow-up that was 100% completed in all cases and revealed no evidence of TB disease. PCR-positivity in well-controls tended to be more common in specimens from well-controls without
household TB contact than with TB contact (Fig 2). Because this PCR-positivity in
well-con-trols was not associated with subsequent TB disease or prior TB exposure, these PCR-positive results in well-controls are henceforth termed false-positives. False-positive PCR occurred
sim-ilarly frequently in all specimen types (Table 2) and were dispersed chronologically and had
similar frequency early and late in the project (data not shown).
PCR specificity (Table 2)per specimen in well-controls was 93% (95%CI 88–98, 97/104)
for specimens from HIV-positive participants, lower than 98% (95%CI 97–99, 588/599) for
specimens from HIV-negative participants (because false-positive PCR were more frequent in 6.7% specimens from well-controls who were HIV-positive versus 1.8% HIV-negatives,
P = 0.0003). Consequently, PCR specificity per well-control child was 83% (95%CI 70–95, 29/
35) for HIV-positive participants, less than 95% (95%CI 91–98, 189/200) for HIV-negative
children (because well-controls were more often PCR false-positive in 17% HIV-positives ver-sus 5.5% HIV-negatives, P = 0.01).
PCR sensitivity (Fig 2)in culture-proven TB was 0.0% in HIV-positive children (because PCR were false-negative for all 6/6 specimens from culture-proven HIV-positive cases) and
28% (95%CI 20–36, 34/120, P = 0.1) in HIV-negative children (because 86/120 specimens
from culture-proven HIV-negative cases were false-negative). Thus overall PCR sensitivity in
all culture-proven TB was 27% (95%CI 19–36% because 92/126 specimens from children with
culture-proven TB were PCR false-negative). Cases without culture-proven TB cannot be used to assess PCR sensitivity because it is unknown how many had TB disease versus alternative diagnoses.
PCR yield (
Table 2
)
6.7% (95%CI 5.6–8.0, 116/1719) specimens from cases were PCR-positive causing 25% (95%CI
5.6–8.0, 72/290) cases to be PCR-positive. PCR-positivity was similarly frequent (P = 0.2) for
5.6% specimens from HIV-positive cases versus 7.2% HIV-negatives. Consequently, PCR-posi-tivity was similarly frequent (P = 0.5) for 22% HIV-positive cases versus 26% HIV-negatives.
PCR utility
Specimens from HIV-positive participants were more likely to be PCR-positive in 6.7%
well-controls than: 5.6% cases; and 0.0% cases with culture-proven TB (both P>0.5). Thus, this
in-house PCR did not have clinical utility for TB diagnosis in HIV-positive children. Specimens
from HIV-negative participants were 4.0-times more likely (P<0.001) to be PCR-positive in
TB Diagnostics in Children with and without HIV Co-Infection
7.2% cases than 1.8% well-controls, so these results may have had some clinical utility in
HIV-negative children in this study [18].18
Microscopy and culture specificity (Table 2)was 100% because all results were negative for 2112 tests in 704 specimens from 235 well-controls.
Microscopy sensitivity (Fig 2)in culture-proven TB was 0.0% in HIV-positive children (be-cause microscopy was false-negative in all 6/6 specimens from culture-proven HIV-positive
cases) and 4.0% (95%CI 0.56–7.4, 5/126, P = 0.6) in HIV-negative children (because 121/126
specimens from culture-proven HIV-negative cases were microscopy false-negative). Thus
overall microscopy sensitivity in all culture-proven TB was 4% (95%CI 1.2–8.6, because 121/
132 specimens from children with culture-proven TB were microscopy false-negative).
Microscopy utility
All microscopy-positive specimens were culture-positive so microscopy contributed no
addi-tional diagnoses. Microscopy-positivity was rare, occurring in only 0.21%, (95%CI 0.067–0.5,
5/2422) of specimens. However, microscopy is a low-cost test that provides same-day results and is considered an integrated part of culture-testing protocols in many laboratories so had some utility in this study.
Microscopy and culture sensitivity (Fig 2)in culture-positive participants was 42%
(be-cause 58% (95%CI 49–67, 73/126) specimens from culture-proven TB cases were microscopy
and culture false-negative). None of the culture-positive cases had multi-drug resistant TB.
Mi-croscopy and culture sensitivity was 33% (95%CI 0.0–71, 2/6) in HIV-positive culture-positive
participants and 42% (95%CI 33–51, 53/126, p = 0.7) in HIV-negatives. Cases without
culture-proven TB cannot be used to assess sensitivity because it is unknown how many had TB disease versus alternative diagnoses.
Microscopy and culture yield (
Table 2
)
Microscopy or culture were positive in 0.42% (2/481) specimens from HIV-positive cases, less
(p<0.0001) than 4.7% specimens from HIV-negative cases. Specifically, 1 HIV-positive case
with Stegen-Toledo score>6 (indicating highly-probable TB) had positive cultures only with
the MODS assay for both gastric aspirates. Consequently, cases were less likely (p = 0.009) to be microscopy or culture-positive if they were HIV-positive (1.2%, 1/81) than HIV-negative (11%, 22/209).
Test speed
We have reported culture speed previously [18]. PCR and microscopy results were available
within 24 hours whereas culture took at least 5 days. Negative culture results were issued after 30 days for MODS and 42 days for Lowenstein-Jensen.
PCR versus culture results (Tables
2
and
3
)
Specimens were more likely to be PCR-positive than culture-positive for all 4 participant
groups (all P0.01).
Microscopy and culture test efficiency (
Fig 3
)
Microscopy detected 22% (95%CI 7.4–44, 5/23) of culture-proven TB. Lowenstein-Jensen
cul-ture detected 52% (95%CI 31–73, 12/23) of TB diagnoses. MODS (without Lowenstein-Jensen)
detected 91% (95%CI 72–99, 21/23) culture–proven TB, but MODS together with
Lowenstein-Jensen culture had to be done to detect 100% (23/23) culture-proven TB.
Specimen efficiency (
Fig 3
)
Considering all microscopy and culture-positive participants, 100% (23/23) had at least one culture-positive gastric aspirate, whereas microscopy and culture testing of nasopharyngeal
as-pirates confirmed 52% (95%CI 31–73, 12/23) and stool specimens confirmed 17% (95%CI 5.0–
39, 4/23) of culture-positive cases without contributing any additional TB diagnoses. Testing only the first gastric aspirate specimen (instead of duplicate gastric aspirates) would have
caused 48% (95%CI 27–69, 11/23) of the culture-positive cases to be missed.
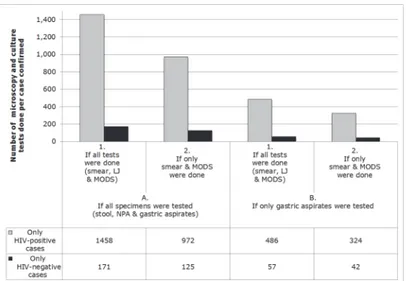
Number of tests needed per TB diagnosis (
Fig 4
)
1458 microscopy and culture tests were done to detect each HIV-positive culture-positive case, whereas 171 microscopy and culture tests were done to detect each HIV-negative culture-posi-tive case. If gastric aspirates had been the only specimen tested then all of the culture-posiculture-posi-tive cases would still have been detected and the number of microscopy and culture tests done to detect each culture-positive HIV-positive case would have been 486, whereas 57 would have been done to detect each HIV-negative case.
Table 3. PCR and culture results.
Test Positive
specimens
44 HIV-positive cases with ST>4
44 HIV-positive cases vs 35 HIV-positive well-controls
44 HIV-positive cases vs 209 HIV-negative cases
Children % 95%CI n N P-value P-value
PCR Any 30% 13–31 13 44 NA 0.5
Microscopy & culture Any 2.3% 0.0–3.6 1 44 NA 0.01
P-value PCR vs microscopy & culture <0.0001 NA NA
Specimens PCR NPA 8.0% 3.3–16 7 88 0.9 0.7
GA 8.0% 3.3–16 7 88 ND 0.6
Stool 5.8% 1.9–13 5 86 1.0 0.7
NPA+GA+Stool 7.3% 4.4–11 19 262 0.9 1.0
Microscopy & culture NPA 0.0% 0.0–4.2 0 88 1.0 0.004
GA 2.3% 0.0–2.9 2 88 ND 0.002
Stool 0.0% 0.0–4.3 0 86 1.0 0.2
NPA+GA+Stool 0.76% 0.0–1.0 2 262 0.5 <0.001
P-value PCR vs microscopy & culture <0.001 NA NA
The percentage and number of children and specimens from children with at least one positive PCR or culture.
The Stegen-Toledo cut-off for inclusion in this analysis was identical for HIV-positive and HIV-negative children (seeMethods).
Note: TB = tuberculosis; NPA = nasopharyngeal aspirate; GA = gastric aspirate; NA = not applicable; ND = not done; ST = the Stegen-Toledo score assessing the likelihood of TB disease (seeMethods).
doi:10.1371/journal.pone.0120915.t003
TB Diagnostics in Children with and without HIV Co-Infection
Discussion
These data demonstrate the challenges of diagnosing TB in HIV-positive children and the ad-vantages and disadad-vantages of diverse strategies, specimens and tests. Laboratory results from children with culture-proven and clinically suspected TB, were compared to results from well-controls, strengthening the study by providing novel insights to the overall performance of these tests within the HIV-infected population, which is lacking from most previous studies of pediatric TB diagnosis.
Although TB diagnosis by same-day PCR testing seemed desirable, most culture-positive cases and specimens had false-negative PCR. Furthermore, PCR in well-controls was prone to
false-positives, as in previous studies [16,17]. Consequently, PCR-positives were slightly more
likely in well-controls then suspected TB cases. Thus in HIV-positive children with suspected TB in this setting, the in-house PCR did not provide clinically relevant results and cannot be recommended.
The recently implemented GeneXpert MTB/RIF commercial TB PCR test uses disposable
cartridges that may reduce the risk of cross-contamination causing false-positives [23,24].
However, a GeneXpert meta-analysis reported a pooled specificity of 98% (95%CI 97–99%),
similar to the in-house PCR specificity of 97.4% (95%CI 96.3–98.6) that we observed, although
specificity estimates are difficult to compare between studies with different inclusion criteria; positives may reflect TB disease that was missed by other tests. These findings emphasize the importance of false-positive PCR results, the need to include control participants when evaluat-ing diagnostic tests and demonstrates that even rare false-positives may out-number
true-Fig 3. Tuberculosis (TB) microscopy and culture test results for specimens from the 23 cases with culture-positive TB.All subjects had two specimens of each type analyzed for TB by the methods shown. The graph shows the proportion (and the data table the number) of patients who had positive results in (A.) at least one of their two specimens and (B.) who had positive results in the first specimen of their two specimens, with separate bars indicating results for stool, nasopharyngeal aspirate (NPA) or gastric aspirate specimens tested only by auramine microscopy (smear), Lowenstein-Jensen (LJ) solid culture, or microscopic-observation drug-susceptibility (MODS) liquid culture [e.g. the first bar demonstrates that all 23 cases would have been diagnosed if only (1.) LJ and MODS culture had been performed (i.e. without microscopy) on (A.) duplicate gastric aspirate specimens].
positives in pediatric TB diagnosis because of the low diagnostic yield of TB diagnostic tests in children.
The inadequacy of these PCR results only became apparent because well-controls were in-cluded in similar numbers to cases, in contrast to many previous studies of pediatric TB diag-nostics. Recent guidelines emphasized the importance of well-controls in early assessment of new diagnostics and our findings here suggest they may also be important for late, clinical as-sessment of pediatric TB diagnosis because it is difficult to determine which symptomatic
chil-dren have TB disease [25]. We noted a significantly higher false-positive PCR rate in
HIV-positive than HIV-negative controls and this association should be studied in future research.
Although the low prevalence of HIV infection in Peru [26] necessitated recruitment of some
controls who had recent TB contact, this did not explain these false-positive PCR that occurred significantly more frequently in controls who had no known TB contact. All PCR-positive well-controls were followed up for at least 1 year and all remained free from clinically apparent TB, implying that these false-positive PCR results were not explained by early or sub-clinical TB.
PCR sensitivity was difficult to assess because false-positives were more common than
true-positives. However in HIV-positive cases,>92% of specimens were PCR-negative from
chil-dren with culture-positive TB, highly probable and probable TB. Similarly, frequent PCR false-negative results in culture-confirmed pediatric TB were reported in previous research assessing
GeneXpert testing of induced sputa in South Africa [27] and in high-risk children in our
previ-ous research in Peru [16]. Thus, some culture-positive cases are missed using molecular
meth-ods, probably as a result of the paucibacillary nature of pediatric TB [16,23]. In contrast to
some reports from Africa, we found that TB recovery from HIV-positive patients with sus-pected pulmonary TB in this Peruvian population was much less common than in HIV-nega-tive cases. Indicators of pulmonary TB used to calculate clinical scores may be less specific for TB among HIV-infected children. This implies that many HIV-infected participants may have
Fig 4. The number of tuberculosis (TB) microscopy and culture tests done for each case confirmed. A. All cases had duplicate stool, nasopharyngeal aspirate (NPA) and gastric aspirate specimens tested for tuberculosis (TB) by auramine microscopy (smear), Lowenstein-Jensen (LJ) solid culture, and microscopic-observation drug-susceptibility (MODS) liquid culture [e.g. the left-most gray bar indicates that in this study 1458 tests (1. smear, LJ and MODS) were done (on A. stool, NPA and gastric aspirates) per HIV-positive case diagnosed; whereas the right-most black bar indicates that in this study if only (2.) smear and MODS testing had been done on only (B.) duplicate gastric aspirates then 42 tests would have been done per HIV-negative case diagnosed].
doi:10.1371/journal.pone.0120915.g004
TB Diagnostics in Children with and without HIV Co-Infection
had other pulmonary infections instead of TB. Including a third gastric aspirate specimen and possibly induced sputa in addition to gastric aspirates may increase diagnostic yield in future
work [13,27].
In contrast to the poor specificity of PCR, microscopy and culture testing were reliable
be-cause there were no false-positive results amongst>2000 tests performed blindly and
concur-rently on specimens from well-controls. This validates the reliability of these tests including the MODS assay, and contrasts with reports of false-positive microscopy and culture test results in
some settings [28,29]. The absence of false-positive microscopy and culture tests in the present
study may be partly explained by the infrequent rate of culture-positivity in specimens from cases processed concurrently with the specimens from well-controls.
In HIV-positive children with suspected TB, diagnostic yield was so low that 1458 micros-copy and culture tests were done per case confirmed. We identified combined same-day mi-croscopy plus MODS testing (that took 30 days) of duplicate gastric aspirate specimens as the most efficient pediatric TB testing strategy, but even this approach required 324 microscopy and culture tests to confirm each HIV-positive case, which is unlikely to be cost-effective in most settings. Even in specimens from children with culture-positive TB, most specimens were negative by all tests. Thus, negative microscopy and culture tests could not rule out TB. Almost half of microscopy and culture test-positive results were missed by the first specimen and oc-curred only in second specimens. Nasopharyngeal aspirates and stool specimens did not con-tribute any additional diagnoses to those found by testing gastric aspirates. In most resource-constrained settings the only TB laboratory tests available are acid-fast microscopy and in some settings culture on egg-based medium that only detected approximately half of the cases detected by the MODS assay.
Limitations inherent to most studies of pediatric TB diagnosis include the lack of a gold standard test and reliance on well-controls because it would be difficult to be sure whether symptomatic controls had versus did not have TB. Without a sensitive gold standard test, some subjects with negative microscopy and culture tests and positive PCR may have pulmonary TB. Data concerning treatment given, response and outcome were not included in this study be-cause they would have been influenced by the results of the tests under evaluation. Specific lim-itations to the present study include the imperfect age and sex matching and limited numbers of HIV-positive well controls that resulted from HIV infection being infrequent in the study
population [26], the use of clinical definitions that we developed prior to recent
recommenda-tions for standardization [25], and the fact that we did not study alternate diagnoses that may
have been made by clinical practitioners.
Supporting Information
S1 Dataset. The dataset for this study is included as supplemental information along with a legend defining specific variables.
(XLSX)
Acknowledgments
In memoriam Luz Caviedes, who led the laboratory aspects of this research project with great enthusiasm, skill and dedication. We thank Dr. David A. J. Moore for his advice and encour-agement, and we thank the participants, their families and the personnel of the regional and national health systems in Peru for supporting this research.
Disclaimer:The views expressed in this article are those of the authors and do not necessar-ily reflect the official policy or position of the Department of the Navy, Department of Defense, nor the U.S. Government.
Copyright Statement:V. Alberto Laguna-Torres and Giselle Soto-Castellares are employees of the U.S. Government. This work was prepared as part of their official duties. Title 17 U.S.C.
§ 105 provides that‘Copyright protection under this title is not available for any work of the
United States Government’. Title 17 U.S.C. § 101
Author Contributions
Conceived and designed the experiments: RAO GSC RHG MEC LK TD MS ESL EN SM VALT PMN. Performed the experiments: RAO GSC RHG MEC LK TD MS ESL EN SM VALT PMN CAE. Analyzed the data: RAO GSC RHG MEC LK TD MS ESL EN SM VALT PMN CAE SD. Contributed reagents/materials/analysis tools: RAO GSC RHG MEC LK TD MS ESL EN SM VALT PMN CAE. Wrote the paper: RAO GSC RHG MEC LK TD MS ESL EN SM VALT PMN CAE SD.
References
1. Perkins MD, Cunningham J (2007) Facing the crisis: improving the diagnosis of tuberculosis in the HIV era. J Infect Dis Aug 15; 196 Suppl 1:S15–27. Review. PMID:17624822.
2. Harries A, Maher D, Graham S (2004) TB/HIV A Clinical Manual. Stop TB Department. Geneva: World Health Organization.
3. Kelynack TN (1908) Tuberculosis in Infancy and Children. New York: William Wood and Co.;pp. 80– 85.
4. Abadco D, Steiner P (1992) Gastric lavage is better than broncho-alveolar lavage for isolation of Myco-bacterium tuberculosis in childhood pulmonary tuberculosis. Pediatr Infect Dis J 11:735. PMID:
1448314
5. Hesseling AC, Schaaf HS, Gie RP, Starke JR, Beyers N (2002) A critical review of diagnostic ap-proaches used in the diagnosis of childhood tuberculosis. Int J Tuberc Lung Dis 6(12):1038–1045. PMID:12546110
6. Starke JR (2003) Pediatric tuberculosis: time for a new approach. Tuberculosis 83:208–212. PMID:
12758213
7. Marais BJ, Gie RP, Schaaf S, Beyers N, Donald PR, Starke JR (2006) Childhood pulmonary tuberculo-sis: Old wisdom and new challenges. Am J Respir Crit Care Med 173:1078–1090. PMID:16484674
8. Marais BJ, Hesseling AC, Gie RP, Schaaf HS, Enarson DA, Beyers N (2006) The bacteriologic yield in children with intrathoracic tuberculosis. Clin Infect Dis 42:e69–e71. PMID:16575719
9. Marais B, Gie RP, Schaaf HS, Hesseling AC, Enarson DA, Beyers N (2006) The spectrum of disease in children treated for tuberculosis in a highly endemic area. Int J Tuberc Lung Dis 10:732–738. PMID:
16848333
10. Marais BJ, Graham SM, Cotton MF, Beyers N (2007) Diagnostic and management challenges for child-hood tuberculosis in the era of HIV. J Infect Dis 196:S76–S85. PMID:17624829
TB Diagnostics in Children with and without HIV Co-Infection
11. Salazar GE, Schmitz TL, Cama R, Sheen P, Franchi LM, Centeno G, et al. (2001) Pulmonary tuberculo-sis in children in a developing country. Pediatr 108:448–453.
12. Schaaf HS, Marais BJ, Whitelaw A, Hesseling AC, Eley B, Hussey GD, et al. (2007) Culture-confirmed childhood tuberculosis in Cape Town, South Africa: a review of 596 cases. BMC Infect Dis Nov 29; 7:140. PMID:18047651; PubMed Central PMCID: PMC2225409.
13. Zar HJ, Hanslo D, Apolles P, Swingler G, Hussey G (2005) Induced sputum versus gastric lavage for microbiological confirmation of pulmonary tuberculosis in infants and young children: a prospective study. Lancet Jan 8–14; 365(9454):130–4. Erratum in: Lancet. 2005 Jun 4–10;365(9475):1926. PMID:
15639294.
14. Berggren Palme I, Gudetta B, Bruchfeld J, Eriksson M, Giesecke J (2004) Detection of Mycobacterium tuberculosis in gastric aspirate and sputum collected from Ethiopian HIV-positive and HIV-negative chil-dren in a mixed in- and outpatient setting. Acta Paediatr 93(3):311–5. PMID:15124831.
15. Kiwanuka J, Graham SM, Coulter JB, Gondwe JS, Chilewani N, Carty H, et al. (2001) Diagnosis of pul-monary tuberculosis in children in an HIV-endemic area, Malawi. Ann Trop Paediatr 21(1):5–14. PMID:
11284247.
16. Montenegro SH, Gilman RH, Sheen P, Cama R, Caviedes L, Hopper T, et al. (2003) Improved detec-tion ofMycobacterium tuberculosis(MTB) in Peruvian children using a nested IS6110-PCR assay. Clin Infect Dis 36:16–23. PMID:12491196
17. Mayta H, Gilman RH, Arenas F, Valencia T, Caviedes L, Montenegro S, et al. (2003) Evaluation of a PCR-Based universal heteroduplex generator assay as a tool for rapid detection of MDRTB in Peru. PMID:J Clin Micro41(12):5774-57776-23.
18. Oberhelman RA, Soto-Castellares G, Gilman RH, Caviedes L, Castillo ME, Kolevic L, et al. (2010) Di-agnostic approaches for paediatric tuberculosis by use of different specimen types, culture methods, and PCR: a prospective case-control study. Lancet Infect Dis 10(9):612–20. Epub 2010 Jul 23. PMID:
20656559; PubMed Central PMCID: PMC2975578. doi:10.1016/S1473-3099(10)70141-9
19. Stegen G, Jones K, Kaplan P (1969) Criteria for guidance in the diagnosis of tuberculosis. Pediatrics 43:260–263. PMID:5304285
20. Toledo A, Katz F, Montiel J, Rico FG (1979) Criterios de diagnóstico en tuberculosis infantil. Rev Mex Pediatr 46:239–243.
21. Caviedes L, Lee TS, Gilman RH, Sheen P, Lee EH, Berg DE, et al. (2000) Rapid, efficient detection and drug susceptibility testing ofMycobacterium tuberculosisin sputum by microscopic observation of broth cultures. J Clin Microbiol 38:1203–1208. PMID:10699023
22. Moore DAJ, Evans CAW, Gilman RH, Caviedes L, Coronel J, Vivar A, et al. (2006) Sanchez E, Piñedo Y, Saravia JC, Salazar C, Oberhelman RA, Hollm-Delgado MG, LaChira D, Escombe AR, Friedland JS. Microscopic-observation drug-susceptibility assay for the diagnosis of TB. N Engl J Med 355:1539–1550. PMID:17035648
23. Evans CA (2011) Editorial: GeneXpert—a game-changer for TB control? PLoS Medicine 8(7); e1001064 doi:10.1371/journal.pmed.1001064PMID:21814497
24. Boehme CC, Nabeta P, Hillemann D, Nicol MP, Shenai S, Krapp F, et al. (2010) Rapid molecular detec-tion of tuberculosis and rifampin resistance. N Engl J Med 363:1005–15 doi:10.1056/
NEJMoa0907847PMID:20825313
25. Graham SM, Ahmed T, Amanullah F, Browning R, Cardenas V, Casenghi M, et al. (2012) Evaluation of tuberculosis diagnostics in children: 1. Proposed clinical case definitions for classification of intrathorac-ic tuberculosis disease. Consensus from an expert panel. J Infect Dis 205 Suppl 2:S199–208. doi:10. 1093/infdis/jis008PMID:22448023
26. Joint United Nations Programme on HIV/AIDS. Country Responses: Peru [document on the internet]. (2008) Geneva: UN AIDS Secretariat, Epidemiological Fact Sheet on HIV and AIDS, 2008 Update. Available from:http://www.unaids.org/en/CountryResponses/Countries/peru.asp.
27. Zar HJ, Workman L, Isaacs W, Munro J, Black F, Eley B, et al. (2012) Allen V, Boehme CC, Zemanay W, Nicol MP. Rapid Molecular Diagnosis of Pulmonary Tuberculosis in Children Using Nasopharyngeal Specimens. Clin Infect Dis Aug 3. [Epub ahead of print] PMID:22752518.
28. Moore DA, Caviedes L, Gilman RH, Coronel J, Arenas F, LaChira D, et al. (2006) Infrequent MODS TB culture cross-contamination in a high burden, resource-poor setting. Diagnostic Microbiology and Infect Dis 56(1):35–43. Epub 2006 May 6.