www.biogeosciences.net/11/7363/2014/ doi:10.5194/bg-11-7363-2014
© Author(s) 2014. CC Attribution 3.0 License.
Limpets counteract ocean acidification induced shell corrosion by
thickening of aragonitic shell layers
G. Langer1, G. Nehrke2, C. Baggini3, R. Rodolfo-Metalpa4, J. M. Hall-Spencer3, and J. Bijma2 1Department of Earth Sciences, Cambridge University, Cambridge, UK
2Biogeosciences, Alfred-Wegener-Institut Helmholtz-Zentrum für Polar- und Meeresforschung, Bremerhaven, Germany 3School of Marine Science and Engineering, University of Plymouth, Plymouth, UK
4CoRéUs, Institut de Recherche pour le Développement, Centre IRD de Noumea, Noumea, New Caledonia
Correspondence to:G. Langer (gl345@cam.ac.uk)
Received: 1 August 2014 – Published in Biogeosciences Discuss.: 25 August 2014
Revised: 6 November 2014 – Accepted: 9 November 2014 – Published: 20 December 2014
Abstract.Specimens of the patellogastropod limpetPatella caerulea were collected within (pHlow-shells) and outside (pHn-shells) a CO2 vent site at Ischia, Italy. Four pHlow-shells and four pHn-pHlow-shells were sectioned transversally and scanned for polymorph distribution by means of confocal Ra-man microscopy. The pHlow-shells displayed a twofold in-crease in aragonite area fraction and size-normalised arago-nite area. Size-normalised calcite area was halved in pHlow-shells. Taken together with the increased apical and the decreased flank size-normalised thickness of the pHlow-shells, these data led us to conclude that low-pH-exposed
P. caerulea specimens counteract shell dissolution by en-hanced shell production. This is different from normal elon-gation growth and proceeds through addition of aragonitic parts only, while the production of calcitic parts is confined to elongation growth. Therefore, aragonite cannot be regarded as a disadvantageous polymorph per se under ocean acidifi-cation conditions.
1 Introduction
There is general consensus that anthropogenic CO2 emis-sions lead to decreasing surface ocean pH and carbonate ion concentration, a process termed ocean acidification (e.g. Royal Society, 2005). This entails a decrease in seawater sat-uration state with respect to calcium carbonate. Calcium car-bonates occur in the form of different polymorphs, the most resistant to dissolution being calcite, followed by aragonite. It was proposed that by the year 2100 the subarctic Pacific
under ocean acidification some organisms might be able to compensate for shell dissolution by increasing shell pro-duction (Rodolfo-Metalpa et al., 2011). This compensatory shell production might favour the more dissolution-resistant polymorph in species producing both aragonite and calcite (see also Taylor and Reid, 1990). Specimens of the limpet
Patella caerulea, collected at an acidified volcanic CO2vent site at Ischia, displayed higher gross calcification rates than their fellow specimens, collected outside the vent site (nor-mal pH, Rodolfo-Metalpa et al., 2011). It was also shown thatP. caeruleaspecimens collected within the vent site are considerably corroded (Hall-Spencer et al., 2008; Rodolfo-Metalpa et al., 2011). Taken together, the previous two ob-servations suggest thatP. caeruleamight be able to compen-sate, to a certain extent (compare Hall-Spencer et al., 2008; Rodolfo-Metalpa et al., 2011), shell dissolution by increased shell production. Since limpets produce aragonitic as well as calcitic shell layers (see above), an interesting question is whether compensatory shell production shows a bias towards a particular polymorph. Here we present the polymorph dis-tribution of complete cross sections ofP. caeruleashells col-lected from within and outside the Ischia CO2vent site.
2 Material and methods 2.1 Study site and sampling
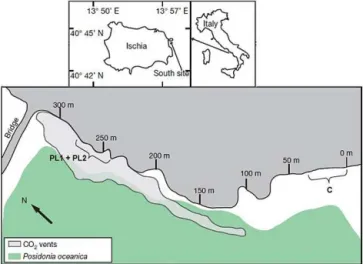
The study site is an area located off the east coast of Ischia (40◦43.81′N, 13◦57.98′E), in shallow waters of 2–6 m and within 1–15 m of the shore line. Emissions from the vents in this area are composed of 90–95 % CO2, 3–6 % N2, 0.6– 0.8 % O2, 0.2–0.8 % CH4and 0.08–0.1 % Ar, without toxic sulphur compounds (Hall-Spencer et al., 2008). Since the vent gases do not contain toxic substances and are at ambient seawater temperature, this area can be used as a natural labo-ratory to understand ecosystem effects of ocean acidification. Gas fluxes were measured during 2006–2007, and no sea-sonal, tidal or diurnal variation in gas flow rates was detected, while pH and saturation states of aragonite and calcite varied with sea state, being lowest on calm days, and showed large decreases as pCO2 amounts increased proceeding towards the vent sites (Hall-Spencer et al., 2008). Patella caerulea
specimens were collected from two low-pH sites (PL1 and PL2), and from a control site (C) in December 2009 (Fig. 1). Temperature, pH and TA were measured from September to December 2009, and the other carbonate chemistry param-eters were calculated from them. PL1 and PL2 had a mean pH of 6.46±0.35 (mean±SD) and 6.51±0.38 respectively, while the control site had a mean pH of 8.03±0.05 (Table 1). 2.2 Sample preparation and Raman spectroscopy Raman imaging was done using a WITec alpha 300 R (WITec GmbH, Germany) confocal Raman microscope. Imaging was done using a motorised scan table with a
max-Figure 1.Study area, showing the low-pH sites (PL1 and PL2) and the control site (C).
imum scan range of up to 2.5 cm×2.5 cm and a minimum step size of 100 nm. Scans are performed using a 532 nm diode laser and an ultra-high throughput spectrometer with a grating, 600 mm and 500 mm blaze (UHTS 300, WITec, Germany). The objective used was a 20×Zeiss with a NA of 0.4.
For the imaging, every 10 µm a Raman spectra was ac-quired with a integration time of 0.05 s per spectra. The size of the sample and its irregular shape as well as the extremely high resolution of 10 µm (resulting in huge spectral files) did not allow imaging the whole sample in one run. There-fore, the sample had to be repositioned several times. The sample processing was done for each scan separately (using the WITec Project software, version 2.10). This resulted in slightly different colour scales for each image, since it was not possible to synchronise these scales during the data pro-cessing. However, this only alters the optical appearance of the images after they have been stitched together using the software Gimp 2.8 and does not affect the interpretation of the images. For details on the Raman imaging of this type of samples the interested reader is referred to several other studies performed using the described setup (e.g. Nehrke and Nouet, 2011; Nehrke et al., 2012; Wall and Nehrke, 2012; Stemmer and Nehrke, 2014).
2.3 Size measurements and data analysis
Table 1.Mean value (± SD) of temperature (T), pHT(total scale),pCO2, concentration of HCO−3 and CO 2−
3 ions, CO2concentration in sea water, dissolved inorganic carbon (DIC), saturation state () of aragonite and calcite for the study sites.
Site T pHT pCO2 HCO−3 CO
2−
3 CO2 DIC Ca Ar
(◦C) (µatm) (µmol kg−1)
C 19.7 8.03 474 2043 220 15 2279 5.15 3.36
(±2.0) (±0.05) (±74) (±46) (±19) (±2) (±29) (±0.45) (±0.30)
PL1 20.1 6.46 22 047 2542 14 758 3315 0.33 0.22
(±2.2) (±0.35) (±13 264) (±50) (±21) (±510) (±526) (±0.48) (±0.32)
PL2 20.1 6.51 19 504 2509 17 618 3143 0.39 0.26
(±2.2) (±0.38) (±12 338) (±96) (±18) (±392) (±426) (±0.43) (±0.28)
measurements and dividing the resulting values by the shell’s length. Size-normalised thickness of a shell’s apex (SNTA) was determined by averaging ca. 10 evenly spaced thick-ness measurements and dividing the resulting value by the shell’s length. The apex of a shell was arbitrarily defined as a certain distance (ca. 1.5 mm) left and right to the highest point of the shell (see Fig. 2). The latter measure was taken to avoid a one-point measurement of the highest point of a shell. Such a one-point measurement is prone to being not representative. The fraction of aragonite area (FA) was deter-mined as pixels representing aragonite (measured by means of Nikon NIS Elements 4.0 software) divided by the sum of pixels representing aragonite and pixels representing calcite (Fig. 3). The size-normalised aragonite area (SNAA) equals pixels representing aragonite divided by the shell length. The size-normalised calcite area (SNCA) equals pixels represent-ing calcite divided by the shell length.
3 Results
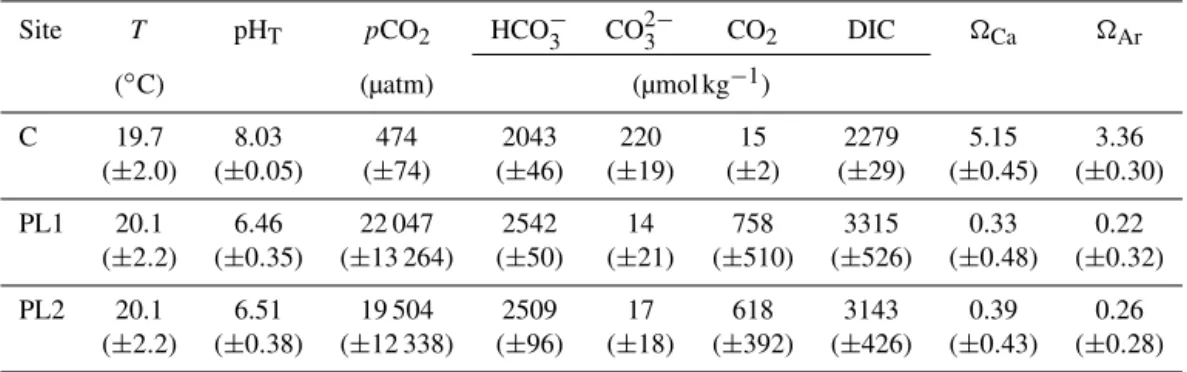
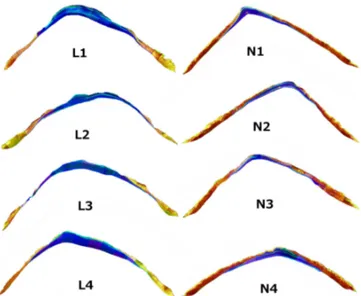
All shells selected for analysis were of similar size. The length of the pHn-shells was 31±2 mm (mean±SD of four shells), while the length of the pHlow-shells was 36±3 mm (mean±SD of four shells). Polymorph distribution imag-ing revealed marked differences between pHlow-shells and pHn-shells (Fig. 4). Size-normalised thickness of the flank (SNTF) was 26 % lower in pHlow-shells (Fig. 5), while size-normalised thickness of the apex (SNTA) was 26 % higher in pHlow-shells (Fig. 6). The fraction of aragonite area (FA) was by a factor of 2.3 higher in pHlow-shells (Fig. 7). Size-normalised aragonite area (SNAA) was by a factor of 2.2 higher in pHlow-shells (Fig. 8), and size-normalised calcite area (SNCA) was by a factor of 2.4 lower in pHlow-shells (Fig. 9).
4 Discussion
The low-pH site at Ischia, from which the analysed pHlow-shells were taken, features seawater that is under-saturated
Figure 2.Sketch of a shell indicating length, apex, and shortest flank.
Figure 3.Example of a Raman image across the cross section of the shell. Blue represents aragonite and yellow calcite, as identified by the corresponding Raman spectra shown.
Figure 4. Polymorph distribution of transversally sectioned shells. Blue = aragonite, yellow = calcite. Normal = pHn-shells, low = pHlow-shells.
Figure 5. Size-normalised thickness of the flank (SNTF). Nor-mal = pHn-shells, low = pHlow-shells.
shell, indeed the case (Fig. 7). On the contrary, in the apex area, the SNT is higher in pHlow-shells (Fig. 6). The latter can only stem from enhanced shell production. From the above it can be concluded that net shell production in pHlow-shells is region specific, i.e. enhanced at the apex area, and reduced along the flank area. A comparison of the mineralogical com-position of the shells from the two different sites shows that the fraction of aragonite area (FA) for pHlow-shells is twice as big as for pHn-shells (Fig. 7). This observation could ex-clusively be due to a higher SNT of the apex area, which is predominantly aragonitic. If the increased FA is related to normal shell production and dissolution, the size-normalised aragonite area (SNAA) should be unaltered or decreased. We observed, contrariwise, an increased SNAA (Fig. 8), which is in line with the increased SNT of the apex area, both point-ing to enhanced shell production. Along the flank area, how-ever, the SNT is decreased in pHlow-shells (Fig. 7), and so is
Figure 6. Size-normalised thickness of the apex (SNTA). Nor-mal = pHn-shells, low = pHlow-shells.
Figure 7. Fraction of aragonite area (FA). Normal = pHn-shells, low = pHlow-shells.
the overall size-normalised calcite area (SNCA, Fig. 9). To conclude, there is ample evidence suggesting that low-pH-exposedP. caeruleaspecimens counteract dissolution by en-hanced shell production. Hence, the mineralogical analyses of the shell sections support our conclusion drawn on the ba-sis of the thickness measurements, i.e. that enhancement of shell production is region specific, and, by entailment, poly-morph specific. The latter conclusion is plausible when con-sidering simultaneous shell growth and dissolution as will be detailed in the following.
Figure 8.Size-normalised aragonite area (SNAA). Normal = pHn -shells, low = pHlow-shells.
With time this material is dissolved which results in a thin-ning of the shell. Our observations suggest thatP. caerulea
counteracts this thinning by depositing additional layers on the inner side of the shell. Since the deposition of layers at the inner side of the shell is related to a mechanism produc-ing aragonite the amount of aragonite increases while calcitic parts at the outside are dissolved. New formation of calcitic areas is only possible during elongation of the shell (increase in size) but not to counteract dissolution. The scenario de-scribed above results in the relative (as expressed by FA, Fig. 7) increase in aragonite in the pHlow-shells. Taken to-gether with the absolute (as expressed by SNAA, Fig. 8) in-crease in aragonite and the inin-creased SNT of the apex area (Fig. 6) in the pHlow-shells, this suggests a high efficacy of the compensatory shell production. Our results demon-strate that the ability of limpets to cope, to a certain extent (compare also Hall-Spencer et al., 2008; Rodolfo-Metalpa et al., 2011), with corrosive waters is not related to the pref-erential usage of the more dissolution-resistant polymorph, but is solely governed by the mechanism of shell formation. This mechanism allows for compensatory shell thickening through the deposition of additional layers on the inner side of the shell. We do not know whether the additional layers are structural layers.
One possibility is that the layers we call “additional” are similar to the layers related to shell repair inHaliotis(Fleury et al., 2008). These additional layers are aragonitic, but this is genetically determined and does not represent a response to ocean acidification. The shift towards aragonite seen in pHlow-shells is simply a by-product of the way limpets use calcium carbonate polymorphs in shell formation. The fact that the additional, aragonitic layers of the pHlow-shells lead to an increased SNT of the apex (Fig. 6) also shows that arag-onite cannot be regarded as a disadvantageous polymorph per se under corrosive ocean acidification. We ascribed the changes in shell mineralogy and shell thickness of our sam-ples to seawater carbonate chemistry changes. Since these are field samples, as opposed to experimental samples, possi-ble secondary influences have to be considered. ForMytilus
Figure 9. Size-normalised calcite area (SNCA). Normal = pHn -shells, low = pHlow-shells.
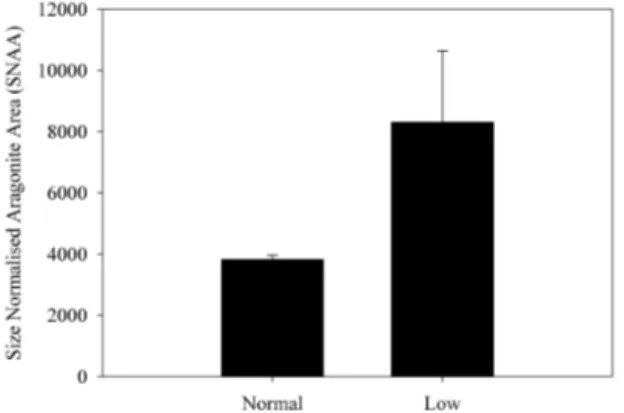
Figure 10.Photographs of the analysed shells. Shells sampled at the control site, i.e. at normal pH(a–d). Shells sampled at the vent site, i.e. at low pH(e–h).
5 Conclusions
Polymorph distribution analyses of complete cross sections ofPatella caeruleashells from a CO2vent site at Ischia re-vealed that this species counteracts shell dissolution in corro-sive waters by enhanced production of aragonitic shell layers. The question of whether these layers represent structural lay-ers will be the subject matter of an upcoming microstructural investigation.
Acknowledgements. This work was funded by The European Research Council (ERC grant 2010-NEWLOG ADG-267931 HE). This work contributes to the EU “Mediterranean Sea Acidification under a changing climate” project (MedSeA; grant agreement 265103) and the NERC UK Ocean Acidification Research Pro-gramme (grant no. NE/H02543X/1).
Edited by: A. Shemesh
References
Bednarsek, N., Tarling, G. A., Bakker, D. C. E., Fielding, S., Jones, E. M., Venables, H. J., Ward, P., Kuzirian, A., Leze, B., Feely, R. A., and Murphy, E. J.: Extensive dissolution of live pteropods in the Southern Ocean, Nat. Geosci., 5, 881–885, 2012. Cigliano, M., Gambi, M. C., Rodolfo-Metalpa, R., Patti, F. P., and
Hall-Spencer, J. M.: Effects of ocean acidification on invertebrate settlement at volcanic CO2vents, Mar. Biol., 157, 2489–2502, 2010.
Cohen, A. L. and Branch, G. M.: Environmentally controlled varia-tion in the structure and mineralogy ofPatella granularisshells from the coast of southern Africa: implications for palaeotem-perature assessments, Palaeogeogr, Palaeocl., 91, 49–57, 1992. Dodd, J. R.: The Influence of Salinity on Mollusk Shell Mineralogy:
A Discussion, J. Geol., 74, 85–89, 1966.
Eisma, D.: The Influence of Salinity on Mollusk Shell Mineralogy: A Discussion, J. Geol., 74, 89–94, 1966.
Field, C. B., Barros, V., Stocker, T. F., Dahe, Q., Mach, K. J., Plat-tner, G., Mastrandrea, M. D., Tignor, M., and Ebi, K. L.: IPCC Workshop on Impacts of Ocean Acidification on Marine Biol-ogy and Ecosystems, 17–19 January 2011, Carnegie Institution, Stanford, California, USA, 164 pp., 2011.
Fleury, C., Marin, F., Marie, B., Luquet, G., Thomas, J., Josse, C., Serpentini, A., and Lebel, J. M.: Shell repair process in the green ormer Haliotis tuberculata: A histological and microstructural study, Tissue and Cell, 40, 207–218, 2008.
Gattuso, J.-P. and Hansson, L.:Ocean Acidification, Oxford Univer-sity Press, Oxford, UK, 2011.
Hall-Spencer, J. M., Rodolfo-Metalpa, R., Martin, S., Ransome, E., Fine, M., Turner, S. M., Rowley, S. J., Tedesco, D., and Buia, M.-C.: Volcanic carbon dioxide vents show ecosystem effects of ocean acidification, Nature, 454, 96–99, 2008
Harper, E. M.: Are calcitic layers an effective adaptation against shell dissolution in the Bivalvia?, J. Zool., 251, 179–186, 2000. Hedegaard, C., Lindberg, D. R., and Bandel, K.: Shell
microstruc-ture of a Triassic patellogastropod limpet, Lethaia, 30, 331–335, 1997.
MacClintock, C.: Shell Structure of Patelloid and Bellerophontoid Gastropods (Mollusca), Peabody Museum of Natural History Yale University Bulletin, 22, 140 pp., New Haven, Connecticut, 1967.
McClintock, J. B., Angus, R. A., Mcdonald, M. R., Amsler, C. D., Catledge, S. A., and Vohra, Y. K.: Rapid dissolution of shells of weakly calcified Antarctic benthic macroorganisms indicates high vulnerability to ocean acidification, Antarct. Sci., 21, 449– 456, 2009.
McNeil, B. I. and Matear, R. J.: Southern Ocean acidification: a tipping point at 450-ppm atmospheric CO2, P. Natl. Acad. Sci. USA, 105, 18860–18864, 2008.
Nehrke, G. and Nouet, J.: Confocal Raman microscope mapping as a tool to describe different mineral and organic phases at high spatial resolution within marine biogenic carbonates: case study onNerita undata(Gastropoda, Neritopsina), Biogeosciences, 8, 3761–3769, doi:10.5194/bg-8-3761-2011, 2011.
Nehrke, G., Poigner, H., Wilhelms-Dick, D., Brey, T., and Abele, D.: Coexistence of three calcium carbonate polymorphs in the shell of the Antarctic clamLaternula elliptica, Geochem. Geo-phy. Geosy., 13, Q05014, doi:10.1029/2011GC003996, 2012. Orr, J. C., Fabry, V. J., Aumont, O., Bopp, L., Doney, S. C., Feely,
R. A., Gnanadesikan, A., Gruber, N., Ishida, A., Joos, F., Key, R. M., Lindsay, K., Maier-Reimer, E., Matear, R., Monfray, P., Mouchet, A., Najjar, R. G., Plattner, G.-K., Rodgers, K. B., Sabine, C. L., Sarmiento, J. L., Schlitzer, R., Slater, R. D., Tot-terdell, I. J., Weirig, M.-F., Yamanaka, Y., and Yool, A.: Anthro-pogenic ocean acidification over the twenty-first century and its impact on calcifying organisms, Nature, 437, 681–686, 2005. Rodolfo-Metalpa, R., Houlbreque, F., Tambutte, E., Boisson, F.,
Baggini, C., Patti, F. P., Jeffree, R., Fine, M., Foggo, A., Gat-tuso, J.-P., and Hall-Spencer, J. M.: Coral and mollusc resistance to ocean acidification adversely affected by warming, Nature Cli-mate Change, 1, 308–312, 2011.
Royal Society: Ocean Acidification due to Increasing Atmospheric Carbon Dioxide, Policy Document 12/05, The Royal Society, London, 60 pp., 2005.
Stemmer, K. and Nehrke G.: The distribution of polyenes in the shell ofArctica islandicafrom North Atlantic localities: a con-focal Raman microscopy study, J. Mollus. Stud., 80, 365–370, doi:10.1093/molus/eyu033, 2014.
Taylor, J. D. and Reid, D. G.: Shell microstructure and mineralogy of the Littorinidae: ecological and evolutionary significance, Hy-drobiologia, 193, 199–215, 1990.
Wall, M. and Nehrke, G.: Reconstructing skeletal fiber arrangement and growth mode in the coralPorites lutea(Cnidaria, Sclerac-tinia): a confocal Raman microscopy study, Biogeosciences, 9, 4885–4895, doi:10.5194/bg-9-4885-2012, 2012.