Analysis and Visualization of In-patients’
Nursing Record Using Text Mining Technique
Muneo Kushima, Kenji Araki, Muneou Suzuki, Sanae Araki, and Terue Nikama
Abstract—It is an important research assignment in the field of medical information to make effective use of the treatment information and administrative information that the care card manages. One example of this is the use of the text mining technique shown in this text. In this research, the in-patients’ nursing record in the internal medicine, managed by the electronic medical record system of the University of Miyazaki Hospital, was first visualized by KeyGraph. As a result of this, a quantitative nursing record that used the text mining technique was able to be analyzed and an initial purpose of visualization was able to be achieved. The result of this research contributes to the work evaluation and the education of the nursing master.
Index Terms—electronic medical record, text mining, nursing record, KeyGraph, visualization.
I. INTRODUCTION
W
HEN the medical information system [1] was updated on May, 2006, University of Miyazaki Hospital intro-duced the package version of the Electronic Medical Record (EMR) system, which was developed in collaboration with a local IT company. The EMR records information on patients not by paper cards, but by computers. The expected effect is to make the process of the entire hospital management easy to understand and to raise the quality of medical care. The recorded main data includes patients’ symptoms, laboratory results, kinds of medicine prescribed, and the tracking of the data changed [2]-[3]. Doctors and nurses are not only able to share patients’ information, but also coordinate it with arrangements of various inspections and the medical accounting system, etc.Data mining [4] involves searching for correlation between items by analyzing a great deal of accumulated data, such as sales data and telephone call history. Text mining [5] is the same in that it aims to extract useful information by analysis from diversified viewpoints of written data. Recently, interest has risen for text mining that reveals useful knowledge buried in a large amount of accumulated documents. Research has started which applies text mining to medicine and the realm of healing [6]-[9]. In addition, electronic medical treatment data is increasing with an accelerated speed because of rapid informationization of the medical system, including the EMR. Recently, research on ”Data mining in medical treatment”, aiming at information and pattern extraction from a huge accumulated database, has been actively carried out. However, many medical documents, including the EMRs
Manuscript received December 8, 2010; revised January 10, 2011. M. Kushima is a doctral candidate in the faculty of medicine at the Uni-versity of Miyazaki Hospital. e-mail: kushima@fc.miyazaki-u.ac.jp, (see http://mit.med.miyazaki-u.ac.jp/).
K.Araki, M.Suzuki S.Araki and T.Nikama are with the Faculty of Medicine, University of Miyazaki Hospital. 5200, Kihara, Kiyotake-cho, Miyazaki-shi 889-1692 Japan. Tel: +81-985-85-9057, Fax: +81-985-84-2549.
where the treatment information of patients is described, are text information. There is a problem with the complication of mining as well. The arrangement and the retrieval of data becomes difficult concerning these text parts because they are often described in a free format; words and phrases and the expressions used are different depending on the writers. It is possible that text mining of documents will be used for a lateral retrieval in the world of medical treatment in the future by not only the numerical value of the inspection data, but also the computerization of documents.
In the present study, in-patients’ nursing records are cho-sen from among the nursing records preserved by the EMR system of University of Miyazaki Hospital. Sentences are analyzed in morphemes, relations between feature vocabu-laries are analyzed by using KeyGraph, and visualization of this information has been attempted.
II. NURSING RECORD
The text data in the EMR consists of paper passages concerning the inspection report, the in-patient care plan, the nutrition management plan, bedsore plan, the fall check, the operative note, and summaries. The doctor fills in the passage record and the nurses fill in the nursing record. In the nursing record, life history and inspection history of a patient are written. In addition, the nursing record has small notes about reservations, etc. There are no rules about text recording and, as a result, ambiguous feelings or impressions are sometimes written down. Nurses remember or take notes about what patients say during their busy schedules and later input it collectively to the EMR. There are 4 forms of recording: S (Subjective data) writes about subjective information, O (Objective data) about objective information, A (Assessment) about assessment, P (Plan) about future planning.
• S (Subjective data)EXT MINING APPLICATION TO MEDICINE
Extraction of information
Analysis of extracted information
Making of analytical result visible
It searches for the problem and the finding
Work flow
Text data
Cleaning of data
Text mining
・Network of making into visible chart ・Appearance frequency
bar chart ・etc.
Tools Region of research
Technology of making to sentence
Morpheme analysis
Extraction of keywords Analytical technique algorithm
Visualization technology
Technology used Collection of data
Fig. 1. Process of text mining.
into a database), deriving patterns within the structured data, and, finally evaluation and interpretation of the output. Figure 1 shows the process of text mining.
The following points are paid attention to when text mining is applied to medicine.
• In medical treatment, it is to be used in the
understand-ing of the importance of rare events such as side effects from medication and arrhythmia.
• To obtain final decisions about the courses of treatment.
The entire process of identifying symptoms or understand-ing the associated risk, while takunderstand-ing appropriate action, can be a problem.
IV. SUPPORTING TOOLS
Tools were selected in order to apply text mining tech-niques and are as follows:
• Chasen is applied for morphologic analysis [10]-[11].
Chasen is a morphological parser for the Japanese language. This tool for analyzing morphemes was devel-oped at Matsumoto laboratory, NAIST (NAra Institute of Science and Technology).
• KeyGraph in Polaris is applied for extracting key words
[12]-[14].
V. KEYGRAPH
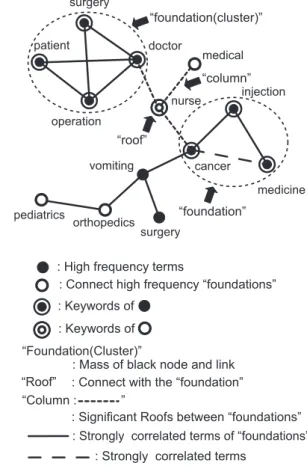
Figure 2 shows an image graph of KeyGraph. Figure 3 shows an example of KeyGraph when it is applied to the text data. KeyGraph is a graph-making method that uses the frequency in the use of a word and the co-occurrence among words, clarifies the important relationships among them, and extracts key factors from them.
A. The Algorithm of KeyGraph
KeyGraph, originally an algorithm for extracting terms (words or phrases), expresses assertions based on the co-occurrence graph of terms from text data. The strategy of KeyGraph comes from considering that a document is
foundation black node
white node link
Fig. 2. Image graph of KeyGraph.
constructed like a building for expressing new ideas based on traditional concepts as follows:
A building hasfoundations(statements for preparing basic concepts), walls, doors and windows (ornamentation). But the roofs (main ideas in the document), without which the building’s inhabitants cannot be protected against rain or sunshine, are the most important. Theseroofsare supported bycolumns. Simply put, KeyGraph finds theroofs.
The process of KeyGraph consists of four phases: 1) Document preparation: Prior to processing a document D, stop words that have little meaning and are discarded from D, words inDare stemmed, and phrases inDare identified. Hereafter, atermmeans a word or a phrase in processed D. 2) Extracting foundations: Graph G for document D is made of nodes representing terms and links representing their co-occurrence (term-pairs which frequently occur in same sentences throughoutD). Nodes and links in Gare defined as follows:
a)Nodes: Nodes inGrepresent high-frequency terms inD because terms might appear frequently for expressing typical basic concepts in the domain. High frequency terms are the set of terms above the highest frequency (black nodes). We denote this set byHF.
b)Links: Nodes inHFare linked if the association between the corresponding terms is strong. The association of terms wi andwj inDis defined as:
assoc(wi, wj) =
∑
s∈D
min(|wi|s,|wj|s), (1)
where |w|s denotes the count of w in sentence s. Pairs of high-frequency terms inHFare sorted byassocand the pairs above the (number of nodes in G) -1 th tightest association are represented in G by links between nodes (solid lines). Then, each cluster (called a foundation) is obtained as a set of nodes and links forming a connected graph.
c)Extracting columns: The probability of termwto appear near clusters is defined askey (w), and thekey (w)is defined by
key(w) = 1− ∏
g⊂G
[
1− based(w, g)
neighbors(g) ]
, (2)
based(w, g) = ∑
s∈D
neighbors(g) = ∑
s∈D
∑
w∈s
|w|s|g−w|s. (4)
|g−w|s=
{|g|
s− |w|s, w∈g
|g|s, w /∈g
(5)
wheregrepresents each cluster in G. Sorting terms inDby keyproduces a list of terms ranked by their association with clusters and the several top keyterms are taken forhigh key terms.
d)Extracting roofs: The strength of the column between a high key termwi and a high frequency term
wj ⊂HF is expressed as:
column(wi, wj) =
∑
s∈D
min(|wi|s,|wj|s). (6)
Columns touching wi are sorted by column(wi, wj) for each high key term wj. Columns with the highest column values are selected to create new links inG. We depict such links, representing columns, by dotted lines. Then, each term wiis connected by these attached columns to terms in two or more clusters. Finally, nodes in Gare sorted by the sum of columnvalues of its touching columns. Terms represented by nodes of higher values of these sums than a certain threshold are extracted as the keywords for document D, as depicted by node of term (Roof).
VI. RESULT OF ANALYSIS
In this paper, the in-patients’ nursing record of University of Miyazaki Hospital was assumed to be data and the nursing record of June 2007 was used. Here we made an analysis in 3 different cases (Internal Medicine 1-2-3). The analysis results were shown as follows:
• Internal Medicine 1 : Firstly, Figure 4 shows a result of
KeyGraph co-occurrence network chart when it is ap-plied to the text data of the internal medicine 1. “Foun-dations” are obtained from text data, each including an event-set { Patient, Consent, Setup, Wearing, Running fire, Above, Word, Electrocardiogram }. The internal medicine 1 has the most patients with circulatory organ problems; therefore, doctors frequently ask patients for “consent” to administer specific tests because there are many inspections such as, the cardiac catheter tests and endoscopy, etc. Moreover, there is an emphasis on whether to transmit the instruction from the doctor to the nurse or not.
• Internal Medicine 2 : Secondly, Figure 5 shows a
result of KeyGraph co-occurrence network chart when it is applied to the text data of the internal medicine 2. “Foundations” are obtained from text data, each including an event-set {Start, Today, Eye, Internal use
},{ Progress, Connection, Medication, Feeling, Urine, Defect }. The internal medicine 2 has a lot of serious cases such as blood disease and liver cancers, and is a department where anti-cancer drug administration or chemotherapy is frequently performed. There are many terms related to the confirmation of medicine being given or taken and there are many terms related to the medicine’s side effects.
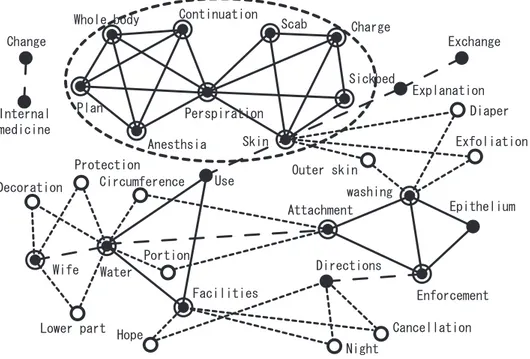
• Internal Medicine 3 : Thirdly, Figure 6 shows a result
of KeyGraph of co-occurrence network chart when it
doctor
cancer medical
vomiting operation
medicine nurse injection surgery
patient
“foundation(cluster)”
“roof”
“column”
: High frequency terms
: Keywords of
: Keywords of
: Connect high frequency “foundations”
: Strongly correlated terms of “foundations” : Significant Roofs between “foundations” “Foundation(Cluster)”
“Roof”
: Mass of black node and link : Connect with the “foundation”
“foundation”
surgery orthopedics pediatrics
“Column : ”
: Strongly correlated terms
Fig. 3. An example of KeyGraph when it is applied to the text data.
is applied to the text data of the internal medicine 3. “Foundations” are obtained from text data, each includ-ing an event-set { Charge, Sickbed, Skin, Perspiration, Anesthsia, Plan, Whole body, Continuation, Scab }. There are a lot of cases with respiratory illness, diseases of the nervous system, and there are a lot of bedridden patients; therefore, there are a lot of terms such as ”anesthesia”, etc.
VII. CONSIDERATION
This paper shows a greater possibility of a disease being automatically specified and classified from documents used at the medical treatment site. In the future, the use of the text mining approach and processing of medical documents laterally will support disease classification, retrieving exam-ples of similar syndromes, etc. It can also be applied to the discovery of new medical knowledge which enables new syndrome detection. Text mining is expected to become a valuable technique in the analysis of medical documents in the future. In this way, text mining techniques are expected to be applied to all medical documents in the future and help each field of research make favorable progress.
VIII. CONCLUSION
Patient
Wearing
Above Word
Consent
Running fire Electrocardiogram
Arrhythmic Observation
Progress
Situation Report
Doctor
Enforcement Medical
examination Situation
Explanation Blood sugar
Condition
Petition Family doctor Nursing Internal use Eyes
Blood pressure
Move Eat
Intravenous
Connection Duty
Directions
Foundations Setup
Sharp pain
Check
Person Right
Hope Use
Pain Close
Fig. 4. A result of KeyGraph, for internal medicine 1 of University of Miyazaki Hospital, (nursing record of June 2007 was used). Parameter of KeyGraph : JaJa[30-30-10-15]
Ingestion Supper
Meal
Hope
After OK
Medicine
Internal use
Eye
Today Start
Person Head
Heat
Raw
Intravenous drip
Inhalation
Progress Enforcement
Connection
Medication Schedule
Feeling
Urine
Return
Night Use
Petition Chest Explanation
Consciousness
Condition Observation
Measurement Report
Duty Front
Family doctor
Directions
Defect
Fig. 5. A result of KeyGraph, for internal medicine 2 of University of Miyazaki Hospital, (nursing record of June 2007 was used). Parameter of KeyGraph : JaJa[30-30-10-15]
treatment department was visualized. Along with years of experience so far, the resultant visualization based on the relevant jargon, was obtained and compared with the result of the nursing record that had been reported. The result was an analysis of qualitative in-patients’ nursing records using a text mining technique and the initial goal was achieved: a visual record of this information. In addition, this enabled the discovery of vocabularies relating to proper methods of treatment, resulting in a concise summary of the vocabularies extracted from the in-patients’ nursing record. Important vocabularies characterizing each nursing record were also revealed. We intend to accumulate the clinical research data that evaluates the safety, etc., of the prognosis,
the prognostic factor, treatment results, and the safety of Medical Technologies. This information will then be related to cost reduction, efficiency improvement, and the quality improvement of clinical research in the future.
IX. FUTURE WORK
Whole body Continuation Scab Charge
Sickbed
Explanation Exchange
Diaper
Exfoliation
Outer skin Use
Attachment Circumference
Decoration
Protection
Perspiration Plan
Anesthsia
Wife Water
Lower part
Portion
Facilities
Hope
washing
Epithelium
Enforcement Directions
Cancellation Night
Skin Change
Internal medicine
Fig. 6. A result of KeyGraph, for internal medicine 3 of University of Miyazaki Hospital, (nursing record of June 2007 was used). Parameter of KeyGraph : JaJa[30-30-10-15]
TABLE I SUBJECT WORD
Information Science and Applications (ICISA 2010), Seoul, Korea, pp. 686–693, 4/2010.
[7] M, Kushima., K, Araki., M, Suzuki., S, Araki, H.Tamura, K.Tanno, T.Toyama, O.Ishizuka and M.Ikeda, “Analysis of Nurse’s Medical Record in The IZANAMI Using Text Mining Method,”18th Interna-tional Workshop on Post-Binary ULSI Systems, Okinawa, Japan, 5/2009. [8] M, Kushima., K, Araki., M, Suzuki., S, Araki., H, Tamura., K, Tanno., T, Toyama., O, Ishizuka., and M, Ikeda., “Visualization of EMR by Using Mining Technology,”Proceedings of the 2009 IEICE General Conference, D-4-6, 3/2009.
[9] M, Kushima., K, Araki., M, Suzuki., S, Araki., H, Tamura., K, Tanno., T, Toyama., O, Ishizuka., and M, Ikeda., “Network Visualization of Electronical Medical Record(IZANAMI) by Using Mining Technology,”
Technical Report Of IEICE, vol. 108, no. 388, CAS2008-97, pp. 187– 192, 2009.
[10] Chasen web site. Availaible on: http://chasen-legacy.sourceforge.jp/. [11] Y, Matsumoto., A, Kitauchi., T, Yamashita., Y, Hirano., H, Matsuda.,
K, Takaoka, and M, Asahara., “Morphological Analysis System Chasen Version 2.2.1 Manual,”Nara Institute of Science and Technology, 2000. [12] Y, Ohsawa., Nels E, Benson., and M, Yachida., “KeyGraph: Automatic Indexing by Segmenting and Unifing Co-occurrence Graphs,” The Institute of Electronics, Information and Communication Engineers, vol.J82–D–I, no.2, pp.391-400, 2/1998.
[13] N, Okazaki., and Y, Ohsawa., “Polaris: An Integrated Data Miner for Chance Discovery,”In Proc. of Workshop of Chance Discovery and Its Management (in conjunction with International Human Computer Interaction Conference (HCI2003), Crete, Greece, 1/2003.