NHESSD
3, 1915–1948, 2015Assessing the vulnerability of infrastructure to climate change on the Islands of Samoa
S. H. M. Fakhruddin
Title Page
Abstract Introduction
Conclusions References
Tables Figures
◭ ◮
◭ ◮
Back Close
Full Screen / Esc
Printer-friendly Version
Interactive Discussion
Discussion
P
a
per
|
Discussion
P
a
per
|
Discussion
P
a
per
|
Discussion
P
a
per
|
Nat. Hazards Earth Syst. Sci. Discuss., 3, 1915–1948, 2015 www.nat-hazards-earth-syst-sci-discuss.net/3/1915/2015/ doi:10.5194/nhessd-3-1915-2015
© Author(s) 2015. CC Attribution 3.0 License.
This discussion paper is/has been under review for the journal Natural Hazards and Earth System Sciences (NHESS). Please refer to the corresponding final paper in NHESS if available.
Assessing the vulnerability of
infrastructure to climate change on the
Islands of Samoa
S. H. M. Fakhruddin
Asian Institute of Technology (AIT), Bangkok, Thailand
Received: 7 January 2015 – Accepted: 24 February 2015 – Published: 12 March 2015
Correspondence to: S. H. M. Fakhruddin ([email protected])
Published by Copernicus Publications on behalf of the European Geosciences Union.
NHESSD
3, 1915–1948, 2015Assessing the vulnerability of infrastructure to climate change on the Islands of Samoa
S. H. M. Fakhruddin
Title Page
Abstract Introduction
Conclusions References
Tables Figures
◭ ◮
◭ ◮
Back Close
Full Screen / Esc
Printer-friendly Version
Interactive Discussion
Discussion
P
a
per
|
Discussion
P
a
per
|
Discussion
P
a
per
|
Discussion
P
a
per
|
Abstract
Pacific Islanders have been exposed to risks associated with climate change. Samoa as one of the Pacific Islands are prone to climatic hazards that will likely increase in coming decades, affecting coastal communities and infrastructure around the is-lands. Climate models do not predict a reduction of such disaster events in the future
5
in Samoa; indeed, most predict an increase in such events. This paper identifies key infrastructure and their functions and status in order to provide an overall picture of relative vulnerability to climate-related stresses of such infrastructure on the island. By reviewing existing reports as well as holding a series of consultation meetings, a list of critical infrastructures were developed and shared with stakeholders for their
consid-10
eration. An indicator-based vulnerability model (SIVM) was developed in collaboration with stakeholders to assess the vulnerability of selected infrastructure systems on the Samoan Islands. Damage costs were extracted from the Evan cyclone recovery needs document. On the other hand, criticality and capacity to repair data were collected from stakeholders. Having stakeholder perspectives on these two issues was important
be-15
cause (a) criticality of a given infrastructure could be viewed differently among different stakeholders, and (b) stakeholders were the best available source (in this study) to es-timate the capacity to repair non-physical damage to such infrastructure. Analysis of the results suggested rankings from most vulnerable to least vulnerable sectors are the transportation sector, the power sector, the water supply sector and the sewerage
20
system.
1 Introduction
Pacific Islanders have been exposed to risks associated with climate change. Instru-mental measurements and local observations have recorded changes in temperature and precipitation patterns, sea level, coastal erosion, wind dynamics, and the
ma-25
NHESSD
3, 1915–1948, 2015Assessing the vulnerability of infrastructure to climate change on the Islands of Samoa
S. H. M. Fakhruddin
Title Page
Abstract Introduction
Conclusions References
Tables Figures
◭ ◮
◭ ◮
Back Close
Full Screen / Esc
Printer-friendly Version
Interactive Discussion
Discussion
P
a
per
|
Discussion
P
a
per
|
Discussion
P
a
per
|
Discussion
P
a
per
|
2010). Climate change has been adversely affecting the vulnerability of developing economies. The various researches for exposure to vulnerability and reduction of im-pacts of climate change have been deeply analysed (Burton, 1993; Cannon, 1994; Cannon et al., 2003; Dercon, 2001, 2002, 2006; IPCC, 2007; Moser, 1998; Pelling, 2003; Barnett and Adger, 2007; McCarthy, 2001; Smit, 2003; Eakin and Luers, 2006;
5
Bankoffet al., 2004; Füssel and Klein, 2006; Cutter, 2003; Ionescu et al., 2005; Kasper-son et al., 2005). The vulnerability studies shed light on various social and economic factors affecting the societal setup in poor countries (Ibarrarán et al., 2010). The in-creased frequency of natural hazards due to climate change poses more vulnerability to less equipped countries (Downing, 1991). Therefore, it is crucial to understand the
10
system by which climate change, and the implications of such system for current vulner-ability to these climate changes. This enhanced understanding supports the scientific community and the policy makers for underlying the various causes of vulnerability, and provide policy for ameliorating such vulnerability (Adger, 1999).
IPCC explores vulnerability through three core concepts: firstly, “exposure
magni-15
tude” to which a system is physically in harm’s way; secondly, “sensitivity” of a system i.e. its likelihood to be affected by a shock; and thirdly, the “adaptive capacity” of a sys-tem to cope or adjust with the negative impacts of a shock (Barnett and Adger, 2007; McCarthy, 2001; Smit, 2003).
Social vulnerability is defined as the exposure of groups or individuals to stress
20
as a result of social and environmental change, where stress refers to unexpected changes and disruption to livelihoods (Adger, 1999). This definition emphasizes the social dimensions of vulnerability following the tradition of analysis of vulnerability to hazards, food insecurity and as a dimension of entitlements. However, the predominant view is depending upon the physical dimensions of the vulnerability from the impacts
25
of climate change. A system consisting of indicators is set up to analyse the relative vulnerability of given individuals or a societal setup (Adger, 1999).
A model of social vulnerability to reduce the impacts of climate change involves focus on the social aspects of such events. A model for vulnerability should be based
NHESSD
3, 1915–1948, 2015Assessing the vulnerability of infrastructure to climate change on the Islands of Samoa
S. H. M. Fakhruddin
Title Page
Abstract Introduction
Conclusions References
Tables Figures
◭ ◮
◭ ◮
Back Close
Full Screen / Esc
Printer-friendly Version
Interactive Discussion
Discussion
P
a
per
|
Discussion
P
a
per
|
Discussion
P
a
per
|
Discussion
P
a
per
|
on human welfare aspects which leads to the environmental changes induced by the climate change gaining significance as and when they have cause and effect on the relative and absolute well-being of individuals and groups: according to O’Keefe and colleagues (1976), “without people, there is no disaster.”
A theory of vulnerability to climate change must also encompass the collective
na-5
ture of vulnerability of a group or community to the impacts of climate change, involving a complex set of factors, including the institutional arrangements for preparedness for hazards. With greater numbers of social factors involved in collective vulnerability (gen-der, ethnic and other differentials of vulnerability (Blaikie et al., 1994), as well as the nature of different clirelated hazards, an exclusive focus on economic and
mate-10
rial aspects of vulnerability has been argued to be misplaced. These diverse aspects determining vulnerability can be conceptualized as a set of entitlements: it is the struc-ture or architecstruc-ture of these entitlements that underpins both security and vulnerability (Adger and Kelly, 1998; UN/ISDR, 2004; Cardona, 2004; Wisner, 2002; Thywissen, 2006). These potential rights and reciprocal social coping mechanisms and informal
15
social security are fluid and often only exactly determined in times of crisis (Platteau, 1991; Leach et al., 1997; Moser, 1998).
The vulnerability of a system is not only a matter of the number of indicators of the system or individuals in a population who are vulnerable through being exposed to stresses associated with environmental change or not having adaptive capacity. Thus,
20
countries suffering higher losses of lives than others equally exposed have a higher relative vulnerability (Dilley, 2005). By contrast, Venezuela, Afghanistan and Somalia are countries with a high relative vulnerability to floods (UNDP, 2004). According to Birkman (2007) the applicability of relative vulnerability measures worldwide is proved to be possible. There could be radical shifts in the classification of a country’s relative
25
NHESSD
3, 1915–1948, 2015Assessing the vulnerability of infrastructure to climate change on the Islands of Samoa
S. H. M. Fakhruddin
Title Page
Abstract Introduction
Conclusions References
Tables Figures
◭ ◮
◭ ◮
Back Close
Full Screen / Esc
Printer-friendly Version
Interactive Discussion
Discussion
P
a
per
|
Discussion
P
a
per
|
Discussion
P
a
per
|
Discussion
P
a
per
|
2 Climate vulnerability in Samoa
Samoa is comprised of two large volcanic islands (Upolu and Savai’i) and several smaller islands with a total land area of approximately 2935 km2. It lies in the southwest Pacific within an exclusive economic zone of 120 000 km2(GoS, 2013).
Samoa’s islands are highly vulnerable to impacts from climate change, such as sea
5
level rise, increased incidents of extreme events including flooding from storm surges, and tsunami inundation (SPCR, 2011). According to the World Bank, Samoa is ranked 30th of countries most exposed to three or more hazards. Samoa ranked 51st out of 179 countries in the Global Climate Risk Index 2012 report on countries that suffers most from extreme weather events (GoS, 2013). Samoa’s climate is greatly influenced
10
by the El Niño–Southern Oscillation (ENSO). The El Niño phase of ENSO generally brings dry conditions over the island group. In contrast, La Niña tends to bring wetter conditions. The influence of global warming on Samoa results in more frequent and extreme rainfall events, longer dry spells, consistent drought events, hotter days, rising sea levels, extreme winds and extremely high air and water temperatures (Climate Risk
15
Profile, 2007).
Samoa has suffered serious economic shocks caused by natural disasters. For ex-ample, there were severe cyclones in the successive seasons of 1989–1990 (i.e. Ofa) and 1990–1991 (i.e. Val), in addition to the major Cyclone Evan in 2012, which all caused massive damage to infrastructure and other assets (World Bank, 2010). The
20
cyclone killed at least five people and displaced 4763 people. Evan destroyed power plants, cutting power and disrupting communication services; it also destroyed build-ings and roads, damaged vast swaths of crops and caused severe damage and na-tionwide disruption to water facilities and distribution systems. According to the Post Disaster National Assessment (PDNA) (2013), “The total estimated damage and loss
25
on Cyclone Evan are equivalent to about 28 percent of the total value of goods and ser-vices produced in the country in 2011”. The value of durable physical assets across all
NHESSD
3, 1915–1948, 2015Assessing the vulnerability of infrastructure to climate change on the Islands of Samoa
S. H. M. Fakhruddin
Title Page
Abstract Introduction
Conclusions References
Tables Figures
◭ ◮
◭ ◮
Back Close
Full Screen / Esc
Printer-friendly Version
Interactive Discussion
Discussion
P
a
per
|
Discussion
P
a
per
|
Discussion
P
a
per
|
Discussion
P
a
per
|
economic and social sectors destroyed by Evan (referred to as damage) is estimated at USD 103.3 million.
Infrastructure vulnerability to climate change is increasing around the world and Samoa is particularly vulnerable. The whole island population is highly vulnerable to different hazards, but groups facing the highest risks are the rural poor in informal
set-5
tlements, internally displaced people, and those living in marginal areas. Transporta-tion, infrastructure, water, and tourism are sectors sensitive to climate extremes. The expected damage to infrastructure for selected climate change phenomena, for exam-ple high precipitation, cyclones and sea level rise, may result in coastal inundation, flood damage to homes and property, and damage to roads, ports, bridges and other
10
infrastructure. Samoa’s National Adaptation Programme of Action (NAPA) identified nine sectors, which are highly vulnerable to the adverse impacts of climate change and climate variability, including extreme events. The nine sectors listed from highest to lowest vulnerability are water; agriculture and food security; forestry; health; urban set-tlements; coastal environments; communities; trade and industry; and works transport
15
and infrastructure.
The National Infrastructure Strategic Plan (NISP) outlines the government’s priorities and strategic directions for major initiatives in the economic infrastructure sector over the next 5–10 years. In particular, the NISP is closely linked to the Strategy for the Development of Samoa 2008–2012 (SDS). After any disaster, “building-back-better”
20
is often advocated, but unless an appropriate assessment of future extreme events and climate-proof infrastructure is undertaken, the sustainability of that infrastructure remains at greater risk.
This paper is focused on the vulnerability of infrastructure to coastal hazards. Even though the infrastructure framework involves many aspects, this paper focuses only
25
NHESSD
3, 1915–1948, 2015Assessing the vulnerability of infrastructure to climate change on the Islands of Samoa
S. H. M. Fakhruddin
Title Page
Abstract Introduction
Conclusions References
Tables Figures
◭ ◮
◭ ◮
Back Close
Full Screen / Esc
Printer-friendly Version
Interactive Discussion
Discussion
P
a
per
|
Discussion
P
a
per
|
Discussion
P
a
per
|
Discussion
P
a
per
|
concept of vulnerability can be analyzed in three main categories: physical, systemic and organizational/social.
This paper identifies vulnerabilities for key water-related infrastructures. A vulnerabil-ity assessment method has been adopted that need for assessing the climate-related vulnerability of four public infrastructure sectors of Samoan (i.e. water supply,
sewer-5
age, land transport, and power supply), provides an inventory of critical infrastructure for each sector, and ranks those infrastructure systems in terms of their relative vul-nerability to climate-related hazards. The vulvul-nerability assessment used the damage caused by the Cyclone Evan as a baseline proxy. Information on the damage to infras-tructure was readily available from a study conducted by GoS (2013). Interviews were
10
conducted with key stakeholders to identify ongoing initiatives, current gaps in the sys-tem, and possible adaptation options that could be carried out under the project.
3 Methodology
This section outlines the methods implemented to assess the vulnerability of public infrastructure systems and the well being of residents of Samoan to the hazards
dis-15
cussed in the previous section.
Recently the Sydney Environmental Vulnerability Assessment (SEVA) framework was developed (Tonmoy and El-Zein, 2013; Tonmoy et al., 2012) and applied to assess vulnerability to sea level rise (SLR) of public infrastructure systems of a local council (Shoalhaven City Council) in Sydney. It was developed specifically for assessing
vul-20
nerability of infrastructure systems and their users to SLR at a local scale, but can be used for any climate-related hazards. It is an approach where an indicator-based vulnerability model is developed in collaboration with the stakeholders. Involvement of local stakeholders is crucial in order to ensure that the exercise captures the most relevant local contexts. The main objective of this model is to rank a given set of
infras-25
tructure sector indicators based on their climate-related vulnerability. Once the model is developed the overall vulnerability index is developed by aggregation of indicators
NHESSD
3, 1915–1948, 2015Assessing the vulnerability of infrastructure to climate change on the Islands of Samoa
S. H. M. Fakhruddin
Title Page
Abstract Introduction
Conclusions References
Tables Figures
◭ ◮
◭ ◮
Back Close
Full Screen / Esc
Printer-friendly Version
Interactive Discussion
Discussion
P
a
per
|
Discussion
P
a
per
|
Discussion
P
a
per
|
Discussion
P
a
per
|
using one of the mathematical procedures discussed in the following sections. The following section describes the indicator-based vulnerability model developed for this study, its development process, and the mathematical approach used for aggregation of the developed model.
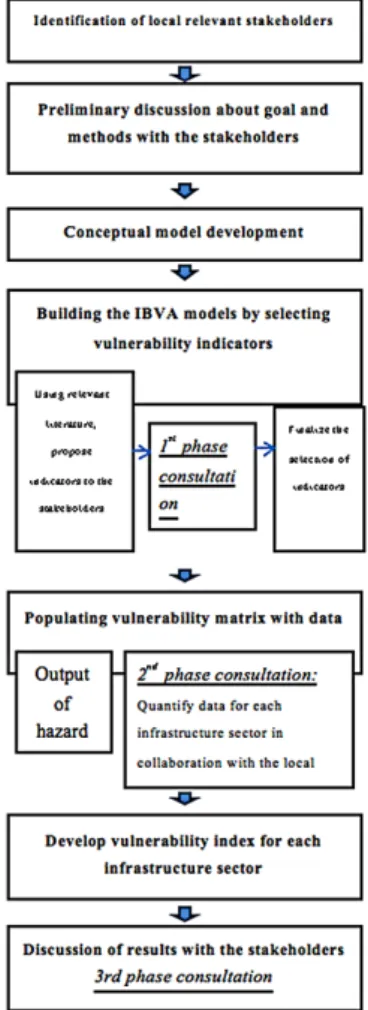
A participatory approach was used for the development of the vulnerability model,
5
as it is essential to engage with local stakeholders to ensure that the most relevant local contexts are captured in the model. Two missions were conducted with the local stakeholders to identify needs and requirements. A detailed step-by-step process of the whole exercise is shown in Fig. 1.
The process flow diagram, shown in Fig. 1, demonstrates the process of assessing
10
the vulnerabilities of infrastructure used in this paper. The assessment started with pre-liminary discussions with local experts regarding their organizational goal, objectives and existing methods used in the study. After reviewing previously conducted hazard studies of Samoan and other relevant literature, a conceptual model of the vulnerability of Samoa was developed. Following this conceptual model, a list of vulnerability
indica-15
tors was proposed to the stakeholders for further consultation (1st phase of consulta-tion), who then selected those that are most relevant in the context of Samoa. Starting from the IPCC definition of vulnerability, the Samoan Infrastructure Vulnerability Model (SIVM) was developed with a focus on the vulnerability of the infrastructure systems of Samoa to climate-related hazards by considering the biophysical, socio-economic and
20
institutional dimension of risk.
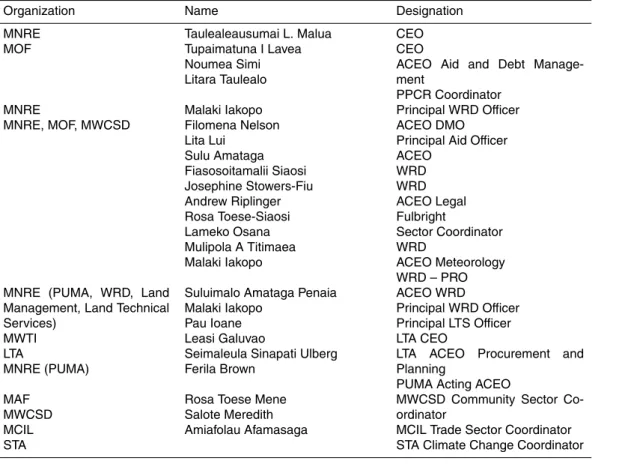
In order to select the most relevant set of indicators for Samoa from the proposed set, the following stakeholders were identified and consulted in the first mission followed by a second mission; Planning and Urban Management Agency (PUMA) for water supply and sanitation; Land Transport Authority (LTA) for transportation and drainage;
Elec-25
NHESSD
3, 1915–1948, 2015Assessing the vulnerability of infrastructure to climate change on the Islands of Samoa
S. H. M. Fakhruddin
Title Page
Abstract Introduction
Conclusions References
Tables Figures
◭ ◮
◭ ◮
Back Close
Full Screen / Esc
Printer-friendly Version
Interactive Discussion
Discussion
P
a
per
|
Discussion
P
a
per
|
Discussion
P
a
per
|
Discussion
P
a
per
|
Once the indicators of the model were finalized, the scores for each indicator of each infrastructure system were estimated in order to populate the vulnerability matrix. This was done in collaboration with the engineers and experts from the respective depart-ments previously identified (2nd phase of the consultation). A 3rd phase of consultation may be required after development of this vulnerability index in order to discuss the
re-5
sults with the stakeholders and to identify whether it differs from their local perception of their vulnerability. The following sections describe the conceptual model as well as the indicators that were finally selected.
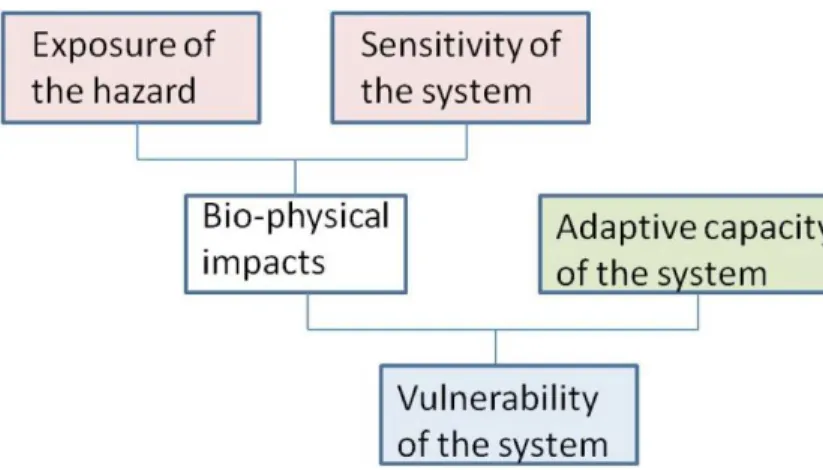
3.1 Conceptual model
One commonly used definition of vulnerability (illustrated in Fig. 2) was presented by
10
the International Panel on Climate Change (IPCC) in its Third Assessment Report (IPCC, 2001), which was adopted for the Samoan context as well:
“[Vulnerability is] the degree to which a system is susceptible to, or unable to cope with, adverse effects of climate change, including climate variability and extremes. Vulnerability is a function of the character, magnitude, and
15
rate of climate variation to which a system is exposed, its sensitivity, and its adaptive capacity” (McCarthy et al., 2001).
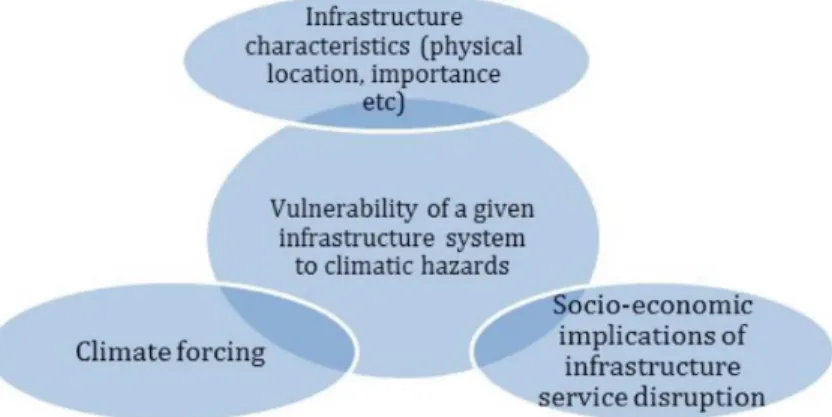
A general conceptual model of an infrastructure sector of the Samoan Islands fol-lowed from this and is shown in Fig. 3. Climatic events (e.g. storm surge, flooding and inundation, etc.) pose certain hazards in Samoa (referred to as “climate forcing”). The
20
impact depends on the characteristics of the infrastructure (e.g. geographic location, physical integrity, etc.). The social, institutional and financial resources that the com-munity has access to are considered as a reflection of its adaptive capacity.
For this vulnerability model, a given infrastructure system (e.g. water supply, trans-portation etc.) is taken as a socio-ecological system which needs to be ranked. A
plau-25
sible cyclone with intensity equivalent to Cyclone Evan is considered as the hazard. The physical integrity of the public infrastructure of a given sector and the well-being
NHESSD
3, 1915–1948, 2015Assessing the vulnerability of infrastructure to climate change on the Islands of Samoa
S. H. M. Fakhruddin
Title Page
Abstract Introduction
Conclusions References
Tables Figures
◭ ◮
◭ ◮
Back Close
Full Screen / Esc
Printer-friendly Version
Interactive Discussion
Discussion
P
a
per
|
Discussion
P
a
per
|
Discussion
P
a
per
|
Discussion
P
a
per
|
of its users were considered as the valued attribute of concern. The vulnerability of the users of a given infrastructure is partly determined by the extent to which the service it provides is critical, and the ability of the service providing authority and/or the users to deploy an alternative to the disrupted service. The overall infrastructure vulnerability of the IS was determined by the physical impact on its infrastructure and the sensitivity
5
of its users to the impacts, minus the capacity of the authority and individuals to cope with those impacts.
3.2 Selecting indicators
Following the definition of the model parameters, indicators were identified through which SIVM could be made operational, i.e. used as a basis for ranking vulnerabilities
10
of the infrastructure system. The selection was conducted in collaboration with govern-ment experts from Samoa.
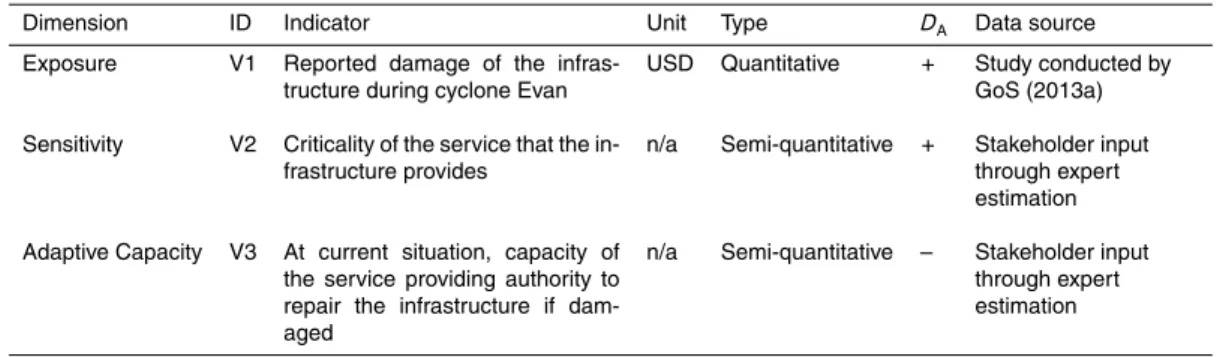
First, “reported damage of the infrastructure during Cyclone Evan” is taken as an indicator of physical exposure of the infrastructure to a climatic hazard (V1). Second, the sensitivity of users of a given infrastructure was captured by expert and stakeholder
15
judgment about the degree to which the disrupted service is critical, i.e. the extent to which it serves a vital function (e.g. from the user’s point of view the water supply may be more vital than sanitation) (V2). Finally, adaptive capacity in this case is reflected by the capacity of the local authority to repair the infrastructure after a possible disruption (V3). The vulnerability indicators of SIVM and scales used for eliciting experts’ and
20
stakeholders’ judgment for V2 and V3 are shown in Tables 1–3.
The infrastructure systems of Samoa were divided into two categories: hard infras-tructure, consisting of water supply, sewerage, land transport infrastructure and power supply infrastructure; and soft infrastructure, consisting of early warning systems and knowledge development programs. Only hard infrastructure components were
consid-25
ered in this study.
NHESSD
3, 1915–1948, 2015Assessing the vulnerability of infrastructure to climate change on the Islands of Samoa
S. H. M. Fakhruddin
Title Page
Abstract Introduction
Conclusions References
Tables Figures
◭ ◮
◭ ◮
Back Close
Full Screen / Esc
Printer-friendly Version
Interactive Discussion
Discussion
P
a
per
|
Discussion
P
a
per
|
Discussion
P
a
per
|
Discussion
P
a
per
|
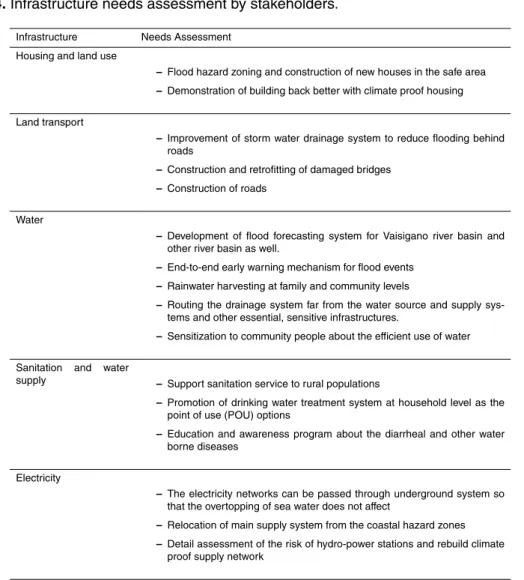
distribution of extreme weather is statistically stationary. This assumption is called into question by climate change, resulting in uncertainty about the future performance of systems constructed under this paradigm. In the context of climate change the sta-tionary hypothesis represents the biggest challenge for the present and the future of infrastructure design. “Climate smart” or “climate proof” infrastructure has been
sug-5
gested, which should be designed based on several scenarios of future climate change and vulnerability assessments at the community level. Based on the consultations with the stakeholders, some of the needs that were identified are summarized in Table 4.
3.3 Modelling and aggregation of indicators
The aggregation of indicators brings together the overall picture of the vulnerability of
10
the system. Additive, weight-based aggregation was adopted in this study. This ap-proach is used widely in the literature for vulnerability studies (Babel et al., 2011; Ebert and Welsch, 2004; Gbetibouo et al., 2010; Moss, 2001; Preston et al., 2008).
Vm= n
X
i=1
WiImi (1)
Here,Vm is the vulnerability of a given infrastructure system (m), n is the number of
15
indicators of the vulnerability model; wi is the weight of importance of a given indicator
i and Imi is the normalized indicator. Normalization is required for bringing different types of indicator data into a common platform where they can be aggregated. There are different techniques of normalization available in the literature. In this study, the following approach was used for normalization.
20
Imi =(Imi−Ii,min)×100
Ii,max−Ii,min
(2)
Here, Imi is the (i) indicator of the mth infrastructure system; Ii,min=min(Imi) and
Ii,max=max(Imi).
NHESSD
3, 1915–1948, 2015Assessing the vulnerability of infrastructure to climate change on the Islands of Samoa
S. H. M. Fakhruddin
Title Page
Abstract Introduction
Conclusions References
Tables Figures
◭ ◮
◭ ◮
Back Close
Full Screen / Esc
Printer-friendly Version
Interactive Discussion
Discussion
P
a
per
|
Discussion
P
a
per
|
Discussion
P
a
per
|
Discussion
P
a
per
|
4 Results
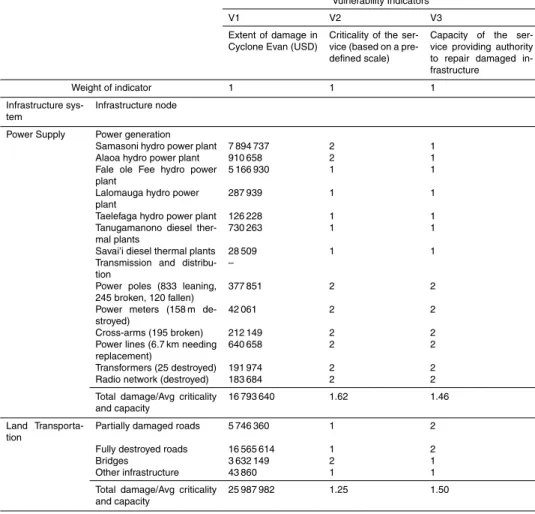
Table 5 shows the values of the indicators of the SIVM for each of the infrastructure components that were collected for the sources mentioned in Table 1. One of the ob-jectives of this study was to assess relative vulnerability of the infrastructure systems of Samoa. In order to achieve that, vulnerability indices were developed using the
meth-5
ods stated in the previous section (Table 7). It should be noted that, vulnerability indices were created for the whole infrastructure system only, NOT for individual infrastructure components. For V1, collected damage data of different infrastructure components of a given infrastructure system were summed to get the total reported damage of the sec-tor. V2 and V3 are ordinal variables; therefore, values of all infrastructure components
10
of a system were averaged to get the representative value of the system (e.g. average of all V2 of the 20 components of water supply system was taken as the V2 of the water supply system, see Table 6). These values were then normalized and converted into indices using the Eqs. (1) and (2). In the case of V3 (which is the lower the more vulnerable), 100−Imi were used. This was done to ensure that all of the time high index
15
value indicates high vulnerability.
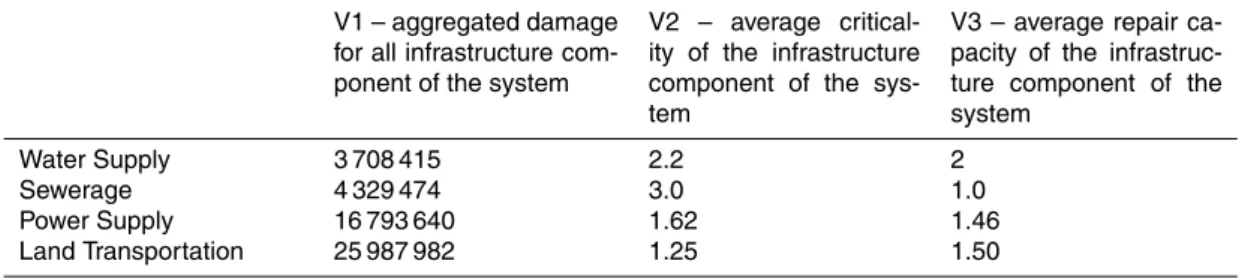
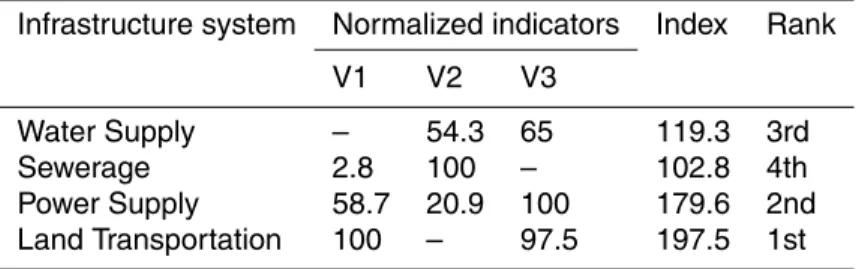
The results of the vulnerability assessment of Samoa’s key infrastructure systems suggest that land transportation is the most vulnerable infrastructure sector of Samoa. The damage cost of this sector is almost double that of the power supply sector and seven times higher than the water supply sector. Although stakeholders considered
20
sewerage the most critical of the infrastructure services, its comparatively lower dam-age cost and the higher capacity of the local authority to fix any damdam-age, make it the least vulnerable infrastructure sector. Even after having a lower damage cost than the power supply sector, the water supply sector was ranked more vulnerable than power supply. This is mainly because water supply infrastructure is regarded as more
criti-25
NHESSD
3, 1915–1948, 2015Assessing the vulnerability of infrastructure to climate change on the Islands of Samoa
S. H. M. Fakhruddin
Title Page
Abstract Introduction
Conclusions References
Tables Figures
◭ ◮
◭ ◮
Back Close
Full Screen / Esc
Printer-friendly Version
Interactive Discussion
Discussion
P
a
per
|
Discussion
P
a
per
|
Discussion
P
a
per
|
Discussion
P
a
per
|
4.1 Water supply sector
The Samoa Water Authority (SWA), a Public Trading Body, is the major water service provider in Samoa. Its water service networks cover the urban and rural regions of Up-olu, Savaii and Manono Islands. A number of people, however, are receiving their water supply exclusively from wells, springs and rainwater reservoirs. With fewer skilled
pro-5
fessionals in rural areas, it is frequently difficult to maintain these private water supply systems.
The Alaoa water treatment plant has the 3rd highest customer base and is the most exposed of the water supply infrastructure network. During Cyclone Evan, USD 2.3 million worth of damage was done to it. Stakeholders also suggested it to be
10
very a critical asset. Therefore, this is one of the most vulnerable infrastructure compo-nents of the water supply system. Other water treatment plants of Tafitoala and Tiavi and Malololelei are also exposed, and incurred almost USD 0.5 million damage during Cyclone Evan. However, the number of people served by these treatments plants is not as high as Alaoa. On the other hand, Fuluasou and Fuluasou water treatment plants
15
have the highest number of users (3900 and 2779, respectively), and are less exposed (damage during Evan was comparatively lower).
Most of the water supply infrastructure was originally constructed by the local vil-lages and consist of above-ground pipe work that has been put together with whatever fittings, tools, and pipes available at the time of construction. The alignment of pipe
20
work typically follows the river, making the pipes highly vulnerable to natural disasters.
4.2 Sewerage system
About 89 % of the population in Samoa has access to improved sanitation facilities (GoS, 2011). Quality of water is the main driver of sanitation in every settlement. Water quality is affected by poor sanitation, stagnation and sedimentation. Heavy rainfall and
25
inadequate drainage mean that flooding is a frequent problem, compounded by land filling and the blocking of drains. Intense flooding causes breaking of the sewerage
NHESSD
3, 1915–1948, 2015Assessing the vulnerability of infrastructure to climate change on the Islands of Samoa
S. H. M. Fakhruddin
Title Page
Abstract Introduction
Conclusions References
Tables Figures
◭ ◮
◭ ◮
Back Close
Full Screen / Esc
Printer-friendly Version
Interactive Discussion
Discussion
P
a
per
|
Discussion
P
a
per
|
Discussion
P
a
per
|
Discussion
P
a
per
|
pipes and the contaminated water spills out to the surface, which poses a public health risk as seepage and latrine runoffcontaminate supplies.
Samoa’s sewerage system was ranked as the least vulnerable infrastructure sys-tem among the four considered in this study. Sanitation syssys-tems located at urban Apia seems most exposed to the climatic hazards as the maximum amount of damage
oc-5
curred in this area during Evan. On the other hand, although North West Upolu has the maximum number of properties with private sanitation system, this area had compara-tively less damage during Evan.
Vulnerability of off-site sanitation seems to be robust as there were no damages reported from the SWA-managed WTP in Sogi, though two wastewater pump stations
10
at Aggie Grey’s Hotel were reported to be completely destroyed (GoS, 2013). Only minimal damages were reported at the sludge treatment facility at Tafaigata and the two public toilet facilities in Sogi and Eleele-fou, though both facilities were closed down following the cyclone due to lack of water supply.
One thing that should be noted is that stakeholders identified the sanitation and
15
sewerage system as the most critical infrastructure. However, the repair capacity of the local authority of such infrastructure is very high. Comparatively lower damage cost and higher repair capacity resulted in comparatively lower vulnerability of the sanitation and sewerage system than the other three sectors of Samoa.
4.3 Power supply sector
20
The country has been producing 12 MW of electricity through renewable resources, which is 29.27 % of its total capacity (WorldBank, 2010). Electricity generation on Upolu is a mix of diesel and hydropower generation. The main diesel power station on Upolu is located at Tanugamanono. The remaining hydropower capacity comes from four run-of-river schemes (combined installed capacity 4.5 MW) and one scheme with a reservoir.
25
NHESSD
3, 1915–1948, 2015Assessing the vulnerability of infrastructure to climate change on the Islands of Samoa
S. H. M. Fakhruddin
Title Page
Abstract Introduction
Conclusions References
Tables Figures
◭ ◮
◭ ◮
Back Close
Full Screen / Esc
Printer-friendly Version
Interactive Discussion
Discussion
P
a
per
|
Discussion
P
a
per
|
Discussion
P
a
per
|
Discussion
P
a
per
|
Samoa. These are exaggerated by the extreme heavy rainfall and subsequent flooding, which in turn causes extensive erosion.
Overall, the power sector of Samoa was ranked as the 2nd most vulnerable sector. High exposure of the distribution and transmission system, and moderate criticality and repair capacity of the local authority were attributed to such high vulnerability.
Follow-5
ing Cyclone Evan in 2012, the entire island of Upolu and part of Savai’i were without power. Within one week, power was restored to approximately 10 % of the population of Upolu, and within four weeks, about 60 % were reconnected. Full reconnection was achieved by mid-February 2013. This suggests that the repair capacity of the power sector is relatively higher than the other sectors, which was also reflected in the
stake-10
holders’ response through the V3 of the vulnerability model of this study. On the other hand, power transmission infrastructure is stated to have partial repair capacity, which made them more vulnerable under a climatic hazard than the power generation infras-tructures. Cyclone Evan caused significant damage to three hydropower plants (Sama-soni, Alaoa, and Fale ole Fee) and minor damage to two additional hydropower plants.
15
The cyclone also damaged Upolu’s main Tanugamanono Diesel Power Station.
4.4 Land transport
Samoa’s transport sector includes all modes of transport, including air, sea, and land. In this study only land transport was considered. The two main islands are well served by tar-sealed ring- and cross-island roads. Samoa’s geographically compact nature
20
and its road and shipping network make transport between and within islands relatively easy, thus facilitating access to centralized government services. Approximately 70 % of Samoa’s population lives within one kilometer of the coast and critical infrastructure (hospitals, schools, places of employment, tourist infrastructure, port facilities, power plants, airports, and roads) are located primarily in the coastal zone where roads are
25
extremely important.
Samoa road network faces a range of vulnerability issues (GoS, 2013), as follows:
NHESSD
3, 1915–1948, 2015Assessing the vulnerability of infrastructure to climate change on the Islands of Samoa
S. H. M. Fakhruddin
Title Page
Abstract Introduction
Conclusions References
Tables Figures
◭ ◮
◭ ◮
Back Close
Full Screen / Esc
Printer-friendly Version
Interactive Discussion
Discussion
P
a
per
|
Discussion
P
a
per
|
Discussion
P
a
per
|
Discussion
P
a
per
|
– coastal exposure to sea-level rise, storm surge, and wave action during cyclones and tsunamis
– inland flooding and landslips during extreme rainfall events
– damage from earthquakes
– accelerated pavement deterioration due to extreme weather and rising water
ta-5
bles in some locations.
In general, Samoa’s land transport sector was ranked as the most vulnerable of the infrastructure sectors studied in this report. High exposure of roads and bridges and their associated damage costs are the prime reason behind such a high vulnerability ranking. Cyclone Evan caused about USD 22 million worth of damage to roads and
10
USD 3.6 million to bridges. Criticality of the bridges is high and their repair is also very costly and time consuming.
5 Discussions
Among other vulnerabilities, water-induced vulnerabilities are major threats to the pop-ulation of Samoa. Many studies (i.e. NDMP, 2006–2009; FMAP, 2007–2013, etc.)
in-15
dicate that “floods” as a result of heavy rain are ranked as a “high risk” event for the country. Many coastal areas and river basins worldwide are flood prone due to heavy rainfall and cyclonic storm surge. Keeping the risk of flooding at an acceptable level is an on-going challenge. Nowadays the range of options to mitigate flood risk is be-coming more diverse, varying from non-structural measures, such as early warning
20
systems and zoning, to traditional structural measures, such as levees, dams, flood detention areas and pumping stations. The impact of structural measures on natural processes is large and often results in undesirable side effects, such as land subsi-dence or disturbance of ecosystem functioning and a loss of ecosystem services, with large consequences for local communities.
NHESSD
3, 1915–1948, 2015Assessing the vulnerability of infrastructure to climate change on the Islands of Samoa
S. H. M. Fakhruddin
Title Page
Abstract Introduction
Conclusions References
Tables Figures
◭ ◮
◭ ◮
Back Close
Full Screen / Esc
Printer-friendly Version
Interactive Discussion
Discussion
P
a
per
|
Discussion
P
a
per
|
Discussion
P
a
per
|
Discussion
P
a
per
|
Considering the above rationale, we emphasis the need to strengthen Samoa’s wa-ter supply sector, particularly with reference to the Integrated Wawa-ter Management Plan (IWMP) for the five catchments in the Apia area. Adaptation should not be under-stood as simply implementing the correct technology or practice. It should be part of a coherent, inter-sectorial strategy to reduce climate risk and maintain
sustain-5
able water resources. IWMP is a strategy being recommended here that provides an overall decision-making framework for climate change adaptation in water resources through mainstreaming climate adaptation into its plans. To address the issue of cli-mate risks, the IWMP would need to include a vulnerability and adaptation assessment. An adapted IWMP will enable the Government of Samoa to strengthen the overall
wa-10
ter management plan by considering future climate risk and “ridge-to-reef” approaches being suggested by regional projects to be implemented in the design of water man-agement plans.
The results suggest only the relative vulnerability of the four infrastructure systems of Samoa, not the vulnerability of each individual infrastructure component due to lake of
15
database. There after many others factors hinders the vulnerability assessment such as- the study was designed and implemented using information collected from existing reports; therefore the quality of results of this study is highly dependent on the quality of those reports. Damage to infrastructure was modeled using the reported damage data of Cyclone Evan. An ideal vulnerability study would require a physical hazard
20
mapping of areas under investigation of such a coastal flooding event. However, such a detailed assessment of physical climate risk for Samoa was neither readily available nor within the scope of this report. Therefore, this study adopted the damage caused by Cyclone Evan as a proxy to such investigative work. It can be argued that the use of actual damage data instead of a model based risk assessment data can provide
25
a more realistic approach to the problem. An indicator-based model was used for the vulnerability assessment. Indicators were selected in collaboration with stakeholders in order to make sure that they are relevant for the local context. However, there is a possibility that the study might have missed some other relevant key processes.
NHESSD
3, 1915–1948, 2015Assessing the vulnerability of infrastructure to climate change on the Islands of Samoa
S. H. M. Fakhruddin
Title Page
Abstract Introduction
Conclusions References
Tables Figures
◭ ◮
◭ ◮
Back Close
Full Screen / Esc
Printer-friendly Version
Interactive Discussion
Discussion
P
a
per
|
Discussion
P
a
per
|
Discussion
P
a
per
|
Discussion
P
a
per
|
6 Conclusions
This paper studied the existing available data and reports to assess climate-related vulnerability of four major infrastructure sectors on Samoa. An indicator-based vul-nerability model, SIVM, was developed for this purpose. A range of stakeholders was consulted both at the model development and data collection stages. The study
iden-5
tified some of the critical infrastructure components of each sector and collected data on the vulnerability indicators for each of the sectors. The resulting vulnerability index suggests that the transportation sector is the most vulnerable among the four sectors considered in this study. High physical exposure and comparatively lower capacity to repair the transport infrastructure, such as bridges, accounted for the high
vulnera-10
bility. The power sector of Samoa was ranked as the second-most vulnerable sector, mainly because of the high physical exposure of the power generation and distribution system. The water supply sector was ranked third. Some of the water supply infras-tructures, such as the Alaoa, Tafitoala and Tiavi water treatment plants, were rated as very critical infrastructure; they play a key role in maintaining safe water supply for
15
public use. The sewerage system was ranked the least vulnerable sector. The sewer-age system of Samoa is mainly composed of individual household latrines, which are comparatively easy to repair locally. Based on the results of this vulnerability assess-ment, a list of adaptation options and their possible outcomes were developed through consultation of Government of Samoa. Therefore, considering the current gaps and
20
vulnerabilities of key infrastructure, this report proposes developing a “ridge-to-reef” integrated watershed management plans for the greater Apia area.
Acknowledgements. This paper has been prepared based on the Samoa infrastructure vulner-ability assessment to support the UNDP GEF funded project of “Economy-wide integration 25 of climate change adaptation and DRM/DRR” to reduce vulnerability in Samoan communities
25
NHESSD
3, 1915–1948, 2015Assessing the vulnerability of infrastructure to climate change on the Islands of Samoa
S. H. M. Fakhruddin
Title Page
Abstract Introduction
Conclusions References
Tables Figures
◭ ◮
◭ ◮
Back Close
Full Screen / Esc
Printer-friendly Version
Interactive Discussion
Discussion
P
a
per
|
Discussion
P
a
per
|
Discussion
P
a
per
|
Discussion
P
a
per
|
References
Adger, W. N.: Social vulnerability to climate change and extremes in coastal Vietnam, World Dev., 27, 249–69, 1999.
Adger, W. N.: Vulnerability, Global Environ. Change, 16, 268–281, 2006.
Adger, W. N. and Kelly, P. M.: Social vulnerability to climate change and the architecture of
5
entitlements, Paper presented at IPCC Workshop on Adaptation to Climatic Variability and Change, San Jose, Costa Rica, 29 March–1 April 1998.
Babel, M. S., Pandey, V. P., Rivas, A. A., and Wahid, S. M.: Indicator-based approach for as-sessing the vulnerability of freshwater resources in the Bagmati River Basin, Nepal, Environ. Manage., 48, 1044–1059, doi:10.1007/s00267-011-9744-y, 2011.
10
Bankoff, G., Frerks, G., and Hilhorst, D. (Eds.): Mapping Vulnerability: Disasters Development and People, Earthscan, London, 2004.
Barnett, J. and Adger W. N.: Climate change, human security and violent conflict, Polit. Geogr., 26, 639–655, 2007.
Birkmann, J.: Risk and vulnerability indicators at different scales: applicability, usefulness and
15
policy implications, Environ. Hazards, 7, 20–31, 2007.
Blaikie, P., Cannon, T., Davis, I., and Wisner, B.: At Risk: Natural Hazards, People’s Vulnerability and Disasters, Routledge, London, 1994.
Burton, I. and White, G. F.: The Environment as Hazard, The Guilford Press, New York, 1993. Cannon, T.: Vulnerability analysis and the explanation of natural disasters, in: Disasters
Devel-20
opment and Environment, edited by: Varley, A., John Wiley, Chichester, 13–30, 1994. Cannon, T., Twigg, J., and Rowell, J.: Social Vulnerability, Sustainable Livelihoods and
Disas-ters, DFID, Londres, 2003.
Cutter, S. L.: The vulnerability of science and the science of vulnerability, Ann. Assoc. Am. Geogr., 93, 1–12, 2003.
25
Dercon, S.: Assessing Vulnerability to Poverty, UK Department for International Development, Oxford University, London, 2001.
Dercon, S.: Income risk, coping strategies and safety nets, World Bank Res. Obser., 17, 141– 66, 2002.
Dercon, S.: Vulnerability: a micro perspective, in: Securing Development in an Unstable World,
30
edited by: Bourguignon, F., Pleskovic, B., and van der Gaag, J., World Bank Publications, Washington, D.C., USA, 117–146, 2006.
NHESSD
3, 1915–1948, 2015Assessing the vulnerability of infrastructure to climate change on the Islands of Samoa
S. H. M. Fakhruddin
Title Page
Abstract Introduction
Conclusions References
Tables Figures
◭ ◮
◭ ◮
Back Close
Full Screen / Esc
Printer-friendly Version
Interactive Discussion
Discussion
P
a
per
|
Discussion
P
a
per
|
Discussion
P
a
per
|
Discussion
P
a
per
|
Dilley, M.: Setting priorities: global patterns of disaster risk, Paper of the Scientific Discussion on Extreme Natural Hazards, Royal Society, 26–27 October 2005, London, 2005 (unpublished). Downing, T. E.: Assessing Socioeconomic Vulnerability to Famine: Frameworks, Concepts and
Applications, Research Report 91-1, World Hunger Program, Brown University, Providence, RI, 1991.
5
Eakin, H. and Luers, A. L.: Assessing the vulnerability of social-environmental systems, Annu. Rev. Environ. Resour., 31, 365–394, 2006.
Ebert, U. and Welsch, H.: Meaningful environmental indices: a social choice approach, J. Env-iron. Econ. Manage., 47, 270–283, 2004.
Füssel, H.-M. and Klein, R. J. T.: Climate change vulnerability assessments: an evolution of
10
conceptual thinking, Climatic Change, 75, 301–329, 2006.
Gbetibouo, G. A., Ringler, C., and Hassan, R.: Vulnerability of the South African farming sector to climate change and variability: an indicator approach, Nat. Resour. Forum, 34, 175–187, doi:10.1111/j.1477-8947.2010.01302.x, 2010.
GoS: Samoa National Infrastructure Strategic Plan, Government of Samoa, Apia, Samoa,
15
2011.
GoS: SAMOA: Post-Disaster Needs Assessment, Cyclone Evan, 2012, Apia, Samoa, 2013. Hoegh-Guldberg, O. and Bruno, J. F.: The impact of climate change on the world’s marine
ecosystems, Science, 328, 1523–1528, 2010.
Ionescu, C., Klein, R. J. T., Hinkel, J., Kumar, K. S. K., and Klein, R.: Towards a Formal
Frame-20
work of Vulnerability to Climate Change, NeWater Working Paper 2, Potsdam Institute for Climate Impact Research, Potsdam, 2005.
IPCC: Climate Change 2001: Impacts, Adaptation and Vulnerability, in: Contribution of Work-ing Group II to the Fourth Assessment Report of the Intergovernmental Panel on Cli-mate Change, edited by: McCarthy, J. J., Canziani, O. F., Leary, N. A., Dokken, D. J., and
25
White, K. S., Cambridge University Press, Cambridge, UK, 2001.
IPCC: Contribution of Working Group II to the Fourth Assessment Report of IPCC on Climate Change, Impacts, Adaptations and Vulnerability, Cambridge University Press, 2007.
IPCC: Climate Change 2013: The Physical Science Basis, in: Contribution of Working Group I to the Fifth Assessment Report of the Intergovernmental Panel on Climate Change, edited
30
NHESSD
3, 1915–1948, 2015Assessing the vulnerability of infrastructure to climate change on the Islands of Samoa
S. H. M. Fakhruddin
Title Page
Abstract Introduction
Conclusions References
Tables Figures
◭ ◮
◭ ◮
Back Close
Full Screen / Esc
Printer-friendly Version
Interactive Discussion
Discussion
P
a
per
|
Discussion
P
a
per
|
Discussion
P
a
per
|
Discussion
P
a
per
|
Kasperson, R. E., Dow, K., Archer, E., Caceres, D., Downing, T., Elmqvist, T., Eriksen, S., Folke, C., Han, G., Iyengar, K., Vogel, C., Wilson, K., and Ziervogel, G.: Vulnerable people and places, in: Ecosystems and Human Wellbeing: Current State and Trends, vol. 1, edited by: Hassan, R., Scholes, R., and Ash, N., Island Press, Washington, D.C., 143–164, 2005. McCarthy J. J.: Climate Change 2001: Impacts, Adaptation, and Vulnerability: Contribution of
5
Working Group II to the Third Assessment Report of the Intergovernmental Panel on Climate Change, Cambridge University Press, 2001.
Moser, C. O. N.: The asset vulnerability framework: reassessing urban poverty reduction strate-gies, World Dev., 26, 1–19, 1998.
Moss, R. H., Brenkert, A. L., and Malone, E. L.: Vulnerability to Climate Change: A Quantitative
10
Approach, PNNL-SA-33642, Pacific Northwest National Laboratory, Richland, Washington, 2001.
O’Keefe, P., Westgate, K., and Wisner, B.: Taking the naturalness out of natural disasters, Na-ture, 260, 566–567, 1976.
Pelling, M.: The Vulnerability of Cities: Natural Disasters and Social Resilience, London,
Rout-15
ledge, 2003.
Platteau, J. P.: Traditional systems of social security and hunger insurance: past achievements and modern challenges, in: Social Security in Developing Countries, edited by: Ahmad, E., Dreze, J., Hills, J., and Sen, A., Clarendon, Oxford, 112–170, 1991.
Preston, B. L., Smith, T. F., Brooke, C., Gorddard, R., Measham, T. G., Withycombe, G., and
20
Abbs, D.: Mapping Climate Change Vulnerability in Sydney Coastal Council Group, avail-able at: http://www.csiro.au/resources/SydneyClimateChangeCoastalVulnerability.html (last access: 19 September 2011), 2008.
Smit, B. and Pilifosova, O.: Adaptation to climate change in the context of sustainable develop-ment and equity, Sustain. Dev., 8, 9, 2003.
25
Strategic Programme for Climate Resilience (SPCR): Prepared for the Pilot Programme for Climate Resilience (PPCR), February 2011, available at: http://www.climatefundsupdate.org/ listing/pilot-program-for-climate-resilience (last access: 10 March 2015), 2011.
Thywissen, K.: Core terminology of disaster reduction: a comparative glossary in: Measur-ing Vulnerability to Natural Hazards – Towards Disaster Resilient Societies, edited by:
Birk-30
mann, J., UNU Press, Tokyo, New York, Paris, 2006.
NHESSD
3, 1915–1948, 2015Assessing the vulnerability of infrastructure to climate change on the Islands of Samoa
S. H. M. Fakhruddin
Title Page
Abstract Introduction
Conclusions References
Tables Figures
◭ ◮
◭ ◮
Back Close
Full Screen / Esc
Printer-friendly Version
Interactive Discussion
Discussion
P
a
per
|
Discussion
P
a
per
|
Discussion
P
a
per
|
Discussion
P
a
per
|
Tonmoy, F. N. and El-Zein, A.: SEVA: a non-linear mathematical framework for climate change vulnerability assessment, Paper presented at the 20th International Congress on Modelling and Simulation (MODSIM2013), 2 December 2013, Adelaide, 2013.
Tonmoy, F. N., El-Zein, A., Ghetti, I., and Massie, R.: Vulnerability to sea level rise of 8 beaches in Shoalhaven: a new multi-dimensional assessment methodology, Paper presented at the
5
21st NSW Coastal Conference, Kiama, New South Wales, Australia, 2012.
United Nations International Strategy for Disaster Reduction (UN/ISDR): Living with Risk, a Global Review of Disaster Reduction Initiatives, 2004 version, UN Publications, Geneva, 2004.
United Nations Development Programme (UNDP): Reducing Disaster Risk, a Challenge For
10
Development a Global Report, UNDP – Bureau for Crisis Prevention and Recovery (BRCP), New York, available at: http://www.preventionweb.net/files/1096_rdrenglish.pdf (last access: 10 March 2015), 2004.
Webb, A. P. and Kench, P. S.: The dynamic response of reef islands to sea-level rise: evidence from multi-decadal analysis of island change in the Central Pacific, Global Planet. Change,
15
72, 234–246, 2010.
Wisner, B.: Who?, What?, Where?, When?, in an emergency: notes on possible indicators of vulnerability and resilience: by phase of the disaster management cycle and social actor, in: Environment and Human Security: Contributions to a Workshop in Bonn, 23–25 Octo-ber 2002, Bonn, Germany, edited by: Plate, E., 12/7–12/14, 2002.
20
NHESSD
3, 1915–1948, 2015Assessing the vulnerability of infrastructure to climate change on the Islands of Samoa
S. H. M. Fakhruddin
Title Page
Abstract Introduction
Conclusions References
Tables Figures
◭ ◮
◭ ◮
Back Close
Full Screen / Esc
Printer-friendly Version
Interactive Discussion
Discussion
P
a
per
|
Discussion
P
a
per
|
Discussion
P
a
per
|
Discussion
P
a
per
|
Table 1.Vulnerability indicators of SIVM.
Dimension ID Indicator Unit Type DA Data source
Exposure V1 Reported damage of the infras-tructure during cyclone Evan
USD Quantitative + Study conducted by GoS (2013a)
Sensitivity V2 Criticality of the service that the in-frastructure provides
n/a Semi-quantitative + Stakeholder input through expert estimation
Adaptive Capacity V3 At current situation, capacity of the service providing authority to repair the infrastructure if dam-aged
n/a Semi-quantitative – Stakeholder input through expert estimation
DA=Direction:+(−) indicates that vulnerability increases (decreases) with increasing indicator. n/a=Not Applicable.
NHESSD
3, 1915–1948, 2015Assessing the vulnerability of infrastructure to climate change on the Islands of Samoa
S. H. M. Fakhruddin
Title Page
Abstract Introduction
Conclusions References
Tables Figures
◭ ◮
◭ ◮
Back Close
Full Screen / Esc
Printer-friendly Version
Interactive Discussion
Discussion
P
a
per
|
Discussion
P
a
per
|
Discussion
P
a
per
|
Discussion
P
a
per
|
Table 2.Scales used for all V2 for all infrastructure systems.
Description Scale
Extremely Critical – as set failure is unacceptable. The conse-quences are so serious that they cannot be tolerated under any cir-cumstances
3
Critical – the consequences of failure may be tolerated provided the risk of failure is as low as reasonably practicable.
2
Non-Critical – consequences of asset failure are acceptable 1
NHESSD
3, 1915–1948, 2015Assessing the vulnerability of infrastructure to climate change on the Islands of Samoa
S. H. M. Fakhruddin
Title Page
Abstract Introduction
Conclusions References
Tables Figures
◭ ◮
◭ ◮
Back Close
Full Screen / Esc
Printer-friendly Version
Interactive Discussion
Discussion
P
a
per
|
Discussion
P
a
per
|
Discussion
P
a
per
|
Discussion
P
a
per
|
Table 3.Scales used for all V3 for infrastructure system.
Description Scale
Full capacity to repair 3 Partial capacity to repair 2 Cannot repair with existing capacity 1
NHESSD
3, 1915–1948, 2015Assessing the vulnerability of infrastructure to climate change on the Islands of Samoa
S. H. M. Fakhruddin
Title Page
Abstract Introduction
Conclusions References
Tables Figures
◭ ◮
◭ ◮
Back Close
Full Screen / Esc
Printer-friendly Version
Interactive Discussion
Discussion
P
a
per
|
Discussion
P
a
per
|
Discussion
P
a
per
|
Discussion
P
a
per
|
Table 4.Infrastructure needs assessment by stakeholders.
Infrastructure Needs Assessment
Housing and land use
–Flood hazard zoning and construction of new houses in the safe area
–Demonstration of building back better with climate proof housing
Land transport
–Improvement of storm water drainage system to reduce flooding behind roads
–Construction and retrofitting of damaged bridges
–Construction of roads
Water
–Development of flood forecasting system for Vaisigano river basin and other river basin as well.
–End-to-end early warning mechanism for flood events
–Rainwater harvesting at family and community levels
–Routing the drainage system far from the water source and supply sys-tems and other essential, sensitive infrastructures.
–Sensitization to community people about the efficient use of water
Sanitation and water
supply –Support sanitation service to rural populations
–Promotion of drinking water treatment system at household level as the point of use (POU) options
–Education and awareness program about the diarrheal and other water borne diseases
Electricity
–The electricity networks can be passed through underground system so that the overtopping of sea water does not affect
–Relocation of main supply system from the coastal hazard zones
NHESSD
3, 1915–1948, 2015Assessing the vulnerability of infrastructure to climate change on the Islands of Samoa
S. H. M. Fakhruddin
Title Page
Abstract Introduction
Conclusions References
Tables Figures
◭ ◮
◭ ◮
Back Close
Full Screen / Esc
Printer-friendly Version
Interactive Discussion
Discussion
P
a
per
|
Discussion
P
a
per
|
Discussion
P
a
per
|
Discussion
P
a
per
|
Table 5.Vulnerability raw data based on stakeholders weighted.
Vulnerability Indicators
V1 V2 V3
Extent of damage in Cyclone Evan (USD)
Criticality of the ser-vice (based on a pre-defined scale)
Capacity of the ser-vice providing authority to repair damaged in-frastructure
Weight of indicator 1 1 1
Infrastructure sys-tem
Infrastructure node
Water Supply Afiamalu 1167 2 2
Malololelei 448 659 2 2
Vailima 5852 2 2
Alaoa 2 331 690 3 2
Maagiagi 219 956 2 2
Vaivase-Uta 758 2 2
Fagalii-Uta 197 2 2
Vailele 921 2 2
Tapatapao 8604 2 2
Fuluasou JR 62 982 2 2
Fuluasou EU 12 800 2 2
Aleisa – 2 2
Lefaga 21 930 2 2
Tafitoala and Tiavi 578 513 3 2
Togitogiga 8772 2 2
Piu – 2 2
Lepa – 2 2
Lano 1316 2 2
Aleipata 3026 2 2
Faleapuna 1272 2 2
Total damage/Avg critical-ity and capaccritical-ity
3 708 415 2.1 2.0
Sewerage 5040 Number of damaged onsite sanitation facility
4 290 000 3 1
SWA sewerage system 39 474 3 1
Total damage/Avg critical-ity and capaccritical-ity
4 329 474 3 1
NHESSD
3, 1915–1948, 2015Assessing the vulnerability of infrastructure to climate change on the Islands of Samoa
S. H. M. Fakhruddin
Title Page
Abstract Introduction
Conclusions References
Tables Figures
◭ ◮
◭ ◮
Back Close
Full Screen / Esc
Printer-friendly Version
Interactive Discussion
Discussion
P
a
per
|
Discussion
P
a
per
|
Discussion
P
a
per
|
Discussion
P
a
per
|
Table 5.Continued.
Vulnerability Indicators
V1 V2 V3
Extent of damage in Cyclone Evan (USD)
Criticality of the ser-vice (based on a pre-defined scale)
Capacity of the ser-vice providing authority to repair damaged in-frastructure
Weight of indicator 1 1 1
Infrastructure sys-tem
Infrastructure node
Power Supply Power generation
Samasoni hydro power plant 7 894 737 2 1
Alaoa hydro power plant 910 658 2 1
Fale ole Fee hydro power plant
5 166 930 1 1
Lalomauga hydro power plant
287 939 1 1
Taelefaga hydro power plant 126 228 1 1 Tanugamanono diesel
ther-mal plants
730 263 1 1
Savai’i diesel thermal plants 28 509 1 1 Transmission and
distribu-tion
–
Power poles (833 leaning, 245 broken, 120 fallen)
377 851 2 2
Power meters (158 m de-stroyed)
42 061 2 2
Cross-arms (195 broken) 212 149 2 2
Power lines (6.7 km needing replacement)
640 658 2 2
Transformers (25 destroyed) 191 974 2 2 Radio network (destroyed) 183 684 2 2
Total damage/Avg criticality and capacity
16 793 640 1.62 1.46
Land Transporta-tion
Partially damaged roads 5 746 360 1 2
Fully destroyed roads 16 565 614 1 2
Bridges 3 632 149 2 1
Other infrastructure 43 860 1 1
Total damage/Avg criticality and capacity
NHESSD
3, 1915–1948, 2015Assessing the vulnerability of infrastructure to climate change on the Islands of Samoa
S. H. M. Fakhruddin
Title Page
Abstract Introduction
Conclusions References
Tables Figures
◭ ◮
◭ ◮
Back Close
Full Screen / Esc
Printer-friendly Version
Interactive Discussion
Discussion
P
a
per
|
Discussion
P
a
per
|
Discussion
P
a
per
|
Discussion
P
a
per
|
Table 6.Vulnerability matrix for the 4-infrastructure system considered in this study.
Infrastructure system Indicator values for the whole system
V1 – aggregated damage for all infrastructure com-ponent of the system
V2 – average critical-ity of the infrastructure component of the sys-tem
V3 – average repair ca-pacity of the infrastruc-ture component of the system
Water Supply 3 708 415 2.2 2
Sewerage 4 329 474 3.0 1.0
Power Supply 16 793 640 1.62 1.46
Land Transportation 25 987 982 1.25 1.50
NHESSD
3, 1915–1948, 2015Assessing the vulnerability of infrastructure to climate change on the Islands of Samoa
S. H. M. Fakhruddin
Title Page
Abstract Introduction
Conclusions References
Tables Figures
◭ ◮
◭ ◮
Back Close
Full Screen / Esc
Printer-friendly Version
Interactive Discussion
Discussion
P
a
per
|
Discussion
P
a
per
|
Discussion
P
a
per
|
Discussion
P
a
per
|
Table 7.Vulnerability indices.
Infrastructure system Normalized indicators Index Rank
V1 V2 V3
Water Supply – 54.3 65 119.3 3rd
Sewerage 2.8 100 – 102.8 4th
NHESSD
3, 1915–1948, 2015Assessing the vulnerability of infrastructure to climate change on the Islands of Samoa
S. H. M. Fakhruddin
Title Page Abstract Introduction Conclusions References Tables Figures ◭ ◮ ◭ ◮ Back Close
Full Screen / Esc
Printer-friendly Version Interactive Discussion Discussion P a per | Discussion P a per | Discussion P a per | Discussion P a per |
Table A1.List of stakeholders interviewed.
Organization Name Designation
MNRE Taulealeausumai L. Malua CEO
MOF Tupaimatuna I Lavea
Noumea Simi Litara Taulealo
CEO
ACEO Aid and Debt Manage-ment
PPCR Coordinator
MNRE Malaki Iakopo Principal WRD Officer
MNRE, MOF, MWCSD Filomena Nelson
Lita Lui Sulu Amataga Fiasosoitamalii Siaosi Josephine Stowers-Fiu Andrew Riplinger Rosa Toese-Siaosi Lameko Osana Mulipola A Titimaea Malaki Iakopo
ACEO DMO Principal Aid Officer ACEO WRD WRD ACEO Legal Fulbright Sector Coordinator WRD ACEO Meteorology WRD – PRO MNRE (PUMA, WRD, Land
Management, Land Technical Services)
Suluimalo Amataga Penaia Malaki Iakopo
Pau Ioane
ACEO WRD
Principal WRD Officer Principal LTS Officer MWTI
LTA
MNRE (PUMA)
Leasi Galuvao
Seimaleula Sinapati Ulberg Ferila Brown
LTA CEO
LTA ACEO Procurement and
Planning
PUMA Acting ACEO MAF
MWCSD MCIL STA
Rosa Toese Mene Salote Meredith Amiafolau Afamasaga
MWCSD Community Sector Co-ordinator
MCIL Trade Sector Coordinator STA Climate Change Coordinator