Waist Circumference Adjusted for Body Mass Index
Dora Romaguera1*, Lars A¨ ngquist2, Huaidong Du3,4, Marianne Uhre Jakobsen5, Nita G. Forouhi6, Jytte Halkjær7, Edith J. M. Feskens8, Daphne L. van der A3, Giovanna Masala9, Annika Steffen10, Domenico Palli9, Nicholas J. Wareham6, Kim Overvad11,12, Anne Tjønneland7, Heiner Boeing10, Elio Riboli1,
Thorkild I. Sørensen2
1Department of Epidemiology and Biostatistics, School of Public Health, Imperial College London, United Kingdom,2Institute of Preventive Medicine, Copenhagen University Hospital, Copenhagen, Denmark,3National Institute for Public Health and the Environment (RIVM), Bilthoven, the Netherlands,4Department of Human Biology, Nutrition and Toxicology Research Institute of Maastricht (NUTRIM), Maastricht, the Netherlands,5Department of Clinical Epidemiology, Aarhus University Hospital, Aalborg, Denmark,6MRC Epidemiology Unit, Institute of Metabolic Science, Addenbrooke9s Hospital, Cambridge, United Kingdom,7Danish Cancer Society, Institute of Cancer Epidemiology, Copenhagen, Denmark,8Division of Human Nutrition, Wageningen University, Wageningen, the Netherlands,9Molecular and Nutritional Epidemiology Unit, ISPO (Cancer Research and Prevention Institute), Florence, Italy,10Department of Epidemiology, German Institute of Human Nutrition, Potsdam-Rehbruecke, Nuthetal, Germany,11Department of Epidemiology, School of Public Health, Aarhus University, Aarhus, Denmark,12Department of Cardiology, Aalborg Hospital, Aarhus University Hospital, Aalborg, Denmark
Abstract
Background:Dietary factors such as low energy density and low glycemic index were associated with a lower gain in abdominal adiposity. A better understanding of which food groups/items contribute to these associations is necessary.
Objective: To ascertain the association of food groups/items consumption on prospective annual changes in ‘‘waist circumference for a given BMI’’ (WCBMI), a proxy for abdominal adiposity.
Design: We analyzed data from 48,631 men and women from 5 countries participating in the European Prospective Investigation into Cancer and Nutrition (EPIC) study. Anthropometric measurements were obtained at baseline and after a median follow-up time of 5.5 years. WCBMIwas defined as the residuals of waist circumference regressed on BMI, and annual change in WCBMI(DWCBMI, cm/y) was defined as the difference between residuals at follow-up and baseline, divided by follow-up time. The association between food groups/items andDWCBMIwas modelled using centre-specific adjusted linear regression, and random-effects meta-analyses to obtain pooled estimates.
Results:Higher fruit and dairy products consumption was associated with a lower gain in WCBMIwhereas the consumption of white bread, processed meat, margarine, and soft drinks was positively associated withDWCBMI. When these six food groups/items were analyzed in combination using a summary score, those in the highest quartile of the score – indicating a more favourable dietary pattern –showed aDWCBMIof 20.11 (95% CI20.09 to 20.14) cm/y compared to those in the lowest quartile.
Conclusion:A dietary pattern high in fruit and dairy and low in white bread, processed meat, margarine, and soft drinks may help to prevent abdominal fat accumulation.
Citation:Romaguera D, A¨ngquist L, Du H, Jakobsen MU, Forouhi NG, et al. (2011) Food Composition of the Diet in Relation to Changes in Waist Circumference Adjusted for Body Mass Index. PLoS ONE 6(8): e23384. doi:10.1371/journal.pone.0023384
Editor:Jose A. L. Calbet, University of Las Palmas de Gran Canaria, Spain
ReceivedApril 5, 2011;AcceptedJuly 15, 2011;PublishedAugust 17, 2011
Copyright:ß2011 Romaguera et al. This is an open-access article distributed under the terms of the Creative Commons Attribution License, which permits unrestricted use, distribution, and reproduction in any medium, provided the original author and source are credited.
Funding:DiOGenes is the acronym of the project "Diet, Obesity and Genes" supported by the European Union (Contract no. FOOD-CT-2005-513946). The study was also supported by a grant from the Danish Strategic Research Council (GENDINOB). The funders had no role in study design, data collection and analysis, decision to publish, or preparation of the manuscript.
Competing Interests:The authors have declared that no competing interests exist.
* E-mail: [email protected]
Introduction
Body mass index (BMI) is commonly used in epidemiological studies as a measure of general adiposity, whereas waist circumference (WC) is an indicator of central adiposity and body fat distribution. Both measures have been associated with the risk of chronic disease morbidity and mortality; however, when WC is adjusted for BMI, this measurement is more strongly related to disease risk than BMI or WC alone, suggesting that this marker
may capture the specific effect of the abdominal fat mass [1,2,3]. Changes in WC have been also positively associated with all-cause mortality in healthy middle-aged men and women after account-ing for concurrent changes in BMI [4].
adiposity [7], then it might be possible that this measure is more sensitive to the effect of dietary factors compared to other measures of general adiposity such as body weight or BMI. In previous observational prospective studies conducted among European adults we have observed that several nutrients were associated with changes of WC and WCBMI; however these
nutrients were not equally associated with changes in weight [8,9,10,11,12]. Specifically, we observed that a diet with a high glycemic index (GI) and high energy density (ED) was significantly associated with an increase in WCBMI. Given these results, we
could speculate that low GI and low ED diets may prevent abdominal fat deposition.
In order to better interpret the effect of foods and diets on abdominal fat deposition, we aimed in the present study at assessing the association between specific food groups/items consumption and changes in WCBMI, i.e. changes in WC that
are independent of concurrent changes in BMI. In addition, we assessed the effect of replacing some food groups/items for others, and the effect of combining several food groups/items on changes in WCBMI.
Methods
Participants
The current study included participants from eight centres in five countries involved in the European Prospective Investigation into Cancer and Nutrition (EPIC) study, participating in the DiOGenes (Diet, Obesity and Genes) project, namely Florence (Italy), Norfolk (UK), Amsterdam, Maastricht and Doetinchem (the Netherlands), Potsdam (Germany), Copenhagen and Aarhus (Denmark). Approval for this study was obtained from the ethical review boards of the International Agency for Research on Cancer (IARC) and from all local institutions where subjects had been recruited for the EPIC study: the Florence Health Authority Ethical Committee (Italy); the Norfolk Local Research Ethics Committee (UK); the Medical Ethics Committee of the lands Organization for Applied Scientific Research (the Nether-lands); the Ethics Committee of the Medical Association of the State of Brandenburg (Germany); and the Danish National Committee on Biomedical Research Ethics (Denmark). Written informed consent was obtained from all participants before joining EPIC study. Detailed information on the study population and data collection of the EPIC study has been described elsewhere [13].
At baseline (between1992–1998), participants filled out exten-sive questionnaires covering their diet, lifestyle, and medical history, and anthropometric measurements were obtained. Updated information on anthropometric data has been obtained from EPIC participants through follow-up examinations during 1998–2005 (median follow-up time 5.5 years). Of the 146,543 participants at baseline, 102,346 participated in the follow-up examination (69.8% response rate). Given that the current study forms part of larger project aiming at looking at gene*diet interactions in the development of abdominal adiposity, we excluded individuals with no blood samples collected (n = 4,048). We also excluded pregnant women (n = 133), those with missing information on diet or anthropometrics (n = 1,266), those in the lowest and highest 1% of the EPIC cohort distribution of the ratio of reported total energy intake: energy requirement (n = 752), individuals with prevalent chronic diseases (cancer, diabetes and/ or cardiovascular disease) at baseline (n = 3,811) and incident chronic diseases during follow-up (n = 5,132), and those with unrealistic anthropometric measurements (n = 115). In order to avoid the variable changes in body composition and shape in old
age and the possible underlying subclinical disease processes that occur with age, we excluded from the analyses participants with age at baseline .60 years or age at follow-up .65 years (n = 31,645). Finally, given the recognized effect of smoking and changes in smoking status on body weight and waist gain, those with missing information on smoking or changing smoking status between baseline and follow-up (n = 7,163) were excluded. In total 48,631 participants (19,694 men and 28,937 women) were included in the analyses (5,081 from Italy; 6,266 from the UK; 6,477 from the Netherlands; 8,661 from Germany; and 22,146 from Denmark).
Dietary assessment
Usual food intakes were measured using country-specific validated food frequency questionnaires [14]. Estimated individual nutrient intakes, including total energy and alcohol, were derived from foods included in the dietary questionnaires through the standardized EPIC Nutrient Data Base (ENDB) [15].
The exposures of interest in this study were the consumption of food groups and specific food items in grams/day as well as the energy provided by these food groups/items (more information on the specific food groups/items in Table 1 and in Table S1).
Anthropometric measurements
At baseline, all participants were measured for weight, height and waist circumference. The methods used have been previously described in detail [16]. In brief, body weight and height were measured when participants wore light clothes and no shoes. Waist circumference was measured either at the midway between the lowest rib and the iliac crest (the Netherlands, and Potsdam-Germany) or at the narrowest torso circumference (the other centres). At follow-up examinations, participants in Norfolk (United Kingdom) and Doetinchem (the Netherlands) were measured by trained technicians using the same protocols as at baseline, whereas other centres provided self-reported data. For the latter, guidance was provided to measure waist circumference as at baseline, except for Denmark in which participants were guided to measure their waist circumference at the umbilicus (the reason for changing the site of measurement was to simplify the measurement instructions for participants).
The validity of the self-reported WC has been assessed in study carried out in 408 men and women from the Danish cohort. A high correlation between the self-reported and technician measured WC was found, but there was some underreporting and rather wide limits of agreement in the comparison. Miss-reporting of WC was associated with baseline BMI (men) and WC (women). It was, however, concluded that the self-reported WC could be used as a proxy for the technician-measured WC in regression analyses of changes in WC if these were adjusted for baseline BMI and WC [17].
Owing to the differences in the methods used to collect anthropometric data at follow-up and the length of follow-up, participants from Doetinchem (the Netherlands) were treated separately from those from Amsterdam and Maastricht (the Netherlands), whereas participants from Copenhagen and Aarhus (Denmark) were combined because no such differences between these two groups existed.
The outcome of interest in the present study was annual change in the phenotype WCBMI(DWCBMIin cm/year). This phenotype
was defined both at baseline (baseline WCBMI) and at follow-up
(follow-up WCBMI) as the residual values from the gender- and
WCBMI– baseline WCBMI) / follow-up time. This method was
used in our previous study [12].
Assessment of other covariates
Information on age, gender, physical activity, educational level, smoking (never, former, and current smoker), menopausal status (premenopausal, peri-menopausal, and postmenopausal status), and use of hormone replacement therapy (yes/no or unknown) was collected through self-administered questionnaires at baseline. Physical activity level was indexed into five categories (inactive, moderately inactive, moderately active, active or unknown) based
on occupational and recreational activities [20]. Educational level was inquired as the highest level of school achieved and participants were classified into primary school and less, technical–professional school, secondary school, university degree, or unknown.
Statistical analyses
The association between dietary variables andDWCBMI(in cm/
year) was modelled using multi-adjusted linear regression analyses: centre-stratified analyses were carried out first, and random-effect meta-analyses were used to evaluate heterogeneity (I2) across study centres, and to obtain pooled estimates of the associations.
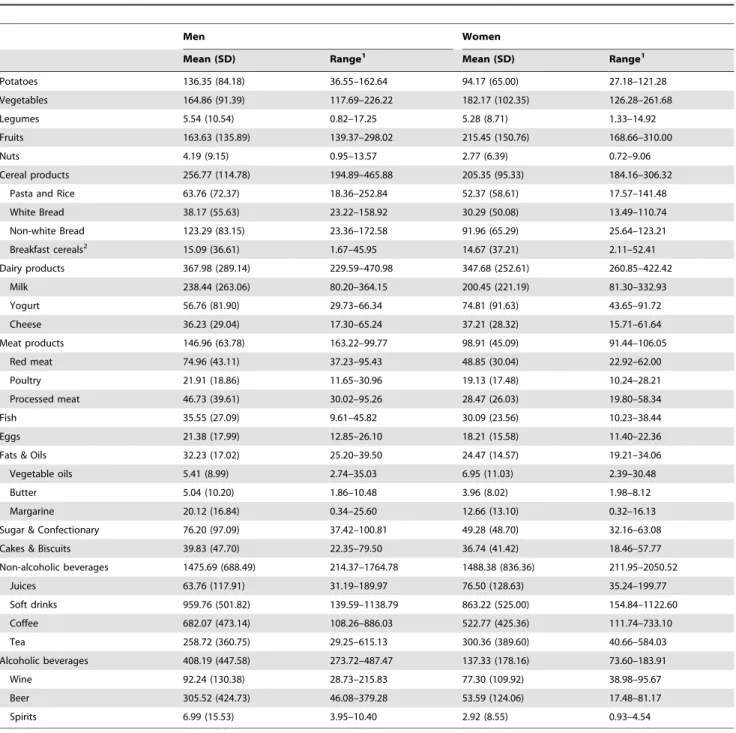
Table 1. Average consumption of food groups/items (g/d) by gender in participants of the EPIC-DiOGenes project (n = 48,631).
Men Women
Mean (SD) Range1 Mean (SD) Range1
Potatoes 136.35 (84.18) 36.55–162.64 94.17 (65.00) 27.18–121.28
Vegetables 164.86 (91.39) 117.69–226.22 182.17 (102.35) 126.28–261.68
Legumes 5.54 (10.54) 0.82–17.25 5.28 (8.71) 1.33–14.92
Fruits 163.63 (135.89) 139.37–298.02 215.45 (150.76) 168.66–310.00
Nuts 4.19 (9.15) 0.95–13.57 2.77 (6.39) 0.72–9.06
Cereal products 256.77 (114.78) 194.89–465.88 205.35 (95.33) 184.16–306.32
Pasta and Rice 63.76 (72.37) 18.36–252.84 52.37 (58.61) 17.57–141.48
White Bread 38.17 (55.63) 23.22–158.92 30.29 (50.08) 13.49–110.74
Non-white Bread 123.29 (83.15) 23.36–172.58 91.96 (65.29) 25.64–123.21
Breakfast cereals2 15.09 (36.61) 1.67–45.95 14.67 (37.21) 2.11–52.41
Dairy products 367.98 (289.14) 229.59–470.98 347.68 (252.61) 260.85–422.42
Milk 238.44 (263.06) 80.20–364.15 200.45 (221.19) 81.30–332.93
Yogurt 56.76 (81.90) 29.73–66.34 74.81 (91.63) 43.65–91.72
Cheese 36.23 (29.04) 17.30–65.24 37.21 (28.32) 15.71–61.64
Meat products 146.96 (63.78) 163.22–99.77 98.91 (45.09) 91.44–106.05
Red meat 74.96 (43.11) 37.23–95.43 48.85 (30.04) 22.92–62.00
Poultry 21.91 (18.86) 11.65–30.96 19.13 (17.48) 10.24–28.21
Processed meat 46.73 (39.61) 30.02–95.26 28.47 (26.03) 19.80–58.34
Fish 35.55 (27.09) 9.61–45.82 30.09 (23.56) 10.23–38.44
Eggs 21.38 (17.99) 12.85–26.10 18.21 (15.58) 11.40–22.36
Fats & Oils 32.23 (17.02) 25.20–39.50 24.47 (14.57) 19.21–34.06
Vegetable oils 5.41 (8.99) 2.74–35.03 6.95 (11.03) 2.39–30.48
Butter 5.04 (10.20) 1.86–10.48 3.96 (8.02) 1.98–8.12
Margarine 20.12 (16.84) 0.34–25.60 12.66 (13.10) 0.32–16.13
Sugar & Confectionary 76.20 (97.09) 37.42–100.81 49.28 (48.70) 32.16–63.08
Cakes & Biscuits 39.83 (47.70) 22.35–79.50 36.74 (41.42) 18.46–57.77
Non-alcoholic beverages 1475.69 (688.49) 214.37–1764.78 1488.38 (836.36) 211.95–2050.52
Juices 63.76 (117.91) 31.19–189.97 76.50 (128.63) 35.24–199.77
Soft drinks 959.76 (501.82) 139.59–1138.79 863.22 (525.00) 154.84–1122.60
Coffee 682.07 (473.14) 108.26–886.03 522.77 (425.36) 111.74–733.10
Tea 258.72 (360.75) 29.25–615.13 300.36 (389.60) 40.66–584.03
Alcoholic beverages 408.19 (447.58) 273.72–487.47 137.33 (178.16) 73.60–183.91
Wine 92.24 (130.38) 28.73–215.83 77.30 (109.92) 38.98–95.67
Beer 305.52 (424.73) 46.08–379.28 53.59 (124.06) 17.48–81.17
Spirits 6.99 (15.53) 3.95–10.40 2.92 (8.55) 0.93–4.54
1The range of exposure was expressed as the minimum and maximum mean consumption observed among the participating centres (Italy-Florence; UK-Norfolk;
Netherlands-Amsterdam/Maastricht; Netherlands-Doetinchem; Germany-Potsdam; Denmark-Copenhagen/Aarhus).
2These calculations were computed after excluding Italy where this food group was not assessed in their FFQ.
The exposures of interest (consumption of food groups/items) were entered in the model as continuous variable per 100 kcal increments in intake, except for coffee and tea consumption, that were entered in the model per 100 g increments due to their very low energy content.
All analyses were adjusted for total energy intake (kcal), baseline age (years), baseline weight (kg), baseline height (cm), baseline WCBMI (cm), smoking, alcohol intake (except for the model
assessing the effect of alcoholic drinks on WCBMIchange), physical
activity, education, and follow-up duration (years). In women, analyses were also adjusted for menopausal status and hormone replacement therapy use.
Analyses were conducted in men and women separately and in both genders combined. Plausible effect modification by gender in the association between food consumption and DWCBMI was
assessed by modelling an interaction term between gender and the exposure of interest; the effect modification by gender was considered significant when the p for interaction was ,0.01 in
$3 out of the 6 study centres.
For the food groups/items for which we found an association with DWCBMI, we constructed several models to ascertain the
effect of substituting one food by one other, as previously described [21]. For that, the two food groups/items of interest were included simultaneously in the multiple adjusted models (per 100 kcal increments). The difference in the coefficients was used to estimate the effect of substituting 100 kcal of one food by 100 kcal of another.
Finally, in order to summarize the combined effect of the food groups/items that were significantly associated withDWCBMIwe
constructed as summary score; for that we divided the consump-tion of these foods in sex-specific tertiles. A score value of 0, 1, or 2 was given to individuals within the first, second and third tertile of consumption of the foods that were inversely associated with
DWCBMI; the scoring was reversed for the foods that were
positively associated withDWCBMI. Thus, individuals with higher
scores were more likely to present a dietary pattern that would prevent gains in WCBMI. The global association of this dietary
pattern withDWCBMIwas assessed by comparing those with low
scores (lower quartile) to those with higher scores (second, third and forth quartile).
It is important to note, both for the substitution models and for the summary scores, that theposthocnature of these tests (since they are selected, based on initial results, among the full set of plausible models) makes it hard to directly interpret their evidential values in the statistical significance sense (e.g. through p-values and confidence intervals). Hence such information may primarily be seen as being of summarizing nature and, in fact, serving as a kind of upper bound for these summary findings.
All statistical analyses were performed with the STATA statistical package 10.0 (College Station TX).
Results
The crude mean (SD) consumption and the range of exposure of food groups/items (in g/d) examined in the present study are shown inTable 1. More information on sex- and centre-specific means (SD) can be found in Table S1.
The consumption of several food groups/items was signifi-cantly associated with DWCBMI in both men and women
(Table 2). Fruit and dairy product consumption was inversely associated with gains in WCBMI; an increment of fruit
consumption of 100 kcal was associated with 20.04 (95% CI
20.05 to 20.03) cm/y lower gain in WCBMI. The DWCBMI
corresponding to 100 kcal increment in dairy products
consumption was20.01 (95% CI 20.02 to 20.01) cm/y. On the other hand, consumption of white bread, processed meat, margarine, and soft drinks were all positively associated with
DWCBMI: DWCBMI corresponding to 100 kcal increment in
consumptions of these food items were: 0.01 (95% CI 0.01 to 0.02) cm/y for white bread, 0.04 (95% CI 0.02 to 0.06) cm/y for processed meat; 0.03 (95% CI 0.01 to 0.05) cm/y for margarine; and 0.04 (95% CI 0.02 to 0.07) cm/y for soft drinks. Several other food groups/items were significantly associated with
DWCBMIin women only and in men and women combined:
vegetables (negative association), potatoes, sugar & confection-ary, beer and spirits (positive association). Finally, some foods were significantly associated with changes in WCBMI only
among women: vegetable oils, tea (negative association), and red meat (positive association). No significant interaction by gender was detected except for beer.
In order to get a more detailed picture of the association of the food composition of the diet on changes in WCBMIwe constructed
several substitution models and summary scores. For that, we only considered the food groups/items that were consistently associated withDWCBMI, i.e. significant associations observed in both men
and women, and no evidence of effect modification by gender. These analyses were conducted in the whole sample (men and women combined). Six food groups/items met these criteria: fruit, dairy product, white bread, processed meat, margarine, and soft drinks.
We analysed the change in the estimate ofDWCBMIobserved
when fruits or dairy products replaced the consumption of white bread, processed meat, margarine, and soft drinks in an iso-caloric diet (Table 3). Regarding dairy products, the largest change in WCBMIwas observed when dairy products substituted soft-drinks:
hence, in an iso-caloric diet, substituting 100 kcal of dairy for100 kcal of soft-drinks was associated with a20.05 (95% CI20.07 to
20.03) cm/y increase in WCBMI. The largest change in WCBMI
observed when fruit consumption replaced the consumption of other food items corresponded also to soft-drinks: when 100 kcal of fruit replaced 100 kcal of soft-drink, the corresponding decrease in WCBMIwas20.08 cm (95% CI20.09 to20.06).
To estimate the global association between a diet that simultaneously combined these six food groups/items and
DWCBMI, we created a summary score of our main results:
participants within the 1st, 2nd, and 3rdsex-specific tertile of fruit and dairy products consumption were given 0, 1, and 2 points respectively; participants within the 1st, 2nd, and 3rdsex-specific tertile of white bread, processed meat, margarine, and soft drinks were given 2, 1, and 0 points respectively. The points given to these six food groups/items were summed, so the overall score range was 0–12 points. The mean (SD) score in the whole sample was 6.00 (2.20). In descending order, the mean (SD) score in each study centre was: 7.11 (1.74) in Italy; 6.35 (2.16) in the UK; 6.07 (2.26) in Denmark; 5.59 (2.06) in the NL-Doetinchem; 5.36 (1.98) in Germany; and 5.28 (2.24) in the NL-Amsterdam/Maastricht (data not shown in tables). The score was divided into four categories according to the distribution in the sample (quartiles): 0–4 points (25.29% of the sample); 5–6 (33.41%); 7–8 (28.05%); and 9–12 (13.24%). Therefore, participants in the highest category were likely to have a diet rich in fruit and dairy products and low in white bread, processed meat, margarine, and soft drinks.
Compared to the first category of the score, those in the second, third, and forth category showed aDWCBMIof20.05 (95% CI
Discussion
In the present study we have observed that among European men and women, a dietary pattern characterized by a high consumption of fruits and dairy products, and a low consumption
of white bread, processed meat, margarine, and soft drinks was associated with a lower gain in WCBMI, i.e. gains in WC that are
independent of concurrent gains in BMI and are likely to represent abdominal fat accumulation. Stronger associations were detected when fruits and dairy products replaced the consumption of white
Table 2. Estimated association between food groups consumption1and annual change in ‘‘waist circumference for a given body mass index (DWCBMI, cm/y)’’.
All Men Women
b2 (95% CI) P b2 (95% CI) P b2 (95% CI) P
Potatoes 0.04 (0.01 to 0.06)* 0.013 0.02 (20.01 to 0.05) 0.120 0.05 (0.01 to 0.09) 0.014
Vegetables 20.08 (20.11 to20.03) ,0.001 20.01 (20.05 to 0.04) 0.687 20.11 (20.17 to20.04) 0.001
Legumes 20.03 (20.17 to 0.12) 0.705 0.06 (20.07 to 0.19) 0.361 20.11 (20.29 to 0.07) 0.247
Fruits 20.04 (20.05 to20.03) ,0.001 20.03 (20.05 to20.02) ,0.001 20.05 (20.07 to20.03) ,0.001
Nuts 0.00 (20.01 to 0.02) 0.809 0.00 (20.02 to 0.03) 0.702 20.00 (20.04 to 0.03) 0.834
Cereal products 20.00 (20.01 to 0.01) 0.944 20.00 (20.01 to 0.01)* 0.666 0.01 (20.00 to 0.01) 0.097
Pasta and Rice 20.02 (20.05 to 0.01)* 0.228 20.02 (20.05 to 0.00) 0.086 20.01 (20.05 to 0.03)* 0.537
White Bread 0.01 (0.01 to 0.02) ,0.001 0.01 (0.00 to 0.02) 0.014 0.01 (0.01 to 0.02) 0.001
Non-white Bread 20.00 (20.01 to 0.00) 0.086 20.01 (20.01 to 0.01) 0.368 20.00 (20.01 to 0.01) 0.535
Breakfast cereals3
20.02 (20.04 to20.00) 0.031 20.01 (20.03 to 0.01) 0.190 20.02 (20.05 to 0.00) 0.088 Dairy products 20.01 (20.02 to20.01) ,0.001 20.01 (20.02 to20.01) ,0.001 20.01 (20.02 to20.01) ,0.001
Milk 20.01 (20.02 to20.00) 0.005 20.01 (20.02 to20.00) 0.013 20.02 (20.03 to20.01) 0.005
Yogurt 20.02 (20.03 to20.01) ,0.001 20.03 (20.053 to20.01) 0.001 20.02 (20.04 to20.01) 0.002
Cheese 20.01 (20.02 to20.00) 0.007 20.01 (20.02 to 0.00) 0.082 20.01 (20.02 to 0.00) 0.073
Meat products 0.02 (0.00 to 0.03)* 0.036 0.02 (20.00 to 0.03)* 0.117 0.02 (0.01 to 0.04)* 0.011
Red meat 0.01 (20.01 to 0.04)* 0.207 0.00 (20.03 to 0.03)* 0.946 0.03 (0.01 to 0.05) 0.004
Poultry 20.02 (20.05 to 0.02) 0.373 0.01 (20.04 to 0.04) 0.815 20.02 (20.06 to 0.02) 0.269
Processed meat 0.04 (0.02 to 0.06)* 0.001 0.02 (0.01 to 0.04) 0.001 0.05 (0.02 to 0.09)* 0.004
Fish 20.05 (20.10 to 0.00)* 0.051 20.04 (20.09 to 0.01)* 0.137 20.05 (20.01 to 0.00)* 0.066
Eggs 0.01 (20.02 to 0.04) 0.670 20.00 (20.04 to 0.04) 0.942 0.01 (20.03 to 0.05) 0.747
Fats & Oils 0.01 (20.01 to 0.03)* 0.167 0.01 (20.01 to 0.02) 0.234 0.02 (20.01 to 0.04)* 0.210
Vegetable oils 20.04 (20.09 to 0.00)* 0.062 20.04 (20.10 to 0.03)* 0.292 20.05 (20.09 to20.01)* 0.020
Butter 20.01 (20.02 to 0.01) 0.451 20.00 (20.02 to 0.01) 0.570 20.01 (20.03 to 0.01) 0.494
Margarine 0.03 (0.01 to 0.05)* 0.001 0.02 (0.00 to 0.04) 0.037 0.03 (0.02 to 0.05) ,0.001
Sugar & Confectionary 0.01 (0.00 to 0.01) 0.013 0.00 (20.01 to 0.01) 0.666 0.01 (0.00 to 0.02) 0.004
Cakes & Biscuits 0.00 (20.01 to 0.01)* 0.909 0.00 (20.01 to 0.01) 0.579 20.00 (20.02 to 0.01)* 0.704
Non-alcoholic beverages 0.01 (20.01 to 0.03) 0.168 0.01 (20.01 to 0.02) 0.322 0.02 (20.01 to 0.04)* 0.252
Juices 20.01 (20.03 to 0.00) 0.100 20.01 (20.02 to 0.01) 0.315 20.02 (20.05 to 0.01) 0.211
Soft drinks 0.04 (0.02 to 0.07)* 0.002 0.02 (0.00 to 0.04) 0.018 0.05 (0.02 to 0.09) 0.007
Coffee 0.00 (20.00 to 0.00) 1.000 0.00 (20.00 to 0.01) 0.139 20.00 (20.01 to 0.00) 0.394
Tea 20.00 (20.01 to 0.00)* 0.110 20.00 (20.01 to 0.01) 0.848 20.01 (20.01 to20.00) 0.018
Alcoholic beverages 0.01 (0.00 to 0.02) 0.001 0.01 (20.00 to 0.01) 0.108 0.02 (0.01 to 0.03) ,0.001
Wine 0.00 (20.01 to 0.01) 0.919 20.00 (20.01 to 0.01) 0.852 0.00 (20.02 to 0.03)* 0.916
Beer4 0.01 (0.00 to 0.02) 0.041 0.01 (20.00 to 0.02) 0.064 0.05 (0.02 to 0.08) 0.002
Spirits 0.04 (0.01 to 0.06) 0.003 0.01 (20.01 to 0.04) 0.320 0.13 (0.04 to 0.22)* 0.007
1The effect of foods was studied per 100 kcal increments in intake, except for coffee and tea that were studied per 100 g increments due to their very low energy
content.
2The association between food consumption andDWC
BMIwas modelled using centre-specific linear regression [adjusting for: total energy intake, age, baseline weight,
baseline height, baseline WCBMI, smoking, alcohol intake (except in the models including alcoholic beverages), physical activity, education, follow-up duration,
menopausal status (women only), and hormone replacement therapy use (women only)], and random-effect meta-analyses to evaluate heterogeneity (I2) across study centres and to obtain pooled estimates of the associations.
*indicates that there is heterogeneity across study centres (Pfor heterogeneity,0.05).
3After excluding Italy where this food group was not assessed in their FFQ.
4Effect modification by gender was considered relevant when the p for interaction between the exposure of interest and gender was,0.01 in$3 out of the 6 study
bread, processed meat, margarine, and soft drinks in an iso-caloric diet, or when these food items were analyzed in combination using a single summary score. Other food groups/items were also significantly associated withDWCBMIamong women (vegetables,
potatoes, sugar & confectionary, beer and spirits, vegetable oils, tea, and red meat).
Strengths of this study include its prospective design; the inclusion of a large sample size of adults from different European countries with diversity in their dietary intakes; the application of a strict exclusion criteria so as to eliminate from the sample participants who may have changed their weight or WC as a results of other factors potentially confounding the effects of diet, but difficult to adjust for (i.e. older individuals, those with prevalent and incident chronic diseases, those with unknown smoking status or changes in their smoking status); and the possibility to control for a large number of plausible confounders. Some limitations should also be considered: the assessment of diet using food frequency questionnaires and the use of self-reported anthropometry are subjected to measurement error. We could not explore the association of specific food groups with
DWCBMI, such as low-fat dairy products, given that this
information was not available. Misreporting of diet is a major concern in epidemiological studies looking at the association between diet and measurements of body fatness; however, in prospective studies it is less likely that weight-dependent bias in reporting the diet influence the prospective change in body composition, when baseline weight and waist are controlled for. Different centres used different techniques for WC measurement. In order to deal with this, each centre was treated as a different cohort, and centre-specific associations were estimated and pooled using random effect meta-analysis in order to capture these differences. Indeed, despite of these differences between centres in their anthropometrical measurements, we observed that all centres showed almost identical effect estimates and hence no evidence of heterogeneity between centres was detected. Finally, anthropo-metric values were self-reported at follow-up in 4 out of the 6 study
Table 3. Estimated annual change in ‘‘waist circumference for a given body mass index (DWCBMI, cm/y)’’ observed when 100 kcal of fruits or 100 kcal of dairy products replaced 100 kcal of white bread, processed meat, margarine, or soft drinks (analyses conducted in men and women combined).
All
b1 (95% CI)
Dairy products replacing2:
White bread 20.02 (20.03 to20.02)
Processed meat 20.04 (20.07 to20.03)
Margarine 20.03 (20.04 to20.03)
Soft drinks 20.05 (20.07 to20.03)
Fruits replacing3:
White bread 20.05 (20.06 to20.05)
Processed meat 20.07 (20.09 to20.06)
Margarine 20.06 (20.06 to20.06)
Soft drinks 20.08 (20.09 to20.06)
1The association between food consumption and
DWCBMIwas modelled using
centre-specific linear regression [adjusting for: total energy intake, age, baseline weight, baseline height, baseline WCBMI, smoking, alcohol intake,
physical activity, education, follow-up duration, menopausal status (women only), and hormone replacement therapy use (women only)], and random-effect meta-analyses to evaluate heterogeneity (I2) across study centres and to obtain pooled estimates of the associations.
2Four models were constructed, all of them including dairy product
consumption (per 100 kcal increments) plus either white bread (model 1), processed meat (model 2), margarine (model 3), or soft drinks (model 4), also in 100 kcal increments.
3Four models were constructed, all of them including fruit consumption (per
100 kcal increments) plus either white bread (model 1), processed meat (model 2), margarine (model 3), or soft drinks (model 4), also in 100 kcal increments. doi:10.1371/journal.pone.0023384.t003
Figure 1. Estimated global association between a summary score reflecting a dietary pattern with a high content of fruit and dairy products, and low content of white bread, processed meat, margarine, and soft drinks and annual change in ‘‘waist circumference for a given body mass index (DWCBMI, cm/y)’’.The association between the quartiles of the summary score (quartile 1 or Q1 is the reference
category) andDWCBMIwas modelled using centre-specific linear regression [adjusting for: total energy intake, age, baseline weight, baseline height,
baseline WCBMI, smoking, alcohol intake, physical activity, education, follow-up duration, menopausal status (women only), and hormone
centres, and this may have introduced some bias due to the selective under-reporting of weight and/or WC among the overweight or the obese. A validation study was conducted in a sub-sample of the Danish cohort to estimate the agreement between the measured and self-reported anthropometric values. Results of this validation study showed a very high correlation between the self-reported and technician measured WC and weight, but there was some degree of miss-reporting associated to both baseline BMI and WC. However, it was concluded that the self-reported measurements could be used a proxy of technician-measured in regression analyses if these were adjusted for baseline BMI and WC [17]. Therefore all our models have been adjusted for baseline measurements. In addition, a recent publication showed similar associations between baseline measured and follow-up self-reported WC and BMI and total mortality, indicating that self-reported anthropometry can predict morality risk as well as the measured values, and therefore self-reported anthropometry can be considered a good proxy measure of obesity for obesity and health association studies [4].
Previous epidemiological studies on this topic were either cross-sectional in nature, included small sample sizes or did not adjust WC changes for concurrent BMI changes; nevertheless, in agreement with the present results, previous research also reported an association between consumption of refined grains and abdominal adiposity [22,23] or BMI-adjusted gains in WC [24]. Higher dairy products intake, dietary calcium and serum vitamin D have been also associated with lower gains in WC [25], weight [26], and with less intra-abdominal adipose tissue accumulation [27]. Similar to our results, a previous study using cluster analyses found that individuals with a dietary pattern characterized by a high consumption of ‘‘white bread’’ showed a greater waist gain compared to individuals within the ‘‘healthy pattern’’ (i.e. rich in fruit, vegetables, reduced-fat dairy, whole grains and low in red and processed meat, fast food, and soda) [28]. Similar associations have been reported among children and adolescents [29].
The dietary pattern associated to lower gain in abdominal obesity observed in this and previous studies, was similar to the Dietary Approaches to Stop Hypertension (DASH)-diet. This diet features high intakes of fruit, vegetables, legumes, and nuts; moderate amounts of low-fat dairy products; and low amounts of animal protein and sweets [30]. This diet was originally designed for blood pressure reduction [31], although it has also been shown to reduce low-density lipoprotein cholesterol levels [32] and the risk of developing chronic diseases such as coronary heart disease [33] or colorectal cancer [34]. An intervention study conducted among individuals with the metabolic syndrome showed that the DASH-diet reduced metabolic risk factors, including their WC after 6 months of intervention [35]. Among diabetic subjects, those allocated to a DASH-diet intervention also reduced significantly their WC more than those allocated to the control diet [36]. Despite a few differences between the dietary factors associated with lower abdominal fat gain in the present study and the DASH-diet (i.e. we did not detect an association between legumes and nuts consumption and
DWCBMI), it seems plausible that dietary patterns similar to the
DASH-diet exert additional effects on abdominal fat deposition, which may in part explain its protective effect against the incidence of chronic diseases associated with obesity.
In a previous study based on the present sample, GI and ED were the only nutritional factors significantly associated with
DWCBMI in both men and women; alcohol, glycemic load, and
fibre also were associated withDWCBMIamong women only [12].
It is then likely that the observed effect of food groups/items
significantly associated with changes in WCBMIwere mediated in
part through these nutritional factors. As expected, fruit and dairy products consumption was significantly and inversely correlated with both ED and GI in the present sample, and white bread, margarine and soft drinks were positively correlated with ED and GI; processed meat consumption was positively correlated with ED and negatively correlated with GI (data not shown). Apart from these nutritional factors, it might be possible that the effect of these food groups/items onDWCBMIis mediated through other
nutrients that were not addressed in the previous study, such as calcium, vitamin D ortrans-fatty acids.
In order to better translate these findings into public health messages that encourage overall healthy diets we constructed a summary score of our results. This summary score should be interpreted with caution given that it is neither a hypothesis oriented score, nor was empirically-deriveda posterioriusing data driven techniques: it was constructed to ascertain the overall combined effect of all the food groups/items associated with
DWCBMI, and hence to take into account the multidimensionality
of diet, correlations between food intakes, as well as plausible cumulative or synergistic effects of these foods onDWCBMI(i.e.
effect of a single food may not be detectable whereas the cumulative effects of multiple foods included in a food pattern may be sufficiently large to be detectable). Overall it was estimated that those following a diet characterized by high fruit and dairy products and low white bread, processed meat, margarine, and soft drinks consumption, would show 1.1 cm less gain in WC for a given gain in BMI during a 10 years period, compared to those with a diet with opposite characteristics; nevertheless, this estimate may have been underestimated due to the measurement error associated with the measurement of both diet and anthropometric changes.
We constructed a second summary score which additionally included potatoes, vegetables, sugary & confectionary, and spirits, as these food groups/items were shown to be associated with
DWCBMIin women and in the whole sample (score range 0-20);
the association between this second summary score andDWCBMI
was similar to that observed using the simpler version of the score in the whole sample; additional effects of the second summary score on WCBMIchanges were detected among women only.
Finally, it was demonstrated that a more pronounced change of
DWCBMIcould be obtained when the foods preventing abdominal
fat gain in the diet replaced the consumption of foods promoting abdominal fat gain.
In conclusion, results from this study suggest that a food composition of the diet characterized by a high consumption of dairy products and fruits and a low consumption of white bread, processed meat, margarine, and soft drinks – similar to the DASH-diet – may help to prevent abdominal fat accumulation among European men and women. In addition, this study supports that a whole dietary pattern incorporating simultaneously several food recommendations may yield further benefits on health – in this case prevention of abdominal fat accumulation, compared to the effect of its single components, and hence recommendations should encourage an overall healthy diet. These results are in concordance with the previously reported protective effect of low GI and ED diets against abdominal fat accumulation.
Supporting Information
‘‘waist circumference for a given body mass index (DWCBMI, cm/
y)’’. The association between the quartiles of the summary score (quartile 1 or Q1 is the reference category) and DWCBMI was
modelled using centre-specific linear regression [adjusting for: total energy intake, age, baseline weight, baseline height, baseline WCBMI, smoking, alcohol intake, physical activity, education,
follow-up duration, menopausal status (women only), and hormone replacement therapy use (women only)], and random-effect meta-analyses to obtain pooled estimates of the associations. (TIF)
Table S1 Consumption of food groups/items (g/d) by gender and centre in participants of the EPIC-DiOGenes project (n = 48,631).
(DOC)
Author Contributions
Conceived and designed the experiments: DR TIS LA¨ . Performed the experiments: DR. Analyzed the data: DR. Contributed reagents/materials/ analysis tools: LA¨ HD MUJ NGF JH EJMF DLvdA GM AS DP NJW KO AT HB ER TIS. Wrote the paper: DR. Overall coordinator of the EPIC study: ER. Had primary responsibility for the final content of the paper: TIS. All co-authors approved the final version of the manuscript.
References
1. Pischon T, Boeing H, Hoffmann K, Bergmann M, Schulze MB, et al. (2008) General and abdominal adiposity and risk of death in Europe. N Engl J Med 359: 2105–2120.
2. Bigaard J, Frederiksen K, Tjonneland A, Thomsen BL, Overvad K, et al. (2005) Waist circumference and body composition in relation to all-cause mortality in middle-aged men and women. Int J Obes (Lond) 29: 778–784.
3. Bigaard J, Tjonneland A, Thomsen BL, Overvad K, Heitmann BL, et al. (2003) Waist circumference, BMI, smoking, and mortality in middle-aged men and women. Obes Res 11: 895–903.
4. Berentzen TL, Jakobsen MU, Halkjaer J, Tjonneland A, Overvad K, et al. (2010) Changes in waist circumference and mortality in middle-aged men and women. PLoS One 5.
5. Iacobellis G, Singh N, Wharton S, Sharma AM (2008) Substantial changes in epicardial fat thickness after weight loss in severely obese subjects. Obesity (Silver Spring) 16: 1693–1697.
6. Busetto L, Tregnaghi A, Bussolotto M, Sergi G, Beninca P, et al. (2000) Visceral fat loss evaluated by total body magnetic resonance imaging in obese women operated with laparascopic adjustable silicone gastric banding. Int J Obes Relat Metab Disord 24: 60–69.
7. Janssen I, Heymsfield SB, Allison DB, Kotler DP, Ross R (2002) Body mass index and waist circumference independently contribute to the prediction of nonabdominal, abdominal subcutaneous, and visceral fat. Am J Clin Nutr 75: 683–688.
8. Du H, van der AD, Boshuizen HC, Forouhi NG, Wareham NJ, et al. (2010) Dietary fiber and subsequent changes in body weight and waist circumference in European men and women. Am J Clin Nutr 91: 329–336.
9. Du H, van der AD, Ginder V, Jebb SA, Forouhi NG, et al. (2009) Dietary energy density in relation to subsequent changes of weight and waist circumference in European men and women. PLoS One 4: e5339.
10. Du H, van der AD, van Bakel MM, Slimani N, Forouhi NG, et al. (2009) Dietary glycaemic index, glycaemic load and subsequent changes of weight and waist circumference in European men and women. Int J Obes (Lond) 33: 1280–1288.
11. Forouhi NG, Sharp SJ, Du H, van der AD, Halkjaer J, et al. (2009) Dietary fat intake and subsequent weight change in adults: results from the European Prospective Investigation into Cancer and Nutrition cohorts. Am J Clin Nutr 90: 1632–1641.
12. Romaguera D, Angquist L, Du H, Jakobsen MU, Forouhi NG, et al. (2010) Dietary determinants of changes in waist circumference adjusted for body mass index - a proxy measure of visceral adiposity. PLoS One 5: e11588. 13. Riboli E, Hunt KJ, Slimani N, Ferrari P, Norat T, et al. (2002) European
Prospective Investigation into Cancer and Nutrition (EPIC): study populations and data collection. Public Health Nutr 5: 1113–1124.
14. Kaaks R, Riboli E (1997) Validation and calibration of dietary intake measurements in the EPIC project: methodological considerations. European Prospective Investigation into Cancer and Nutrition. Int J Epidemiol 26(Suppl 1): S15–25.
15. Slimani N, Deharveng G, Unwin I, Southgate DA, Vignat J, et al. (2007) The EPIC nutrient database project (ENDB): a first attempt to standardize nutrient databases across the 10 European countries participating in the EPIC study. Eur J Clin Nutr 61: 1037–1056.
16. Haftenberger M, Lahmann PH, Panico S, Gonzalez CA, Seidell JC, et al. (2002) Overweight, obesity and fat distribution in 50- to 64-year-old participants in the European Prospective Investigation into Cancer and Nutrition (EPIC). Public Health Nutr 5: 1147–1162.
17. Bigaard J, Spanggaard I, Thomsen BL, Overvad K, Tjonneland A (2005) Self-reported and technician-measured waist circumferences differ in middle-aged men and women. J Nutr 135: 2263–2270.
18. Han TS, Bijnen FC, Lean ME, Seidell JC (1998) Separate associations of waist and hip circumference with lifestyle factors. Int J Epidemiol 27: 422–430.
19. Okosun IS, Choi S, Dent MM, Jobin T, Dever GE (2001) Abdominal obesity defined as a larger than expected waist girth is associated with racial/ethnic differences in risk of hypertension. J Hum Hypertens 15: 307–312.
20. Wareham NJ, Jakes RW, Rennie KL, Schuit J, Mitchell J, et al. (2003) Validity and repeatability of a simple index derived from the short physical activity questionnaire used in the European Prospective Investigation into Cancer and Nutrition (EPIC) study. Public Health Nutr 6: 407–413.
21. Halton TL, Willett WC, Liu S, Manson JE, Stampfer MJ, et al. (2006) Potato and french fry consumption and risk of type 2 diabetes in women. Am J Clin Nutr 83: 284–290.
22. McKeown NM, Troy LM, Jacques PF, Hoffmann U, O’Donnell CJ, et al. (2010) Whole- and refined-grain intakes are differentially associated with abdominal visceral and subcutaneous adiposity in healthy adults: the Framingham Heart Study. Am J Clin Nutr 92: 1165–1171.
23. McKeown NM, Yoshida M, Shea MK, Jacques PF, Lichtenstein AH, et al. (2009) Whole-grain intake and cereal fiber are associated with lower abdominal adiposity in older adults. J Nutr 139: 1950–1955.
24. Halkjaer J, Sorensen TI, Tjonneland A, Togo P, Holst C, et al. (2004) Food and drinking patterns as predictors of 6-year BMI-adjusted changes in waist circumference. Br J Nutr 92: 735–748.
25. Vergnaud AC, Peneau S, Chat-Yung S, Kesse E, Czernichow S, et al. (2008) Dairy consumption and 6-y changes in body weight and waist circumference in middle-aged French adults. Am J Clin Nutr 88: 1248–1255.
26. Shahar DR, Schwarzfuchs D, Fraser D, Vardi H, Thiery J, et al. (2010) Dairy calcium intake, serum vitamin D, and successful weight loss. Am J Clin Nutr 92: 1017–1022.
27. Bush NC, Alvarez JA, Choquette SS, Hunter GR, Oster RA, et al. (2010) Dietary calcium intake is associated with less gain in intra-abdominal adipose tissue over 1 year. Obesity (Silver Spring) 18: 2101–2104.
28. Newby PK, Muller D, Hallfrisch J, Qiao N, Andres R, et al. (2003) Dietary patterns and changes in body mass index and waist circumference in adults. Am J Clin Nutr 77: 1417–1425.
29. Bradlee ML, Singer MR, Qureshi MM, Moore LL (2010) Food group intake and central obesity among children and adolescents in the Third National Health and Nutrition Examination Survey (NHANES III). Public Health Nutr 13: 797–805.
30. Appel LJ, Moore TJ, Obarzanek E, Vollmer WM, Svetkey LP, et al. (1997) A clinical trial of the effects of dietary patterns on blood pressure. DASH Collaborative Research Group. N Engl J Med 336: 1117–1124.
31. Sacks FM, Svetkey LP, Vollmer WM, Appel LJ, Bray GA, et al. (2001) Effects on blood pressure of reduced dietary sodium and the Dietary Approaches to Stop Hypertension (DASH) diet. DASH-Sodium Collaborative Research Group. N Engl J Med 344: 3–10.
32. Obarzanek E, Sacks FM, Vollmer WM, Bray GA, Miller ER, 3rd, et al. (2001) Effects on blood lipids of a blood pressure-lowering diet: the Dietary Approaches to Stop Hypertension (DASH) Trial. Am J Clin Nutr 74: 80–89.
33. Fung TT, Chiuve SE, McCullough ML, Rexrode KM, Logroscino G, et al. (2008) Adherence to a DASH-style diet and risk of coronary heart disease and stroke in women. Arch Intern Med 168: 713–720.
34. Fung TT, Hu FB, Wu K, Chiuve SE, Fuchs CS, et al. (2010) The Mediterranean and Dietary Approaches to Stop Hypertension (DASH) diets and colorectal cancer. Am J Clin Nutr 92: 1429–1435.
35. Azadbakht L, Mirmiran P, Esmaillzadeh A, Azizi T, Azizi F (2005) Beneficial effects of a Dietary Approaches to Stop Hypertension eating plan on features of the metabolic syndrome. Diabetes Care 28: 2823–2831.