F
ACULDADE DE
M
OTRICIDADE
H
UMANA
B
ODY
C
OMPOSITION IN
N
ON
-A
LCOHOLIC
F
ATTY
L
IVER DISEASE
P
ATIENTS
USEFULNESS OF BODY COMPOSITION CLINICAL MARKERS IN THE ASSESSMENT OF BODY FAT
CONTENT AND DISTRIBUTION AND RELATED AUTONOMIC CARDIAC CONTROL
Dissertação com vista à obtenção do grau de Doutor em
Motricidade Humana na especialidade de Atividade Física e Saúde
Orientador: Doutora Maria Helena Santa Clara Pombo Rodrigues
Coorientador: Doutora Helena Maria Ramos Marques Coelho Cortez Pinto
JÚRI:
Presidente: Reitor da Universidade de Lisboa Vogais:
Doutora José Alberto Ramos Duarte, Professora Catedrático da Faculdade de Desporto da Universidade do Porto
Doutor Manuel João Coelho e Silva, Professor Associado com Agregação da Faculdade de Ciências do Desporto e Educação Física da Universidade do Coimbra
Doutora Helena Maria Ramos Marques Coelho Cortez Pinto, Professora Associada com Agregação da Faculdade de Medicina da Universidade de Lisboa
Doutora Maria Isabel Caldas Januário Fragoso, Professora Associada com Agregação da Faculdade de Motricidade Humana da Universidade de Lisboa
Doutora Analiza Mónica Lopes de Almeida Silva, Professora Auxiliar com Agregação da Faculdade de Motricidade Humana da Universidade de Lisboa
Doutora Maria Helena Santa-Clara Pombo Rodrigues, Professora Auxiliar da Faculdade de Motricidade Humana da Universidade de Lisboa
N
UNO
M
ANUEL
Q
UEIROZ
P
IMENTA DE
M
AGALHÃES
Agradecimentos (acknowledgements)
Porque nenhum trabalho desta dimensão pode ser realizado sem a ajuda e o apoio de outras
pessoas e instituições, expresso aqui o meu profundo agradecimento a todas elas. Em primeiro lugar
os meus agradecimentos vão para a minha orientadora, a Professora Doutora Helena Santa-Clara,
pelo seu apoio, amizade, confiança, estímulo, pela forma como acolhe os seus doutorandos e luta por
eles, pela forma como resolve problemas e como transforma questões complicadas em soluções
simples, por ser uma das pessoas mais verdadeiras que conheci, mais fiel a si própria e que eu mais
respeito (ganho e merecido). Em segundo lugar agradeço à minha co-orientadora, a Professora
Doutora Helena Cortez-Pinto (gastroenterologista no Hospital de Santa Maria e Faculdade de
Medicina – Universidade de Lisboa), pelo seu apoio (insubstituível), pela forma como me recebeu
(sem me conhecer de lado nenhum), pela confiança que depositou em mim e por todo o seu esforço
para que este trabalho fosse bem-sucedido, com a qualidade desejada. Agradeço ainda aos
elementos do Júri pela sua disponibilidade.
Agradeço à instituição Escola Superior de Desporto de Rio Maior do Instituto Politécnico de
Santarém (onde desenvolvo a minha atividade profissional desde 2000), em particular aos três
diretores que a ESDRM já teve desde a sua génese: Professores Doutores José Rodrigues, Abel Santos
e Rita Santos Rocha, pelo apoio institucional e ajuda financeira a este projeto de doutoramento.
Agradeço especialmente à minha atual diretora, estimada colega e amiga pessoal Rita Santos Rocha
pela sua confiança continuada no meu trabalho, pelo seu estímulo ao longo do tempo, pela preciosa
colaboração na revisão final do presente documento, e sobretudo pela amizade. Agradeço à
instituição Faculdade de Motricidade Humana da Universidade de Lisboa pelo acolhimento enquanto
estudante de mestrado (2002-2006) e de doutoramento (2008-2014).
Um agradecimento especial também às pessoas que estiveram diretamente envolvidas neste
projeto: ao Professor Doutor Luís Bettencourt Sardinha pelo seu conhecimento, experiência e rigor e
pelo tempo que dedicou para ajudar a elevar sempre o nível do meu trabalho, ao Professor Doutor Bo Fernhall (Dean of the College of Applied Health Sciences – University of Illinois) pelo seu apoio, confiança e rigor científico, ao Dr. José Silva-Nunes (endocrinologista do Hospital Curry Cabral e
doutorando solidário com o presente projeto) pela sua confiança no projeto e pela sua ajuda no
Hospital de Santa Cruz) pela sua paixão à sua profissão, pelo seu voluntarismo e pela sua inestimável
colaboração nas provas de esforço, à Professora Doutora Cristina Bento e a todos os colegas que
colaboraram nas colheitas e acomodação de amostras de sangue e saliva (parâmetros recolhidos no
âmbito do presente projeto mas não tratados nesta tese), e aos colegas de doutoramento Mestre
Xavier Melo, à Professora Doutora Maria da Lapa Rosado, à Professora Doutora Diana Santos, à
Mestre Catarina Matias, às Professoras Doutoras Teresa Tomás e Margarida Carrolo pela
colaboração continuada ao longo do duríssimo processo de recolha de dados e tratamento dos
mesmos. Agradeço igualmente a todos os que voluntariamente participaram na amostra deste
estudo. Um agradecimento ainda aos professores e amigos que, em momentos particulares, terão
sido especialmente importantes para a consecução deste trabalho, à Professora Doutora Isabel
Fragoso, à Professora Doutora Analiza Silva, ao Professor Doutor Francisco Alves, à Professora
Doutora Filomena Carnide, à Professora Doutora Tracy Baynard (Assistant Professor in College of Medicine – University of Ilinois); à Professora Doutora Fátima Batista; ao Professor Doutor Pedro
Teixeira; à Mestre Helo Isa André, e à Professora Doutora Teresa Branco.
Agradeço a todos os Amigos e Colegas da Escola Superior de Desporto de Rio Maior, que me
apoiaram em vários momentos, em particular aos Professores Doutores João Moutão, Susana
Franco, Rita Santos Rocha, Susana Alves, Vera Simões, Félix Romero, David Catela, Teresa Bento,
Luís Cid e aos mestres Fátima Ramalho, Marco Branco, Xavier Melo e Ana Paula Seabra.
Não posso deixar de agradecer às duas instituições onde redigi a quase totalidade do
presente documento, aos seus funcionários e às respetivas câmaras municipais que as governam: a
Biblioteca Municipal Loureano Santos e respetiva Câmara Municipal de Rio Maior, e a Biblioteca
Municipal de Castelo Brancoe respetiva Câmara Municipal de Castelo Branco, um “bem hajam” pelo
acolhimento e pelas excecionais condições de trabalho proporcionadas.
Por último, mas sempre em primeiro lugar, agradeço à minha Família - à minha mulher Sílvia,
aos meus pais Constança e Joaquim, aos meus sogros Amália e Luís, aos meus Irmãos Pedro e João.
Aos meus filhos Manuel e Maria (M&Ms) pelo desafio constante e pelo amor incondicional, e pela
General Index
Agradecimentos (acknowledgements) ... III
Tables Index ... X
Figures Index ... XIII
Thesis abstract ... XIV
Resumo da tese ... XV
List of Abbreviations ... XVI
Chapter 1 – Introduction...1
“Presentation of this thesis, including its main focus and purposes as well as its organization” 1.1. Research rationale ... 2
1.2. Research questions ... 4
1.3. Purposes of this research ... 4
1.4. Outline of this thesis ... 5
1.5. Funding ... 7
Chapter 2 – Review ...9
“Concise review of the literature regarding Non-Alcoholic Fatty liver Disease, body composition and the autonomic nervous system.” 2.1. Non-Alcoholic Fatty Liver Disease ... 10
2.1.1. General Overview of Non-Alcoholic Fatty Liver Disease ... 10
2.2. Body Composition ... 14
2.2.1. Body composition overview ... 14
2.2.2. Body Composition and obesity ... 18
2.2.3. Clinical markers of body composition/obesity ... 19
2.2.3.1. Body mass index ... 19
2.2.3.2. Body circumferences ... 21
2.2.3.3. Alternative body indexes ... 25
2.3. Autonomic Nervous System ... 28
2.3.1. General overview of the human nervous system ... 28
2.3.2. The Autonomic Nervous System Divisions ... 28
2.3.3. Functions of the autonomic nervous system ... 29
2.3.3.1. Cardiac autonomic control ... 30
2.3.3.2. Autonomic nervous system and adipocyte lipid metabolism ... 34
2.3.3.2.1. Autonomic nervous system related endocrine regulation of adipocyte lipid metabolism ...35
2.3.3.2.2. Autonomic nervous system neuronal regulation of adipocyte lipid metabolism ...37
Chapter 3 – Methods ... 41
“Sample, instruments and methods used for the study of body composition and cardiac autonomic control, in the present thesis.” 3.1. Sample ... 42
3.3. Body composition ... 44
3.3.1. Whole and regional body composition assessment ... 44
3.3.2. Body fat distribution ... 47
3.3.3. Anthropometry and body indexes ... 47
3.4. Cardiac Autonomic Control ... 54
3.4.1. Exercise Testing ... 54
3.4.2. Heart rate recovery ... 55
3.5. Statistics ... 55
Chapter 4 – Study 1: ... 57
“Is Body Composition and Body Fat Distribution Related to Cardiac Autonomic Control in Non -Alcoholic Fatty Liver Disease Patients?” Abstract ... 58
4.1. Introduction ... 59
4.2. Methods ... 59
4.3. Results ... 61
4.4. Discussion ... 64
Chapter 5 – Study 2: ... 67
“Which is the Best Waist Circumference Measurement Protocol to use in Non -Alcoholic Fatty Liver Disease Patients?” Abstract ... 68
5.1. Introduction ... 69
5.3. Results ... 71
5.4. Discussion ... 76
Chapter 6 – Study 3: ... 81
“Does Waist Circumference Measurement Protocol Influence the Relation Between Waist-to-Height Ratio and Body Composition in Non -Alcoholic Fatty Liver Disease Patients?” Abstract ... 82
6.1. Introduction ... 83
6.2. Methods ... 83
6.3. Results ... 85
6.4. Discussion ... 87
Chapter 7 – Study 4: ... 91
“Does Waist Circumference Measurement Protocol Used Influences the Relation Between Waisttohip Ratio and Body Fat Content and Distribution in Non -Alcoholic Fatty Liver Disease Patients?” Abstract ... 92
7.1. Introduction ... 93
7.2. Methods ... 93
7.3. Results ... 95
7.4. Discussion ... 98
Chapter 8 – Study 5: ... 103
Abstract ... 104
8.1. Introduction ... 105
8.2. Methods ... 106
8.3. Results ... 107
8.4. Discussion ... 115
Chapter 9 – Conclusions ... 119
“Overall conclusions and recommendations to be drawn from this thesis” 9.1. Strengths and limitations ... 120
9.2. Main Findings ... 121
9.3. Recommendations for future research ... 123
Tables Index
Table 2.1 – Waist circumference measurement landmarks and references. ...22
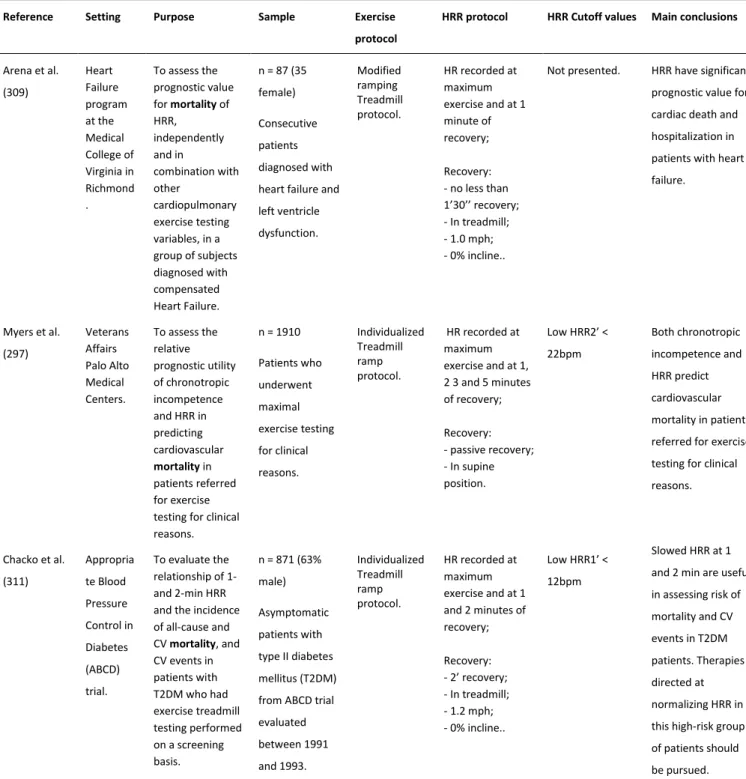
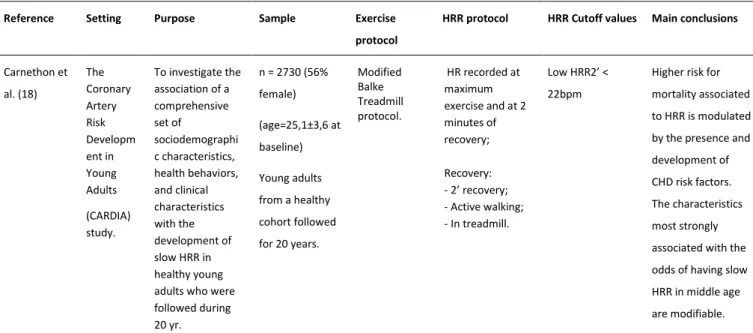
Table 2.2 – Studies examining the usefulness of heart rate recovery as a prognostic marker. ...31
Table 2.2 – Studies examining the usefulness of HRR as a prognostic marker (continuation). ...32
Table 2.2 – Studies examining the usefulness of HRR as a prognostic marker (continuation). ...33
Table 2.2 – Studies examining the usefulness of HRR as a prognostic marker (continuation). ...34
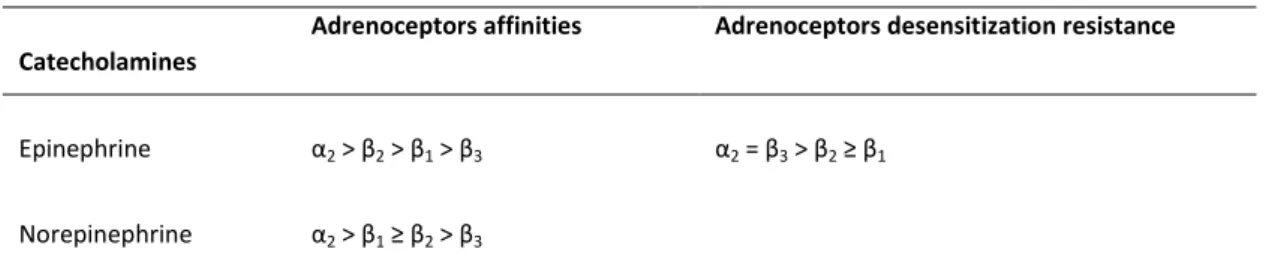
Table 2.3 – Adipocyte adrenoceptors affinities and desensitization characteristics, adapted from Lafontan and colleagues (328). ...36
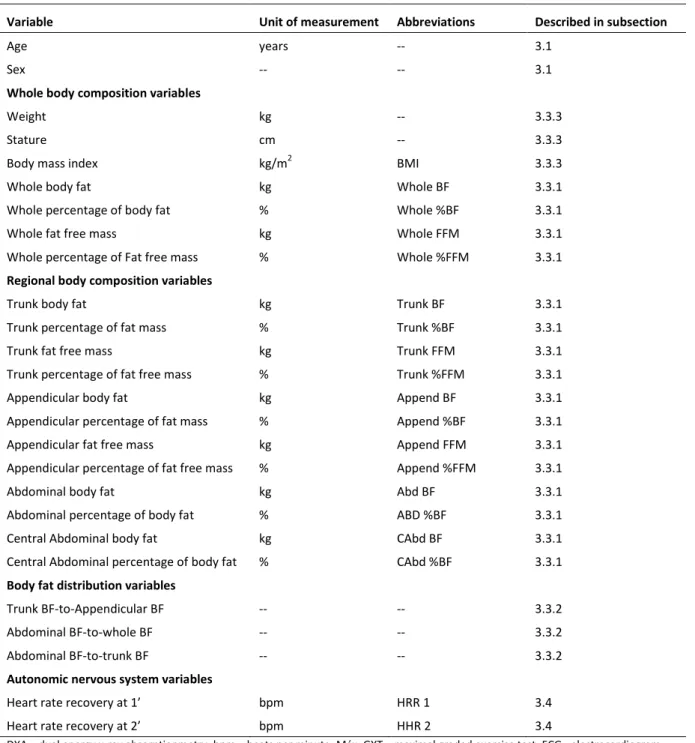
Table 3.1 – Description and coefficients of variation of variables obtained in 18 young adults, using Dual Energy X-ray Absorptiometry. ...46
Table 3.2 – Description of weight measurement ...48
Table 3.3 – Description of height measurement ...49
Table 3.4 – Description of arm circumference measurement ...49
Table 3.5 – Description of waist circumference measurement ...50
Table 3.6 – Description of hip circumference measurement ...51
Table 3.7 – Description of thigh circumference measurement...51
Table 3.8 – Description of calf circumference measurement ...52
Table 3.9 – Established limits for the difference between first and second anthropometric measurements ...53
Table 3.10 – Assessed body indexes ...54
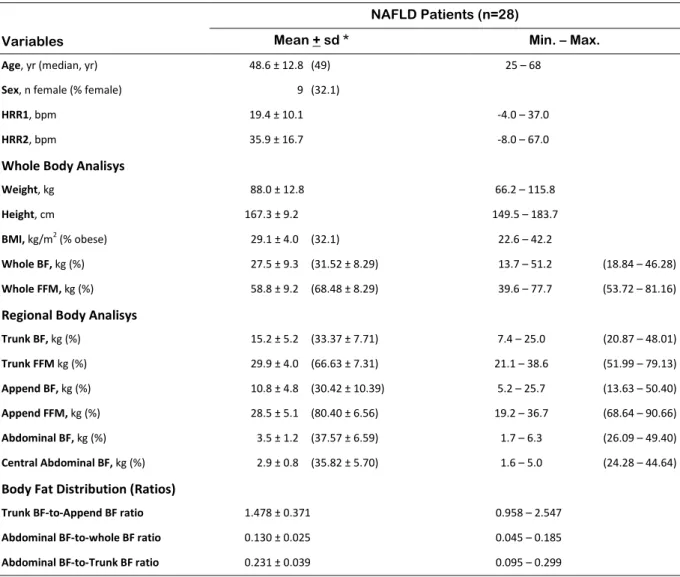
Table 4.2 – Descriptive data of the studied sample in study 1 ...62
Table 4.3 – Partial and semipartial correlations between dependent and independent variables of
study 1 ...63
Table 4.4 – Linear regressions with R square change analysis (Enter method) between dependent and
related independent variables of study 1. ...64
Table 5.1 – List of Studied variables in study 2 ...70
Table 5.2 – Descriptive data of the studied sample in study 2. ...72
Table 5.3 – Mean differences and P values from paired samples T test used in the comparison
between waist circumference results obtained with different measurement protocols. ...73
Table 5.4 – Partial and semipartial correlations between all studied circumferences and body
composition variables of study 2. ...74
Table 5.5 – Z statistic P values for the comparison between correlation coefficients obtained in partial
and semipartial correlations between all studied waist circumferences and the dependent variables,
as expressed in absolute (lower left half of table) and relative (upper right half of the table) values..75
Table 5.6 – Coefficient of variation and time length for measurement of each waist circumference
protocol used in study 2. ...75
Table 6.1 – List of Studied variables in Study 3 ...84
Table 6.2 – Descriptive data of the studied sample in study 3 ...86
Table 6.3 – Partial and semipartial correlations between all studied waist-to-height ratios and body
fat content variables. ...87
Table 6.4 – Z statistic P values for the comparison between the coefficients of correlation obtained in
partial and semipartial correlation between the studied waist-to-height ratios and all dependent
variables. ...88
Table 7.1 – List of Studied variables in study 4 ...94
Table 7.3 – Partial and semipartial correlations between all studied waist-to-hip ratios and body
composition, controlled for age and sex. ...97
Table 7.4 – Partial and semipartial correlations between all studied waist-to-hip ratios and body
composition, controlled for age, sex and BMI. ...98
Table 8.1 – List of Studied variables in study 5 ...107
Table 8.2 – Descriptive data of the studied sample study 5 ...109
Table 8.3 – Partial and semipartial correlations between circumferences and body indexes and body
fat content and distribution, controlled for age and sex. ...110
Table 8.4 – Partial and semipartial correlations between circumferences and body indexes and body
fat content and distribution, controlled for age, sex, and body mass index. ...111
Table 8.5 – Z statistic P values for the comparison between the correlation coefficients obtained in
partial and semipartial correlations, controlled for age and sex, between body mass index and all
dependent variables, and between all studied body circumferences and indexes and the same
dependent variables ...113
Table 8.6 – Z statistic P values for the comparison between the correlation coefficients obtained in
partial and semipartial correlations between all studied body circumferences and indexes and all
dependent variables, controlled for age, sex and body mass index, and the coefficients obtained in
partial and semipartial correlations between body mass index and the same dependent variables,
Figures Index
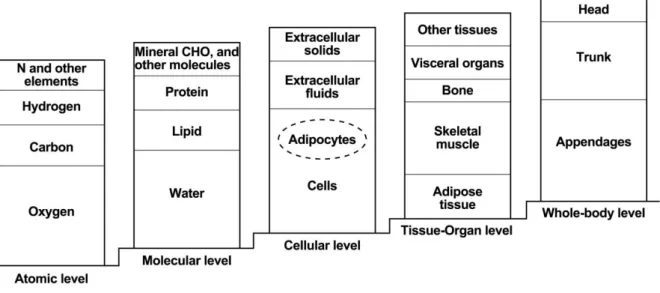
Figure 2.1 – The five-level model in body composition suggested by Wang and colleagues. Adapted
from Shen and colleagues (71), pp 4. ...15
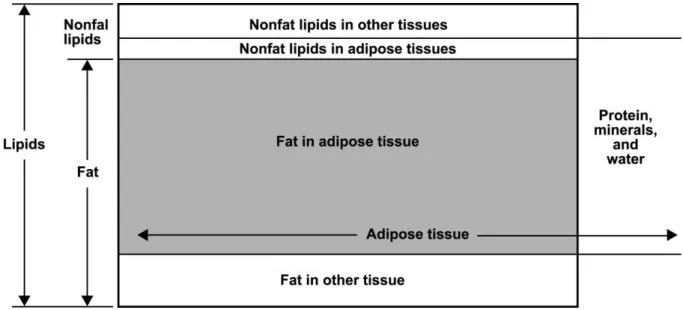
Figure 2.2 – The relationships between molecular-level components lipid and fat and the
tissue-organ-level component adipose tissue. Adapted from Shen and colleagues (71), pp 12. ...16
Figure 3.1 – DXA scan image with marked regions of interest. R1 – region of interest 1, as defined by
the area within the upper edge of the second lumbar vertebra and de lower edge of the fourth
lumbar vertebra.; R2 – region of interest 2 defined as defined as R1 but limited by the rib cage on
both sides. ...45
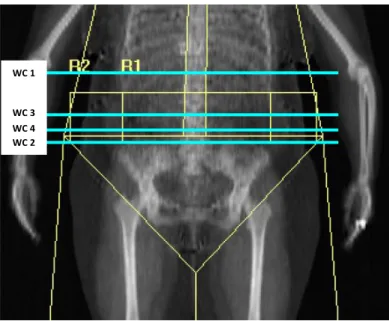
Figure 3.2 – Simulation of waist circumference measuring sites. WC1 – waist circumference
measured at minimal waist; WC2 - waist circumference measured just above iliac crest; WC3 – waist
circumference measured at mid-distance between lowest rib and iliac crest; WC4 – waist
Thesis abstract
The present thesis includes five original studies focusing on body composition (BC) in
non-alcoholic fatty liver disease (NAFLD) patients, mainly in a clinical perspective, directed to clinical
practice. The first study of this thesis aimed at analyzing the relation between body fat (BF) content
and distribution, as assessed by dual energy x-ray absorptiometry (DXA), and cardiac autonomic
control, more specifically with heart rate recovery after a maximal exercise test, which is an indirect
clinical marker of parasympathetic reactivation, also known to be a strong risk factor for overall and
cardiac mortality. The second study focused on the utility of waist circumference (WC) measurement,
as a predictor of both BF content and distribution, and also on the comparison of different WC
measurement protocols based on biological criteria, protocols’ precision and practical criteria, aiming
to identify a preferential measurement protocol to be used in NAFLD patients. The third and fourth
studies focused on the influence of using different WC measurement protocols in the relation of both
waist-to-hip ratio (WHR) and waist-to-height ratio (WHtR) with BF content and distribution, as
assessed by DXA, and aimed to identity a preferable measurement protocol. The fifth study focused
on body indexes and circumferences usefulness as surrogates of BF content and distribution and
aimed at identifying if there is a preferential clinical predictor of both BF content and distribution, as
compared to the commonly used body mass index, in NAFLD patients. The results obtained
confirmed the strong relation between BC and cardiac autonomic control and showed that BF
distribution is more important than BF content in explaining cardiac autonomic control variation. It
was also possible to conclude that WC measured just above the iliac crest seem preferable to be
used in NAFLD patients, either singly or included in body indexes such as WHR or WHtR, mostly due
to practical criteria but also because of it strong correlation with both BF content and distribution.
WHtR appears to be the best BF content and distribution surrogate to be used in clinical practice
with NAFLD patients. WC alone is a good practical alternative, when simplicity and time saving are
Resumo da tese
A presente tese integra cinco investigações originais que se centram no estudo da
composição corporal (CC) em pacientes com doença do fígado gordo não-alcoólico (DFGNA), numa
perspetiva eminentemente clínica e direcionada para a prática. Um primeiro estudo visou analisar a
relação da quantidade e distribuição da massa gorda corporal (MG), avaliada por densitometria por
raio-X de dupla energia (DXA), com o controlo autonómico cardíaco, mais especificamente com um
indicador indireto da reativação do sistema nervoso parassimpático, que é a frequência cardíaca de
recuperação após um esforço máximo, que também é um forte fator de risco para mortalidade. O
segundo estudo visou avaliar a utilidade da medição do perímetro da cintura, isoladamente, como
preditor da quantidade e distribuição de MG, em pacientes com DFGNA, e comparar os resultados e
os procedimentos da medição do perímetro da cintura realizada segundo diferentes protocolos de
medição de modo a identificar um protocolo preferencial. O terceiro e quarto estudo pretenderam
avaliar o impacto da utilização do perímetro da cintura obtido segundo diferentes protocolos de
medição na performance da razão cintura/anca e da razão cintura/altura, enquanto indicadores
clínicos, duplamente indiretos, de quantidade e distribuição de MG. O quinto e último estudo deste
trabalho teve como objetivo avaliar a relação de perímetros e índices corporais com a quantidade e
distribuição de MG, em pacientes com DFGNA, e procurou identificar a existência de alternativas
preferenciais à utilização do índice de massa corporal. Os resultados encontrados no presente
trabalho permitem confirmar que a CC está fortemente relacionada com o controlo autonómico
cardíaco, em pacientes com DFGNA, e que, nessa relação, a distribuição de MG parece ser mais
determinante do que a sua quantidade absoluta e relativa. Também foi possível concluir que o
perímetro da cintura medido imediatamente acima da crista ilíaca parece ser a melhor metodologia
para ser utilizada com esta população, sobretudo por razões de ordem prática, mas também pelo seu
desempenho na relação com quantidade e distribuição de MG, quer quando utilizado isoladamente
como quando integrado em índices corporais, como a razão cintura/ anca ou a razão cintura/ altura.
A razão cintura/altura parece ser a melhor alternativa para ser usada como preditor da quantidade e
distribuição de MG em pacientes DFGNA, sendo que o perímetro da cintura também é uma boa
alternativa sobretudo por razões de ordem prática.
List of Abbreviations
Abd - Abdominal;
ANS - Autonomic nervous system;
Append - Appendicular;
Arm-C - Arm circumference;
BAI - Body adiposity index;
BF - Body fat;
BC - Body composition;
BMI - Body mass index;
CAbd - Central abdominal;
CAD - Coronary artery disease;
Calf-C - Calf circumference;
CAN - Central autonomic network;
CDC - Centers for disease control and prevention;
CHD - Coronary heart disease;
CIPER - Interdisciplinary Center for the Study of Human Performance;
COV - Coefficient of variation;
CRP - C-reactive protein;
CSEP - Canadian Society of Exercise Physiology;
CT - Computed tomography;
CV - Cardiovascular;
CVD - Cardiovascular disease;
DM - Diabetes mellitus;
ECG - Electrocardiogram;
FFM - Fat free mass;
GLUT 4 - Glucose transporter type 4;
GXT - Graded exercise test;
Hip-C - Hip circumference;
HSL - Hormone sensitive lipase;
HR - Heart rate;
HR1 - Heart rate at 1 minute after maximal effort;
HR2 - Heart rate at 2 minute after maximal effort;
HRmax - Maximal heart rate;
HRR - Heart rate recovery;
HRR1 - Heart rate recovery at 1 minute after maximal effort;
HRR2 - Heart rate recovery at 2 minute after maximal effort;
IL-6 - Interleukin 6;
IR - Insulin resistance;
ISAK - International Society for the Advancement of Kinanthropometry;
L4 - Fourth lumbar vertebra;
LabES - Exercise and health laboratory;
LPL - lipoprotein lipase;
NAFLD - Non-alcoholic fatty liver disease;
NASH - Non-alcoholic steatohepatitis;
NEFA - Non esterified fatty acids;
NHANES - National Health and Nutrition Examination Survey;
MONA LISA - Most obesities known are low in sympathetic activity;
MRI - Magnetic resonance imaging;
MRS - Magnetic resonance spectroscopy;
PNS - Parasympathetic nervous system;
ROI - Region of interest;
ROS - Reactive oxygen species;
SNS - Sympathetic nervous system;
T2DM - Type 2 diabetes mellitus;
Thigh-C - Thigh circumference;
TNF-α - Tumor necrosis factor alfa;
VLDL - Very low density lipoprotein;
WC - Waist circumference;
WC1 - Waist circumference measured at the narrowest torso;
WC2 - Waist circumference measured just above iliac crest;
WC3 - Waist circumference measured at the mid distance between iliac crest and lowest rib;
WC4 - Waist circumference measured at the navel;
WCmp - Waist circumference measurement protocol;
WHO - World Health Organization;
WHR - Waist-to-hip ratio;
WHR1 - Waist-to-hip ratio using WC1;
WHR2 - Waist-to-hip ratio using WC2;
WHR3 - Waist-to-hip ratio using WC3;
WHR4 - Waist-to-hip ratio using WC4;
WHtR1 - Waist-to-height ratio using WC1;
WHtR2 - Waist-to-height ratio using WC2;
WHtR3 - Waist-to-height ratio using WC3;
Chapter 1
–
Introduction
“Presentation of this thesis, including its main focus and
purposes as well as its
With the present thesis entitled “Body Composition in Non-Alcoholic Fatty Liver Disease
Patients - Usefulness of Body composition and Fat Distribution Markers and their Relation with
Autonomic Nervous System Cardiac Regulation” (Composição Corporal na Doença do Fígado Gordo
Não-alcoólico – Utilidade de Indicadores de Composição e Distribuição de Gordura corporal e a sua
Relação com a Regulação Cardíaca pelo Sistema Nervoso Autónomo), the author aims to obtain the
Doctoral Degree in Human Kinetics in the specialty of Physical Activity and Health (Doutoramento no
ramo de Motricidade Humana na especialidade de Atividade Física e Saúde) by the Faculty of Human
Kinetics (Faculdade de Motricidade Humana) – University of Lisbon (Universidade de Lisboa),
Portugal. The project for the present thesis was submitted to the Fundação para a Ciência e
Tecnologia – Ministério da Educação e Ciência, for an individual doctoral scholarship, which was
awarded (
SFRH / BD / 41173 / 2007)
. The study was developed and conducted at theInterdisciplinary Center for the Study of Human Performance (CIPER), at the Faculty of Human
Kinetics - University of Lisbon, Portugal.
This work results from the will and effort to contribute to enlighten selected features of
clinical routine assessments of body composition (BC) of patients diagnosed with Non-Alcoholic Fatty
Liver Disease (NAFLD). In order to fulfill this purpose, a mix of laboratory and field methods was used
for the assessment of BC and autonomic nervous system status. The relation of different body fat
(BF) depots and ratios with a selected mortality and cardiovascular risk related autonomic nervous
system marker was assessed, and therefore one perspective of the relevance of BC assessment in
these patients was discussed. The usefulness of clinical methods and specific markers and indexes for
the assessment of BC to use in daily clinical practice with the studied patients was then evaluated
and discussed. Ultimately, suggestions were made concerning the inclusion of selected methods for
efficient assessment of the BC in NAFLD patients in clinical settings.
1.1. Research rationale
NAFLD is an increasingly recognized condition that may progress to end-stage liver disease.
The prevalence of NAFLD is estimated to range up to over 30% of general population in western
countries tough accurate epidemiologic data are still not available in many countries (1-5). If we
consider only the obese population, particularly in abdominal or in morbidly obesity, the prevalence
raises significantly ranging up to 100% (1-3). Because of its’ strong association with obesity, mainly
central obesity, and with impaired glucose metabolism, it is expected that NAFLD will increase
(5, 6). NAFLD is also considered to be the hepatic manifestation of the metabolic syndrome (7), and it
is known that NAFLD patients are at greater cardiovascular risk when compared with the general
population (8).
BC, particularly specific BF distribution adverse phenotypes (central, abdominal or visceral
obesity), may be paramount in the aetiology of metabolic disorders such as NAFLD (9), and is known
to be associated to increased overall and cardiovascular mortality as well as mortality and
cardiovascular risk factors (5, 10-17). Obesity seems to be also somewhat related to important
mortality and cardiovascular risk related autonomic nervous system (ANS) markers (18). As a part of
the human nervous system that has been shown to be responsible for many important metabolic
body functions, including adipocyte, heart and liver functions (19, 20), the ANS may be an important
piece of the puzzle in the understanding of metabolic disorders and may also be an important target
of intervention. Data on the relation of BC and heart rate recovery (HRR), a selected marker of ANS
functioning, is scarce, particularly in subpopulations such as NAFLD patients where it is mostly
absent. Although being utmost important in the study of metabolic disorders, the study of BC is not
much explored in the mentioned subpopulation, plus specific and comprehensive guidelines for the
assessment of BC in NAFLD patients in the clinical setting are lacking. Most often the only BC marker
studied is the body mass index (BMI) which, although easy to measure and proven useful in
epidemiological approaches, has known limitations (21, 22). One important BC surrogate that arises
as a good complement, and possibly an alternative, in BC assessment in clinical settings is the waist
circumference (WC) (17, 23). However it has been difficult to standardize measurement procedures,
particularly concerning the anatomical landmarks for the measurement. Other BC clinical markers
are gaining importance but again, standardization may be a strong impediment for broad
implementation. The recently suggested body adiposity index seems less exposed to the mentioned
standardizations difficulties (24) however it has not yet proven significant predictive superiority as
compared to existing surrogates (25). These limitations may be restraining the implementation of
additional or alternative measures in clinical BC appraisals. Any contribution to enlighten the
mentioned miasmas in the current knowledge may be valuable contribution for the clinical
management and possible prognostic of epidemic metabolic disorders such as NAFLD. Studies
focusing on these miasmas are needed before recommendations and guidelines can be properly
1.2. Research questions
Literature focusing on the study of human BC is abundant but studies focusing on the study
of BC in NAFLD patients are not so. In order to contribute for the understanding of the importance of
BC in NAFLD patients and to increase the information available to support comprehensive guidelines
for BC assessment of NAFLD patients in the clinical setting, we sought to formulate the following
questions:
1 - Is BF content and distribution associated with ANS in NAFLD patients?
2 - What is the best WC measurement protocol to be used in clinical practice as a surrogate
of BF content and distribution in NAFLD patients?
3 - What is the best WC measurement protocol to be used in clinical practice to calculate
waist-to-high ratio as a surrogate whole and regional BF in NAFLD patients?
4 - What is the best WC measurement protocol to be used in clinical practice to calculate
waist-to-hip ratio as a surrogate of BF content and distribution in NAFLD patients’?
5 - What are the best body index and/or circumference to be used in clinical practice as a
surrogate of BF content and distribution in NAFLD patients?
1.3. Purposes of this research
The main purposes of this thesis were to contribute for the understanding of the importance
of BC in NAFLD patients as well as to increase the information available for building comprehensive
guidelines for BC assessment of NAFLD patients in the clinical setting. With this in mind we
formulated the following specific purposes of the present study:
1- To determine if, and to what extent, specific markers of BC and BF distribution, are
related with a selected mortality and cardiovascular risk related ANS marker in NAFLD
patients.
2- To find which of the most used WC measurement protocol is preferable to be used in
3- To analyze whether the most used WC measurement protocol affect the strength of
association between waist-to-height ratio and both, whole and central BF in NAFLD
patients.
4- To analyze whether the most used WC measurement protocol affect the strength of
association between waist-to-hip ratio and BF content and distribution in NAFLD
patients.
5- To analyze how body circumferences and indexes perform as surrogate of whole and
regional BF content and BF distribution in NAFLD patients;
6- To find if any specific body index and/or circumference perform better than the
commonly used body mass index (BMI) as surrogate of BC in NAFLD patients.
1.4. Outline of this thesis
The present thesis is composed of ten chapters, as subsequently presented.
Chapter 1 – Introduction
The introduction presents the rational for the present investigation. The studied problem is disclosed together with the general research questions and purposes of the thesis. The thesis outline is presented and a mention to funding source is also made at the end of this chapter.
Chapter 2 – Review
This chapter presents a succinct review of the literature aiming to display the state of the art concerning the studied topics and to present the biological plausibility of the purposes of this research. This chapter is divided into three main parts. The first part focuses briefly on NAFLD epidemiology, pathophysiology and health consequences. The second part focuses on BC and fat distribution, its´ assessment and implications on health. The third part presents an overview of the ANS, including a general description of its’ structure and function, cardiac regulation and respective interactions on metabolism, including BF regulations and other health and health risks implications.
Chapter 3 – Methods
and then presents the description of the methodology used for patients’ assessment and data record, particularly BC and cardiac autonomic control.
Chapter 4 – Study 1: “Is Body Composition and Body Fat Distribution Related to Cardiac Autonomic Control in Non-Alcoholic Fatty Liver Disease Patients?”
This chapter presents study 1. The aim of this study was to determine if, and to what extent, specific markers of BC and BF distribution, are related with a selected mortality and cardiovascular risk related ANS marker in NAFLD patients. The association of different variables of whole and regional BC as well as ratios between different BF depots, used as BF distribution markers, with HRR, a known cardiac autonomic control marker reflective of parasympathetic reactivation, is analyzed.
Chapter 5 – Study 2: “Which is the Best Waist Circumference Measurement Protocol to use in Non-Alcoholic Fatty Liver Disease Patients?”
This chapter presents study 2. The aim of this study was to find which of the most used WC measurement protocols is preferable to be used in clinical practice with NAFLD patients. Four of the most used protocols to measure WC were tested according to different criteria in the quest of finding which seems best suitable for use in clinical settings with NAFLD patients.
Chapter 6 – Study 3: “Does the Wait Circumference Measurement Protocol Used Influences the Relation Between Waist-to-Height Ratio and Body Composition in Non-Alcoholic Fatty Liver
Disease Patients?”
This chapter presents study 3. The aim of this study was to analyze whether the most used WC measurement protocols affect the strength of association between waist-to-height ratio (WHtR) and both, whole and central BF in NAFLD patients. In the literature WHtR was initially suggested using a specific WC measurement protocol (WCmp) however this ratio has been, most often, calculated using a different WCmp from the initially suggested. In this study four of the most used protocols to measure WC were used to calculate WHtR ratio and the results were compared in their association level with criterion whole and regional BC markers.
Chapter 7 – Study 4: “Does the Waist Circumference Measurement Protocol Used Influences the Relation Between Waist-to-Hip Ratio and Body Fat Content and Distribution in Non-Alcoholic
Fatty Liver Disease Patients?”
to calculate WHR ratio and the results were compared in their association level with criterion whole and regional BC and BF distribution markers.
Chapter 8 – Study 5: “Are Body Indexes and Circumferences useful as Surrogates of Body Fat content and distribution in Non-Alcoholic Fatty Liver Disease Patients as compared with the
commonly used Body Mass Index?”
This chapter presents study 5. The aim of this study was twofold: (1) to analyze how body circumferences and indexes perform as surrogates of whole and regional BF content and BF distribution in NAFLD patients; (2) to find if any specific body index and/or circumference perform better than the commonly used BMI as surrogate of BC in NAFLD patients. The strength of associations between the clinical BC markers, comprising all studied body indexes and circumferences, and criterion BC and BF distribution dependent variables were tested. All correlation coefficients were compared to those obtained using BMI to identify alternative clinical markers.
Chapter 9 – Conclusions
This chapter presents the final conclusions of the present thesis. All studies are linked into one single research project and the main conclusions are presented in three separate sections: the first main conclusions concern the strength and limitations recognized in the overall research that is being presented; secondly the main findings of the present thesis are presented along with the respective practical implications; ultimately some recommendations and future directions of research are presented.
References
This chapter presents all the references cited in the present thesis, listed by order of appearance in the whole document. The references are numbered and cited according to Vancouver normative, which is more common in publications concerning biological and health sciences. The reason for the concentration of all references in the end of the document was to facilitate its’ consultation, instead of spreading the references throughout the document at the end of each chapter.
1.5. Funding
This thesis was funded by the Fundação para a Ciência e Tecnologia – Ministério da Educação
e Ciência, through individual doctoral scholarship (SFRH / BD / 41173 / 2007). This thesis was also
integrated in a research project: Parque de Ciência e Tecnologia do Alentejo - Laboratório de
Investigação em Desporto e Saúde (Unidade de Fisiologia e Biomecânica – Composição Corporal e
School of Rio Maior (ESDRM) and by Health School of Santarém (ESSS) from the Polytechnic Institute
of Santarém (IPS) and co-financed by national funds through the Programa Operacional do Alentejo
2007-2013 (ALENT-07-0262-FEDER-001883), having Nuno Pimenta, MSc, as the researcher in charge.
Chapter 2
–
Review
“Concise review of the literature regarding Non
-Alcoholic Fatty liver Disease,
The present chapter will present the state of the art concerning the studied topics, aims and
instruments of the research being reported. This chapter is divided into three main parts. Firstly we
will present a description of non-alcoholic fatty liver disease (NAFLD), its’ pathophysiology, causes
and consequences, and a characterization of the population diagnosed with this disease. Secondly
we will make a review on body composition (BC) and body fat (BF) distribution, its´ assessment and
implications on health. In the end we will present an overview of the autonomic nervous system
(ANS), including a general description of it’s structure and function, cardiac regulation and its’
interactions on metabolism, including BF regulations and other health and health risks implications.
2.1. Non-Alcoholic Fatty Liver Disease
NAFLD is a rising metabolic condition that is under considerable discussion. Excess BF and
particular BF accumulation patterns seem to be strongly linked to NAFLD and possibly play an
important role in the disease aetiology, progression and consequences. This section outlines the
pathophysiology and epidemiology of NAFLD, with a special focus on the importance specific
metabolic disorders (insulin resistance and obesity) in the etiology of NAFLD.
2.1.1. General Overview of Non-Alcoholic Fatty Liver Disease
NAFLD is a rising recognized condition that has caught a growing focus over the last years
(16, 26). The pathological picture of NAFLD resembles that of alcohol-induced liver disease, but it
occurs in patients without an alcohol intake capable of injuring the liver (>20g/d for men and >30g/d
for women) (16, 27-29). A diverse terminology has been used to characterize NAFLD, such as:
fatty-liver hepatitis; nonalcoholic Laënnec’s disease; diabetes hepatitis; alcohol-like liver disease and
nonalcoholic steatohepatitis (16). The name non-alcoholic fatty liver disease has been considered
preferable, encompassing the full spectrum of non-alcoholic, fat related, liver disease stages (16,
30).
There is not complete agreement on criteria for diagnosis of NAFLD, even though it has been
suggested that it encompasses two basic histological lesions: (I) hepatic steatosis and (II)
non-alcoholic steatohepatitis (NASH) (30-32). Hepatic steatosis consists of fat accumulation in
hepatocytes mostly resulting from metabolic disorders (32). The degree of liver fat accumulation in
NAFLD can be graded according to the percentage of hepatocytes with fat deposits: mild NAFLD
involves less than 30% hepatocytes, moderate NAFLD up to 60%, and severe NAFLD above 60% (33),
characterized by hepatic inflammation and macrovisicular steatosis along with a constellation of
other disturbances (32). The term NASH was introduced over three decades ago in the description of
a group of Mayo Clinic patients, mostly obese and/or with diabetes mellitus, with an unnamed
disease associated with a fatty liver histology, with elevated liver enzymes along with inflammation
and fibrosis mimicking alcoholic hepatitis, but in the absence of alcohol intake (35). A proposal for
grading and staging the histological lesions present in NASH was long presented by Brunt and
colleagues (34). NASH can evolve to advanced fibrosis, cirrhosis and hepatocellular carcinoma (16,
30). Fat in the liver can be quantified by image methods [e.g. ultrasound of the liver has a high
sensitivity and specificity, nearly 90%, for detection of fatty infiltration (36)] but the degree of
inflammation and fibrosis, as well as other histological features of NASH can only be diagnosed by
liver biopsy (16, 26, 37). Angulo and colleagues (38) have recently developed a scoring system to
identify NAFLD patients with and without advanced fibrosis. By applying this model they were able to
identify 90% of advance fibrosis using only routine measured and readily available clinical and
laboratory data. In their study Angulo and colleagues (38) could have avoided 75% of performed liver
biopsies. It is likely that other simple markers, strongly associated with NAFLD, will arise from
research, and give significant information to estimate disease status.
The prevalence of NAFL D is estimated to range up to over 30% of general population in
western countries, though accurate epidemiologic data are still not available in many countries (1-4).
NASH occurs in up to 5.7% of the general population, in western countries (5, 39). Progression to
cirrhosis can occur in 15 to 20% of NASH patients (40). In many countries more than 80% of NAFLD
patients have an increased BMI and obesity has been found present in 25 up to nearly 60% of NAFLD
patients (3, 41-44). Approximately 50% of NAFLD patients show signs of insulin resistance (IR) and
20-30% have type 2 diabetes, 80% present hyperlipidemia while arterial hypertension is present in
about 30-60% (44). If we consider only the obese population, particularly in abdominal or in morbidly
obesity, the prevalence NAFLD may range up to 100% (1-3, 26). Because of this strong association
with obesity, mainly central obesity, and with impaired glucose metabolism, it is expected that
NAFLD will strongly increase, establishing a parallel with the pandemic dimension of the mentioned
metabolic disorders (6). Bottom line NAFLD is strongly associated to obesity, mostly that of the trunk
(2, 16, 45, 46), to dyslipidemia, as mentioned before, mainly hypertriglyceridemia (39, 47), and to
diabetes and IR (39, 46, 48), thereby NAFLD is also considered to be the hepatic manifestation of the
metabolic syndrome (7, 41, 49). Given the close association between NAFLD and classical
prevalence and risk of cardiovascular disease (CVD), as consistently shown by Targher and colleagues
(8, 50-53).
2.1.2. NAFLD pathophysiology
NAFLD, in most cases, is a consequence of an imbalance between factors that promote liver
fat increase (uptake and synthesis of fatty acids) and factors that promote liver fat reduction
(secretion and oxidation of fatty acids) (16, 54). It has been suggested a “two-hit” hypothesis for the
progression of NAFLD (55). The first hit, as mentioned, would be an imbalance in hepatic lipid
metabolism favouring liver fat increase resulting in hepatic steatosis. The “Two-hit” hypothesis
proposes that a second hit (oxidative stress and cytokine induction) is needed for inflammation to
take place resulting in NASH (55, 56).
The increased level of lipids, mostly in the form of triglycerides, within hepatocytes in
patients with NAFLD, results from an imbalance between the mechanisms that promote the uptake
and synthesis of fatty acids and those that promote the oxidation and export of fatty acids (16). The
accumulation of fat in the liver may be mediated by IR, regardless the fitness level of the patients
(57). In fact, IR appears to be the most consistent explanation of the development of NAFLD (16, 32,
46). Two main mechanisms may be involved in the IR mediated hepatic fat accumulation:
hyperinsulinemia and lipolysis (16). In healthy humans insulin stimulates adipocyte fat uptake and
inhibits lipolysis (as explained in more detail in subsection 2.3.3.2 in this chapter), therefore reducing
fatty acids flux from these cells. However, when cells present IR, insulin action is somewhat blunted
and therefore lipolysis may be increased, resulting in increased fatty acid flux from adipocytes (58).
The increased flux of fatty acids trough the portal vein towards the liver will result in high liver fatty
acid uptake that will lead to mitochondrial β-oxidation overload, with the consequent accumulation of fatty acids within hepatocytes (16). IR initiates a compensatory effect by the pancreas β-cells that
will increase insulin production leading to hyperinsulinemia (13) which in turn increases fatty acid
synthesis in hepatocytes, by increasing glycolysis (32), and also favors the accumulation of fat within
hepatocytes by decreasing the production of apolipoprotein 100, one main component of very low
density lipoproteins (VLDL) (32, 59). In summary it is reasonable to assume that IR increases
hepatocyte fat accumulation by favoring the hepatic metabolic pathways that promote lipid uptake
and synthesis, limiting those that promote lipid degradation and secretion.
BC has an important role in the etiology of NAFLD (9) and might as well be a central cause of
Excess BF, observed in overweight and obese, besides being an important risk factor for developing
NAFLD, is also strongly associated with IR and diabetes and may thereby contribute also indirectly for
the development of NAFLD (5). The relation of increased BF with both IR and NAFLD, besides being a
statistical relationship, has gained increased biological support. It has been observed that increased
visceral adipocyte size is a strong predictor of increased triglycerides in the blood (60). More
specifically, when visceral adipocytes are increased, they are predicted to contribute to nearly 50% of
portal vein non-esterified fatty acids (NEFA) flux to the liver, as compared to only 5 to 10% observed
in lean individuals (61). Together, this evidence supports the potential role of obesity, particularly
abdominal obesity, in the development of excessive lipolysis related metabolic disorders, such as
NAFLD. Moreover obese individuals, particularly the abdominal obese, display an adverse secretion
pattern of several cytokines or adipokines, such as C-reactive protein (CRP), tumor necrosis factor-α
(TNF- α), interleukin-6 (IL-6) and other which can alter lipolysis and insulin sensitivity (62-65),
reproducing all the metabolic imbalances previously described to be associate to IR alone, that may
lead to NAFLD. A quite recent study, conducted in rats, even showed significant elevation of hepatic
triglycerides to precede the presence of IR (66). This is consistent with the assumption that obesity,
particularly central obesity may be a key factor in NAFLD pathogenesis.
The so called “two hit” theory states that a second hit, after liver fat accumulation leading to simple liver steatosis (just discussed), is needed for NAFLD to progress to NASH (55). The second hit
has been suggested to include mitochondrial dysfunction and lipid peroxidation (55, 56). Yet,
mitochondrial dysfunction, quite recently, has been suggested to have a much more central role in
the development of NAFLD, preceding hepatic fat accumulation (66) and therefore having a role in
the development of steatosis (67) and this has been suggested to be somewhat linked to physical
inactivity (68). The precise step that triggers simple steatosis to move to NASH is not completely
understood. Visceral adipose tissue was found to be a risk factor for the presence of NASH, and may
play a role (46). Mitochondria are the main cellular source of reactive oxygen species (ROS) and
therefore have been suggested to be a major contributor to the progression of NAFLD (56). ROS are
normal cellular end-products of oxygen metabolism, and are important signaling substances for
redox balance or activation of defense mechanisms, however, high concentrations of ROS may be
detrimental for cell metabolism and even for cell survival (69). As mentioned earlier hepatic
steatosis occurs in the presence of mitochondrial β-oxidation overload, along with other metabolic impairments. Overloaded mitochondrial β-oxidation, present in steatotic hepatocytes generates increased opportunities for the formation of ROS which along with increased availability of fatty acid
alters lipids integrity in a chain reaction way that may disrupt structural lipids (membrane lipids from
organelles as mitochondria or from cell membrane itself) if not stopped (e.g. by anti-oxidants) (69).
Peroxidation of mitochondrial structural lipids causes or increases mitochondrial dysfunction leading
to higher formation of ROS, and vice-versa, increasing oxidative stress, which may end up causing
hepatocyte apoptosis (programed cell death) or, in more adverse cases, necrosis (69). Ultimately
these disturbances may lead to liver fibrosis and cirrhosis (55, 56, 70).
Bottom line, BC has an important role in the etiology of NAFLD (9). BF distribution may be
even more essential than whole BF in the etiology of NAFLD (5, 16). Excess BF, observed in
overweight and obese, and adverse BF distribution, besides being important risk factors that may
contribute directly for developing NAFLD, are also strongly associated with IR and diabetes and may
thereby contribute also indirectly for the development of NAFLD as well (5). Additional liver
disturbances may be needed for NAFLD to progress to more adverse stages and outcomes (55).
2.2. Body Composition
The study of BC is strongly associated to, and sometimes confused for the study of obesity,
though BC includes the study of body components far beyond fat mass alone. Nevertheless, in the
present study, the focus will be mostly on BF content and distribution. BC is considered to be a
component of health related fitness and it has proven to have physical, morphological and
particularly important health implications (71, 72). In this section it will be presented a general
overview of BC and its’ health implications and a focus on BC assessment with some emphasis on BC
clinical markers.
2.2.1. Body composition overview
The study of BC is a fascinating branch of the biological sciences. Imagining the alterations
occurring in living body mass, from conception throughout lifespan cannot let anyone dispassionate.
The field of BC research was suggested to be organized in three interconnecting areas: (I) BC levels
and their organizational rules, (II) BC methodology, as well as (III) BC biological effects (73, 74). The
first area involving the study, definition and links of the components themselves in each level of the
suggested five-level model (described ahead in this subsection, see figure 2.1). The second area
focuses on the study of BC measurement techniques to assess the various components in vivo. These
include sophisticated laboratory methods as well as practical clinical methods and instruments. The
both physiological and pathological conditions. Specific research topics included in this area of
research comprises growth, development, aging, race, nutrition, hormonal effects, physical activity
as well as diseases and medications that may influence BC. Even though this was not clear in the
terminology proposed by Wang and colleagues for the organization of BC research, in the present
thesis it was assumed that the influence of biological factors on BC (the third area of the proposed
terminology) can be observed in both directions, meaning BC may be sometimes viewed as a
determinant and/or as a consequence of abnormal or pathological conditions. Over the years a wide
variation could be observed in the terminology and methodology used in the study of BC. The
terminology and the five-level model suggested by Wang and colleagues (see figure 2.1) was
milestone in the field of BC research and is still fairly consensual, despite the technology advances
occurred. In the five-level model, it is assumed that each component within each level is mutually
exclusive and the sum of all components in the same level is equivalent to whole body mass (73).
Figure 2.1 – The five-level model in body composition suggested by Wang and colleagues. Adapted from Shen and colleagues (74), pp 4. N: nitrogen; CHO: carbohydrates.
The atomic level includes eleven major components, including oxygen, hydrogen, carbon and
nitrogen which all together account for more than 96% of whole body mass (74). The mentioned
atoms constitute molecules including water, lipid, carbohydrates, proteins, lipids, bone minerals and
soft tissue minerals, which are the six major components at the molecular level (74). This is probably
one of the most considered level in BC analysis. At the molecular level it is possible to use
multicomponent models: such as the widely used two compartment model (BF + fat free mass) which
can be assessed by most methods available; or the three compartment model (eg. BF + bone mineral
common gold standard four compartment model (eg. Fat mass + total body water + total body
protein + minerals) which needs to be assessed with a combination of methods (74). The cellular
level includes three components: extracellular solids; extracellular fluids and cells, which include
both fat and body cell mass. The tissue-organ level results from the differentiation of cells into
tissues and organs, including adipose tissue, skeletal muscle, visceral organs and bone. At this level it
is important to distinguish between adipose tissue and the wide studied BF or even from lipids, the
latest both assessed at the molecular level (see figure 2.2) (74). Lipids include all of such molecules in
the body, including non-fat lipids (lipids that are not in the form of triglycerides), both in adipose and
other tissues, lipids stored within the adipose tissue in the form of triglycerides, and lipids in the form
of triglycerides stored in other tissues. The commonly used word “fat” may be used interchangeably
with BF and refers to triglycerides, which are the molecular form in which lipids are stored in the
body. BF can be stored in the adipose tissue and in other tissues as well. Adipose tissue comprises BF
and non-fat lipids, such as phospholipids, but includes also other components essential to the
survival and function of adipose tissue cells. About 80% of adipose tissue is fat and the remainder
20% are water, proteins and minerals (75). The fifth level, the whole-body level, can be assessed
using simple measures of weight or height, and can also be divided into regions such as the head,
limbs and trunk, which can be assessed with various anthropometric techniques, such as
circumferences, skinfolds and lengths.
Figure 2.2 – The relationships between molecular-level components lipid and fat and the tissue-organ-level component adipose tissue. Adapted from Shen and colleagues (74), pp 12.
Shen and colleagues (75) presented a classification of adipose tissue location, based on
image methods, which was very important to give some coherence to the wide terminology that was
tissue. Subcutaneous may be divided into superficial and deep subcutaneous adipose tissue. Recently
it has been given some importance to this division of subcutaneous adipose tissue (17). Internal
adipose tissue can then be divided into visceral and non-visceral and these can subsequently be
divided in many other specific fat depots, all according to their specific location (75). Sometimes BF
may be stored in the visceral region, outside of adipocytes, near the organs. This is called ectopic fat
and seems to have important health implications (76-78). Though this terminology was developed
using image methods, DXA, despite being considered an image method, cannot assess all of the
mentioned adipose tissues. DXA assesses BF in the whole body or body regions but cannot identify
adipose tissue. Some attempts, however, were made to estimate visceral adipose tissue using DXA
(79, 80) and found coefficients of correlation over 0.85, which is considered to be high. Yet DXA can
only give precise estimates of whole BF, as does air displacement plethysmography (81), additionally
DXA also estimates BF of specific regions or segments of the body, including the upper and lower
limbs, the trunk or the abdominal regions, and other customized regions if intended (82). The
present thesis adopts the terminology recommended by Sardinha and Teixeira (77): whole BF refers
to whole body; regional BF represents a single variable of a body region, as in total abdominal fat; BF
distribution refers to the measurement of one variable in relation to another so that a dichotomous
fat distribution type can be identified (e.g., a contrast or a ratio), as is expressed in Vague’s pioneer observations on this topic (83, 84). Never the less it is recognized that the expressions “regional BF” and “BF distribution” have been commonly used interchangeably (77).
BF distribution analysis started with the study of body shape (13). In the beginning of the 20th
century, after World War II, insurance companies identified a higher risk of mortality related to
certain BF distribution Phenotypes (11). In the conviction that fat accumulation in different regions of
the body could have different predictive values, classifications of BF distribution were developed,
such as Vague’s classification (83, 84) that distinguished central BF accumulation (android) from peripheral, preferentially lower, BF accumulation (gynoid). BF distribution has long been shown to be
related with other adverse outcomes, including diabetes, CVD, some forms of cancer and mortality
(11). BF distribution markers have been suggested to be more consistent and strong predictors of
CVD in healthy men and women, as compared to whole body markers of generalized adiposity (85),
and the potential usefulness of such BF distribution clinical markers for public health has been
recognized (86). BF distribution has also been shown to be particularly related to other metabolic
impairments such as NAFLD (2, 16, 45, 46), as mentioned and explained in the previous subsection of
the present work. More than six decades after Vague’s preliminary publication, BF distribution is still
as criterion in the study of BF distribution, yet computerized axial tomography (CT) and magnetic
resonance imaging (MRI), often used as reference methods to quantify adipose tissue (87, 88), do not
assess BF (75). DXA assesses BC in a three compartment model within the molecular level and can
estimate whole and regional BF content and distribution (82). Studies using DXA have however
showed that BF from specific regions of interest (ROI) may be considered acceptable predictors of
visceral adipose tissue (79, 80, 89, 90). Studies using ratios between DXA assessed ROI have also
been able to predict MRI assessed visceral adipose tissue (91). BF can also be quantified by magnetic
resonance spectroscopy (MRS) in various tissues-organs, such as the liver (92) or the muscle (93).
Another image method often used to estimate liver fat content is ultrasound (94). Many clinical
markers of BF content and distribution have been suggested, including simple anthropometric
measurements and resulting calculated body indexes, as discussed ahead in the present chapter.
These anthropometric variables and indexes assess BC at a whole-body level to evaluate body
dimensions and morphology, and often are used as BF content and distribution surrogates.
2.2.2. Body Composition and obesity
The study of overweight and obesity has been overwhelming in the field of human BC
research, maybe because of both the pandemic dimension of its prevalence in developed countries
(95, 96) and the associated health implications of such widespread condition (14, 97, 98). The study
of BC in specific subpopulations, such as NAFLD patients, is not so well explored as in the general
population or in other specific subpopulations but is giving consistent steps and growing. Obesity has
been defined as an excess of adipose tissue (71) however adipose tissue is difficult to assess,
requiring expensive and limited access imaging methods such as computed tomography or magnetic
resonance imaging (75). Obesity has also been referred to as an excess of BF (17, 99), which should
be easier to estimate than adipose tissue. However the most widely used definition of obesity is “a
state of excessive weight” mostly because of the simple and inexpensive marker recommended by
most prominent organizations (72, 100-102) and most often used for the diagnosis of obesity: the
body mass index (BMI = weight [kg] / height [m]2). As mentioned, obesity is an important health
concern and is linked to many other diseases and morbidities and ultimately, to higher mortality
rates (11, 103), but the problem in obesity seem to be more related to altered metabolism of surplus
fat and enlarged adipocytes, along with other metabolic impairments (17, 104, 105), rather than just
an excess of body weight alone (106). Therefore whenever obesity is mentioned, in the present work,
it should be referring to excess BF. The link between BF and related morbidities, or the detailed