PEAK1 Acts as a Molecular Switch to Regulate
Context-Dependent TGF
β
Responses in
Breast Cancer
Megan Agajanian1, Anaamika Campeau1, Malachia Hoover1, Alexander Hou1,2, Daniel Brambilla1, Sa La Kim1, Richard L. Klemke3, Jonathan A. Kelber1*
1Department of Biology, California State University Northridge, Northridge, CA 91330, United States of America,2Department of Biology, Georgetown University, Washington, DC 20057, United States of America,3Department of Pathology & Moores Cancer Center, University of California San Diego, La Jolla, CA 92093, United States of America
*jonathan.kelber@csun.edu
Abstract
Transforming Growth Factorβ(TGFβ) has dual functions as both a tumor suppressor and a promoter of cancer progression within the tumor microenvironment, but the molecular mechanisms by which TGFβsignaling switches between these outcomes and the contexts in which this switch occurs remain to be fully elucidated. We previously identified PEAK1 as a new non-receptor tyrosine kinase that associates with the cytoskeleton, and facilitates sig-naling of HER2/Src complexes. We also showed PEAK1 functions downstream of KRas to promote tumor growth, metastasis and therapy resistance using preclinicalin vivomodels
of human tumor progression. In the current study, we analyzed PEAK1 expression in human breast cancer samples and found PEAK1 levels correlate with mesenchymal gene expression, poor cellular differentiation and disease relapse. At the cellular level, we also observed that PEAK1 expression was highest in mesenchymal breast cancer cells, corre-lated with migration potential and increased in response to TGFβ-induced epithelial-mesen-chymal transition (EMT). Thus, we sought to evaluate the role of PEAK1 in the switching of TGFβfrom a tumor suppressing to tumor promoting factor. Notably, we discovered that high PEAK1 expression causes TGFβto lose its anti-proliferative effects, and potentiates TGFβ -induced proliferation, EMT, cell migration and tumor metastasis in a fibronectin-dependent fashion. In the presence of fibronectin, PEAK1 caused a switching of TGFβsignaling from its canonical Smad2/3 pathway to non-canonical Src and MAPK signaling. This report is the first to provide evidence that PEAK1 mediates signaling cross talk between TGFβreceptors and integrin/Src/MAPK pathways and that PEAK1 is an important molecular regulator of TGFβ-induced tumor progression and metastasis in breast cancer. Finally, PEAK1 overex-pression/upregulation cooperates with TGFβto reduce breast cancer sensitivity to Src kinase inhibition. These findings provide a rational basis to develop therapeutic agents to target PEAK1 expression/function or upstream/downstream pathways to abrogate breast cancer progression.
OPEN ACCESS
Citation:Agajanian M, Campeau A, Hoover M, Hou A, Brambilla D, Kim SL, et al. (2015) PEAK1 Acts as a Molecular Switch to Regulate Context-Dependent TGFβResponses in Breast Cancer. PLoS ONE 10 (8): e0135748. doi:10.1371/journal.pone.0135748
Editor:Aamir Ahmad, Wayne State University School of Medicine, UNITED STATES
Received:March 24, 2015
Accepted:July 25, 2015
Published:August 12, 2015
Copyright:© 2015 Agajanian et al. This is an open access article distributed under the terms of the Creative Commons Attribution License, which permits unrestricted use, distribution, and reproduction in any medium, provided the original author and source are credited.
Data Availability Statement:All relevant data are within the paper and its Supporting Information files.
Introduction
Breast cancer is the most common cancer among women, accounting for 23% of all cancer cases [1]. Patients with metastatic forms of this disease have a 24% survival rate [2]—thus, understanding the molecular regulation of the metastatic cascade as well as the growth of meta-static tumors can illuminate novel strategies for increasing patient survival.
Transforming growth factor beta (TGFβ) is part of the TGFβsuperfamily and acts through the TβRII and TβRI (ALK5) receptor serine/threonine kinases to induce Smad2/3 signaling and gene transcription [3]. In the context of human cancers, TGFβcan act as either a tumor suppressor or a pro-tumorigenic factor capable of inducing epithelial to mesenchymal transi-tion (EMT) and metastasis. EMT is a morphologic and phenotypic shift in cells that is associ-ated with specific changes in gene expression. EMT is essential and strictly regulassoci-ated during embryogenesis and tissue homeostasis [4]; however, it is deregulated during the progression of epithelial cancers to promote metastasis [5]. During EMT, cells gradually lose their apical-basal polarity, ability to attach to the basement membrane and protein complexes that regulate cell-cell junctions. These changes are also associated with downregulation of epithelial genes (e.g., E-cadherin) and increased expression of mesenchymal genes (e.g., N-cadherin)—the resulting cells tend to migrate more extensively and adopt a more spread, fibroblast-like morphology [4].
As a tumor suppressor, TGFβexposure promotes cytostasis, apoptosis and differentiation, as well as acting to stimulate a proper immune response [6,7]. However, TGFβ’s signaling mechanisms can be altered to inhibit its anti-proliferative effects and stimulate tumorigenic effects (e.g., EMT) [8]. Interestingly, environmental cues as well as cell type are factors that can determine whether TGFβacts in a tumor suppressive or tumor promoting manner. While it is understood how the signaling pathways become modified, a complete understanding of the molecular regulation that drives this switch in TGFβresponsiveness remains to be fully eluci-dated [9,10]. In this regard, TGFβand ECM/growth factor pathways have been shown to coop-erate to promote EMT, migration, invasion and metastasis of breast cancer cells
[11,12,13,14,15]. Previous reports have demonstrated that specific extracellular matrix proteins (e.g., fibronectin) can cooperate with TGFβreceptors to shift TGFβsignaling from its canonical Smad2/3 pathway toward non-canonical Src/TβRII/Grb2/MAPK signaling pathways. Notably, this shift has been reported to be a key mechanism through which TGFβadopts its pro-tumori-genic functions [11,12].
We previously identified PEAK1 (pseudopodium enriched atypical kinase 1, Sgk269) as a novel non-receptor tyrosine kinase that is enriched in the pseudopodia of migrating cells [16,17]. PEAK1 promotes tumor growth/metastasis and therapy resistance in human cancers via its regulation of the actin cytoskeleton and Src, KRas and ErbB2 signaling pathways [16,17,18]. Others have also reported that PEAK1 regulates Shc1 and Grb2 signaling down-stream of EGF stimulation [19], and bioinformatics have predicted that PEAK1 may interact with MAPK proteins [17,20]. Finally, PEAK1 overexpression in mammary epithelial cells has been reported to promote an EMT-like response [21].
In this study, we show that PEAK1 can mediate the shift of TGFβresponses from anti-pro-liferative to pro-tumorigenic in cooperation with ECM-specific signaling events. Using a previ-ously describedin vitromodel for breast cancer progression as well as hormone-responsive breast cancer cells, we show that PEAK1 is necessary and sufficient for TGFβ-induced migra-tion, EMT, metastasis and proliferation in breast cancer. Finally, we demonstrate that this PEAK1-dependent effect occurs via Src/MAPK signaling pathways and that PEAK1 upregula-tion/overexpression can desensitize breast cancers to the cytotoxic effects of Src kinase inhibition.
Results
Increased PEAK1 expression in breast cancer correlates with indicators
of poor patient prognosis, mesenchymal gene expression and cell
migration
Previous breast cancer microarray studies were analyzed for PEAK1 mRNA expression in rela-tion to markers of poor patient prognosis [22,23,24,25,26]. We found that increased levels of PEAK1 expression correlate with multiple markers of poor patient prognosis, such as meta-static lesions, disease relapse, advanced N stage, tumor grade, HER2 status, and stromal-derived prognostic predictor (SDPP) status (Fig 1A). To evaluate PEAK1 expression in patient samples at the protein level, we selected four breast cancer tissue samples (two with low PEAK1 levels and two with elevated PEAK1 levels) from the Human Cancer Atlas for compar-ing PEAK1 IHC staincompar-ing patterns with those of epithelial or mesenchymal markers that have been previously reported to be regulated by PEAK1 overexpression [21,27]. As shown inFig 1B, samples that have elevated PEAK1 protein levels have increased expression levels of the mesenchymal markers SNAI1 and FN1, while epithelial markers OCLN and ESR1 are low in these samples. The inverse pattern was observed in samples with low PEAK1 protein levels. Analysis of additional markers of EMT [4] revealed that breast cancer samples with high PEAK1 levels expressed reduced levels of the epithelial markers MUC1, E-Cadherin and Entac-tin and increased levels of the mesenchymal markers Syndecan1 and LEF1 (S1A Fig). We also evaluated the correlation between PEAK1 levels and EMT gene signatures previously reported to be regulated by PEAK1 in mammary epithelial cells [21] across a panel of breast cancer cell
Fig 1. PEAK1 expression in breast cancer correlates with indicators of poor patient prognosis, mesenchymal gene expression, cell migration and is upregulated during TGFβ-induced EMT.(A) PEAK1 mRNA fold change was analyzed from several previous reports of patient data in relation to characteristics that correlate with poor patient prognosis–i.e., metastatic lesions, disease relapse, advanced
N stage, high grade, HER2 positive status, and stromal-derived poor prognostic (SDPP) status. (B) IHC from the Human Cancer Atlas of four different patients–two with elevated PEAK1 levels and two with low PEAK1
levels–for SNAI1, FN1, OCLN and ESR1 expression. (C) Western blot analysis on lysates from MCF10A,
MCF10AT1K, MCF10CA1h, and MCF10CA1a cells for PEAK1 and E-cadherin expression. (D) Single cell migration assay on 3μg/mL of Fibronectin (F), Collagen (C), or Laminin (L) of CA1h and CA1a cells (velocity is plotted on the left axis and displacement is plotted on the right). (E) MCF10A, CA1h, MDA-MB-231, and MCF7 cells were plated on plastic and treated for 72 hours with TGFβ. RNA was collected and qPCR for E-cadherin (top) and PEAK1 (bottom) expression was performed.**or***indicate p-values<0.01 or 0.001,
respectively.
lines [28]. Notably, PEAK1 expression correlated with decreased epithelial and/or increased mesenchymal gene expression patterns in HER2+ and/or ER/PR+ subtypes of breast cancer cells (S1B Fig).
Oncogenic HRas transformation of MCF10A mammary epithelial cells and their subse-quentin vivoselection was the basis for establishing a commonly used model of breast cancer progression [29] and has been shown to represent non-malignant epithelial (MCF10A), breast
carcinomain situ(MCF10AT1k), slow-growing breast carcinoma (MCF10CA1h) and
fast-growing breast carcinoma (MCF10CA1a) cell types. Upon analysis of PEAK1 and E-Cadherin expression across this panel of four lines, we discovered that PEAK1 levels were highest in the CA1h cells–these also had the lowest E-Cadherin expression levels (Fig 1C) and most mesen-chymal morphology of the three HRas transformed lines (S2 Fig). Finally, we found that the PEAK1-high CA1h cells move faster (i.e., velocity) and further (i.e, displacement and track length) than the more epithelial and faster growing CA1a cells (Fig 1DandS3 Fig), irrespective of extracellular matrix substrate protein (i.e., fibronectin, collagen or laminin).
TGF
β
increases PEAK1 expression concurrent with E-Cadherin
downregulation
Although PEAK1 has been previously reported to induce EMT-like responses in mammary epithelial cells [21], the contributions of PEAK1 to EMT in breast cancer have not been previ-ously studied. Since TGFβis a well-known inducer of EMT during both development and can-cer progression [21,30], we sought to test the effects of TGFβon PEAK1 and E-Cadherin expression in MCF10A cells alongside three cellular models of breast cancer. Interestingly, in both the non-tumorigenic MCF10A and highly metastatic MDA-MB-231 cells, TGFβ signifi-cantly upregulated PEAK1 and downregulated E-Cadherin (Fig 1E). While there was a trend in PEAK1 upregulation and E-Cadherin downregulation following TGFβtreatment of the CA1h cells, this effect was not statistically significant. Additionally, TGFβalone was unable to induce EMT or PEAK1 expression in MCF-7 cells (Fig 1E). These data suggest that PEAK1 levels in breast cancer cells are an important factor in determining TGFβ’s ability to induce EMT. In agreement with the possibility that PEAK1 plays a role in EMT and metastasis downstream of TGFβ, we discovered that breast cancer samples from patients with recurrent metastatic disease or poor prognostic biomarker status (i.e., HER2-positive or TNBC) displayed significantly ele-vated levels of PEAK1 and TGFβresponse genes [31,32,33,34] (S4 Fig).
PEAK1 promotes tumorigenic signaling and proliferation in breast
cancer cells
PEAK1 potentiates fibronectin/TGF
β
-induced EMT
We next asked whether PEAK1 expression can influence the EMT response in breast cancer cells when exposed to TGFβ. MCF7-Vector and-PEAK1 cells were plated on plastic or different ECM protein substrates and then chronically treated with TGFβor vehicle prior to collecting lysates. As shown inFig 2A and 2B, PEAK1 overexpression in combination with chronic TGFβ treatment had synergistic effects on E-cadherin downregulation only when cells were plated on a fibronectin substrate. While both TGFβtreatment or PEAK1 overexpression could downre-gulate E-cadherin on other substrates, there was no further additive effect for TGFβtreatment of MCF7-PEAK1 cells under these other substrate conditions (Fig 2A and 2B). In contrast, N-cadherin levels did not change appreciably across ECM substrates in the presence of PEAK1 overexpression and/or TGFβtreatment, confirming the minimally invasive nature of MCF7 cells (Fig 2A and 2B). We also evaluated cell morphology of these same cells under the same conditions in sub-confluent cultures. While either TGFβtreatment or PEAK1 overexpression was able to shift the cell morphology across substrate conditions, an additive increase in mes-enchymal morphology (i.e., reduced cell-cell packing and increased spreading or pseudopod formation) was only observed in MCF7-PEAK1 cells treated with TGFβwhen they were plated on fibronectin (Fig 2CandS6A Fig). Finally, we evaluated gene expression and morphology changes of the CA1h cells containing either control or PEAK1-specific shRNAs when plated on fibronectin and cultured in the presence or absence of TGFβ. In agreement with the above data from the MCF7 cell variants, TGFβreduced E-Cadherin and increased Vimentin levels in the CA1h-shCntrl cells indicating EMT induction (Fig 2D). This corresponded to a striking shift toward a mesenchymal-like morphology in the cells (Fig 2E). Specifically, these cells spread more, lose cell-cell contacts, have significant membrane ruffling and acquire a more spindled shape. Notably, silencing PEAK1 alone caused Vimentin levels to decrease (Fig 2D) and the CA1h cells to adopted an epithelial and tightly packed morphology (Fig 2E).
Fig 2. PEAK1 potentiates fibronectin/TGFβ-induced EMT-like responses.(A-C) MCF7-Vector and-PEAK1 cells were plated on 3ug/mL Fibronectin (F), Collagen (C) or Laminin (L), or plated on Plastic (P) and treated chronically with TGFβ. (A) Western blot analysis for E-cadherin, N-cadherin, andα-tubulin was performed after two weeks in culture. (B) Western blot band quantification from (A) using densitometry analysis. (C) Micrographs of cells after two weeks in culture. Yellow arrowhead points to a typical cell that is not packed tightly into epithelial colonies and is mesenchymal. (D & E) qPCR for E-Cadherin and Vimentin expression (D) and micrographs (E) from CA1h-shCntrl and-shPEAK1 cells plated on fibronectin and treated with TGFβor vehicle control for 48 hours. (Scale bar: 90μm). Yellow arrowhead points to a typical cell that is not packed tightly into epithelial colonies and is mesenchymal.
Furthermore, PEAK1 knockdown enabled TGFβto induce E-Cadherin levels (Fig 2D) and a more epithelial morphology (Fig 2E)—thus, PEAK1 is necessary for TGFβ-induced EMT in these cells.
PEAK1 is necessary and sufficient for increased breast cancer cell
migration in response to TGF
β
/fibronectin treatment
Since cell migration is a behavior that traditionally increases as breast cancer cells acquire more mesenchymal and invasive character [35], we next tested the function of PEAK1 in regulating breast cancer cell migration velocity, displacement and migration track length following TGFβ treatment of either MCF7 and CA1h cells plated on different ECMs. As shown inFig 3A, PEAK1 overexpression in combination with TGFβtreatment, displayed an additive effect on both cell velocity and displacement only when the cells migrated on fibronectin. In agreement with these data, the track lengths of MCF7-PEAK1 cells on fibronectin after TGFβtreatment were significantly longer than those of either PEAK1 overexpressing or TGFβtreated cells alone (Fig 3B). In contrast, chronic treatment of control CA1h cells with TGFβstimulated their migration significantly on all substrates, while PEAK1 knockdown in these cells reversed this effect of TGFβin the context of fibronectin only (Fig 3C and 3D). Taken together, these results clearly indicate that TGFβ-induced motility in breast cancer cells is potentiated by fibro-nectin in a PEAK1-dependent manner.
PEAK1 cooperates with fibronectin to block the cytostatic effects of
TGF
β
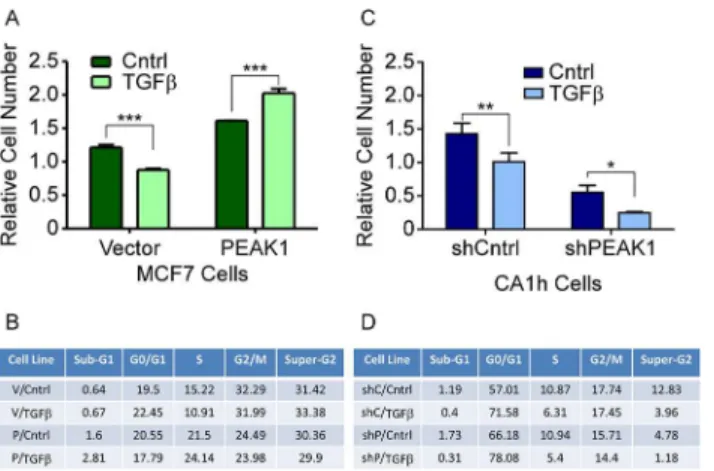
The conversion of TGFβsignaling to a pro-EMT factor in cancer often correlates with its inability to inhibit cell proliferation [36,37]. Therefore, we evaluated the number of viable cells as well as the cell cycle profiles for the MCF7 and CA1h cell lines in response to TGFβwhen plated on fibronectin. While TGFβtreatment of the MCF7-Vector cells caused a significant decrease in viable cell number and S-phase percentages, MCF7-PEAK1 cells responded to
Fig 3. PEAK1 is necessary and sufficient for increased breast cancer cell migration in response to TGFβ/fibronectin treatment.(A-D) MCF7-Vector and–PEAK1 or CA1h-shCntrl and–shPEAK1 cells were
chronically treated with TGFβwhile being cultured on plastic. (A and C) Single cell migration assays were performed on these cells after plating on the indicated substrates with 3 images per condition being collected every 10 minutes for 24 hours. Cells were tracked using Fiji software to determine Displacement (μm) (left y-axis) and Velocity (μm/min) (right y-axis). Two-way ANOVA statistical analysis was performed using Prism. (B and D) 10 representative cell tracks for each of the indicated cell populations are shown when cells were migrating on fibronectin.***indicate p-values<0.001.
TGFβtreatment with increased viable cell numbers and S-phase percentages (Fig 4A and 4B). As has been previously reported [36,37], we observed that TGFβtreatment of CA1h-Cntrl cells reduced cell proliferation (Fig 4C and 4D). Still, silencing PEAK1 alone decreased the number of viable CA1h cells and S-phase percentages while increasing the G0/G1 percentages (Fig 4C and 4D). Furthermore, TGFβtreatment of the CA1h-shPEAK1 cells almost completely blocked cell proliferation (Fig 4C and 4D). Importantly, the decrease in proliferation was not likely due to an increase in apoptotic-like cells since the sub-G0/G1 percentages remained unchanged (Fig 4D), indicating that the combined effect of PEAK1 knockdown and TGFβtreatment on fibronectin is due to cellular senescence.
PEAK1 is required for TGF
β
/fibronectin-induced metastasis in vivo
The combined effect of TGFβand fibronectin on the metastatic potential of MCF10CA1h cells
in vivohas not been previously evaluated. Based upon the cell morphology data inFig 2, we predicted that TGFβtreatment of these cells in the presence of fibronectin would induce a more invasive and metastatic response. To test this, we used the chorioallantoic membrane (CAM) of the developing chicken (Gallus gallus) as anin vivoxenograft model for growth, invasion and metastasis of cancer cells [38]. Briefly, the primary tumor weight from the CAM was measured and qPCR was used to measure the amount of humanalurepeat sequences in both lung and liver tissue seven days after xenografting. As has be previously reported [38], the levels of humanalurepeat sequences in these respective tissues can be used as an indicator of relative metastatic potential. PEAK1 silencing and/or TGFβtreatment in the CA1h cells grown on fribronectin prior to xenografting did not affect tumor growth on the CAM (Fig 5A). Nota-bly, however, TGFβtreatment of the CA1h-shCntrl cells strongly induced metastasis of these cells to both lung and liver tissue. However, PEAK1 knockdown completely abrogated this effect (Fig 5B). Importantly, these data demonstrate for the first time that the cooperative effects of TGFβand fibronectin on breast cancer metastasis require PEAK1 kinase expression/ function. Furthermore, the fact that PEAK1 knockdown alone does not abrogate the metastatic potential of these cells demonstrates a specific role for PEAK1 in TGFβ-induced metastasis in breast cancer.
Fig 4. PEAK1 cooperates with fibronectin to block the cytostatic effects of TGFβ.MCF7-Vector and–
PEAK1 or CA1h-shCntrl and–shPEAK1 cells were plated on fibronectin then treated with TGFβ. (A and C)
After 72 hour incubation, an AQueous One assay was performed. The relative cell number was plotted and two-way ANOVA analysis was performed to determine statistical significance. (B and D) The cell cycle profiles were analyzed and the percent of cells in each stage are shown.*,**,***indicate p-values<0.05, 0.01 and 0.001, respectively.
PEAK1 potentiates TGF
β
-induced Src/MAPK signaling in a
fibronectin-dependent manner
Next, we evaluated the effect of PEAK1 overexpression on TGFβ-induced Smad2/3, Src and MAPK signaling in MCF7 breast cancer cells. On plastic, PEAK1 overexpression alone increased activation of Src, Erk1/2 and Smad2 pathways, but also acted in a cooperative and additive fashion with short-term TGFβstimulation to activate Smad2/3 to a greater extent (Fig 6A and 6B). Plating the MCF7-Vector cells on fibronectin alone robustly stimulated activation of the Erk1/2 pathway (Fig 6A and 6B). PEAK1 overexpression in the context of fibronectin led to a robust activation of Src and a modest increase in both Erk1/2 and Smad2/3 signaling over fibronectin alone (Fig 6A and 6B). Notably, however, TGFβtreatment of either
MCF7-Vector or-PEAK1 cells on fibronectin was unable to further activate Smad2/3, but pref-erentially increased Src and Erk1/2 signaling. Importantly, this effect of TGFβswitching from Smad2/3 to Src-Erk1/2 signaling pathways in the context of fibronection was potentiated by PEAK1 overexpression (Fig 6A and 6B). In order to determine if this effect was specific to fibronectin, we looked at Erk1/2 activity under these same conditions in both MCF7-Vector and-PEAK1 cells when cultured on plastic or different ECM protein substrates. Not only did we observe the highest magnitude of Erk1/2 signaling in PEAK1 overexpressing MCF7 cells treated with fibronectin and TGFβ, but neither plastic, collagen nor laminin were able to coop-erate with TGFβto induce PEAK1-dependent Erk1/2 activation (Fig 6C and 6D).
Fig 5. PEAK1 is required for TGFβ/fibronectin-mediated metastasisin vivo.(A and B) CA1h-shCntrl and–shPEAK1 cells were plated on fibronectin then treated with TGFβfor 72 hours, after which a CAM assay
was preformed. (A) After harvesting the primary tumor, it was weighed. (B) qPCR for chicken GAPDH and humanaluwas performed on genomic DNA extracted from the liver and lung tissue. A t-test was performed to determine statistical significance.*,**,***indicate p-values<0.05, 0.01 and 0.001, respectively.
doi:10.1371/journal.pone.0135748.g005
Fig 6. PEAK1 potentiates TGFβ-induced Src/MAPK signaling in a fibronectin-dependent manner.(A and C) MCF7-Vector and-PEAK1 cells were plated on the indicated substrates (i.e., Fibronectin—F, Collagen —C, Laminin—L, or Plastic–P). Cells were then serum starved for 8 hours, then stimulated with TGFβfor 30
minutes. Lysates were collected and Western blot analysis was done for indicated proteins and phospho-proteins. (B and D) Band intensity ratio for phospho-protein to total protein was calculated for western blots from A and C, respectively.
PEAK1 and TGF
β
Cooperate to Promote Resistance to Src Kinase
Inhibition
Our previous work has shown that PEAK1 promotes therapy resistance in human cancers [18,39], and others have reported that EMT induction can also drive therapy resistance [21]. Therefore, we assessed the cooperative effect of TGFβtreatment and PEAK1 overexpression on Src (AZM) and ALK5 (SB-431542) kinase inhibition responses–two previously identified therapeutic targets in human malignancies [40,41]. Interestingly, ALK5 inhibition did not decrease cell viability in any of the cell variants, even at high doses, suggesting that canonical TGFβsignaling is not responsible for cell viability and/or proliferation in these cells (Fig 7A). However, we discovered that PEAK1 overexpression and TGFβtreatment cooperate to reduce the potency of Src inhibition in the presence of fibronectin. Specifically, TGFβtreatment of MCF7-PEAK1 cells on fibronectin increased the AZM IC50value by nearly 10-fold (Fig 7A
and 7B).
PEAK1 regulates TGF
β
switching between tumor suppressor and
pro-metastatic functions in breast cancer
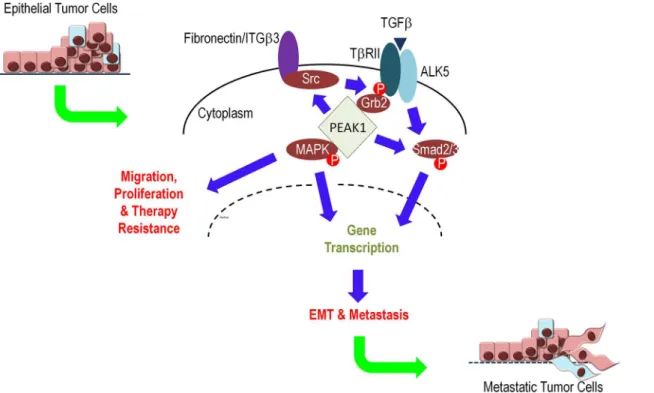
Based upon our data and the work of others, we propose a model in which increasing levels of PEAK1 expression can promote the switching of TGFβresponses from anti-proliferative or pro-apoptotic to pro-tumorigenic and pro-metastatic. Importantly, as many others have noted, TGFβresponses depend upon context, and our data demonstrate that PEAK1-mediated switching of TGFβsignaling and function occurs in the context of fibronectin/integrin signal-ing. More specifically, when PEAK1 is upregulated in the presence of fibronectin, TGFβ signal-ing can co-regulate Smad2/3 and MAPK signalsignal-ing to promote EMT, tumor cell migration/ proliferation and cancer metastasis (Fig 8).
Discussion
TGFβis a pleiotropic growth factor that elicits its cellular responses in a context-dependent fashion via both canonical and non-canonical signaling pathways [8,9]. While significant
Fig 7. PEAK1 and TGFβcooperate to promote resistance to Src kinase inhibition.(A) Indicated populations of MCF7-Vector and–PEAK1 cells were plated on fibronectin and treated with increasing doses
of either AZM (left) or SB-431542 (right). After 72 hours an AQueous One assay was performed to assess cell viability. Relative cell number versus drug concentration (M) is plotted. (B) AZM IC50values for are reported for the indicated cell population.
efforts have been put forth to understand the molecular details that underscore these varied responses [9,42,43], the precise mechanisms that regulate TGFβsignaling in various contexts remain to be fully elucidated. In human cancers, TGFβcan promote growth arrest and apopto-sis in pre-malignant tissues, while facilitating metastaapopto-sis through EMT and the acquisition of invasive behavior in later stages [7]. As such, determining the context in which TGFβ antago-nists can improve disease outcome for cancer patients is of great interest within the cancer research community [44].
We report here that PEAK1 kinase is a novel molecular regulator of TGFβsignaling responses, and plays a critical role in determining the context in which TGFβsignaling elicits tumor suppressive or pro-tumorigenic functions in breast cancer cells. Furthermore, we also report that PEAK1 expression levels significantly and positively correlate with EMT gene expression signatures in patient samples and ER- and/or HER2-positive breast cancer cell pop-ulations (S1 Fig). Thus, PEAK1 levels or a PEAK1 gene expression signature may be important indicators for determining when TGFβblockade is a viable anti-cancer treatment option. While further studies will be essential to test this hypothesis, several lines of evidence exist to support this possibility. First, our work (Figs1C–1E,2,3and5andS6 Fig) and the work of oth-ers [45] have demonstrated that TGFβinduces EMT/migration/invasion/metastasis in breast cancer cells with high PEAK1 expression (i.e., MCF10CA1h and MDA-MB-231), but has little or no effect on migration/invasion in low PEAK1-expressing breast cancer cells (i.e., MCF-7 and MCF10CA1a). Second, previous work has demonstrated that the SPARC gene is a highly upregulated mesenchymal gene following PEAK1-induced EMT in mammary epithelial cells [21]. In parallel, SPARC has been reported to regulate TGFβ’s ability to promote mesenchymal cell behavior [46,47]. Thus, identifying tumor subtypes in which PEAK1 levels or
Fig 8. PEAK1 regulates TGFβswitching between tumor suppressor and pro-metastatic functions in breast cancer.PEAK1 can bind and facilitate the recruitment of Src kinase to integrins and TβRII/Grb2 complexes to facilitate non-canonical TGFβ-induced MAPK signaling in the presence of extracellular matrix proteins that signal through ITGB3. Additionally, PEAK1 can promote Smad2/3 in the presence of fibronectin while potentiating TGFβ-induced Smad2/ 3 signaling in the absence of ECM protein. Ultimately, PEAK1 converts TGFβsignaling from an anti-proliferative growth factor to a pro-tumorigenic one.
PEAK1-induced EMT gene signatures are elevated may facilitate the selection of patients that will respond positively to anti-TGFβtreatment regimens.
In addition to functioning as a biomarker, our results suggest that PEAK1 may be a viable target for reversing the cellular response to TGFβaction in more advanced stages of breast can-cer. Specifically, we demonstrate that PEAK1 overexpression converts TGFβto a pro-prolifer-ative factor in MCF7 cells (Fig 4A and 4B), and that PEAK1 knockdown cooperates with TGFβ to almost completely block proliferation in MCF10CA1h cells (Fig 4C and 4D). Notably, this switching of TGFβto a pro-proliferative factor in the presence of high PEAK1 levels correlates with PEAK1’s ability to promote TGFβ-induced motility, EMT gene expression, mesenchymal cell morphology and tumor metastasis (Figs2,3,4and5andS6 Fig). Thus, by targeting PEAK1 protein-protein interactions or the regulators of PEAK1 expression breast cancer cell growth can be significantly reduced and/or cells can be made more sensitive to chemo- or tar-geted-therapies. The viability of this approach is supported by our previous work demonstrat-ing that PEAK1 promotes thein vivogrowth of both breast and pancreatic cancer cells [17,18]. Additionally, we’ve reported that the translation factor eIF5A drives PEAK1 protein produc-tion and can be targeted with the FDA-approved anti-fungal agent Cyclopirox Olamine (CPX) to both decrease cellular PEAK1 levels and abrogate pancreatic cancer cell growth [39]. While further experimentation is needed to clarify whether CPX-mediated PEAK1 suppression pro-motes cytotoxicity and/or chemotherapy sensitization by converting the endogenous tone of TGFβsignaling from pro-tumorigenic to anti-proliferative, it is a promising prospect to already have identified a targeted therapeutic (i.e., CPX) that can block PEAK1 function but which shows limited off-target toxicity in clinical trials [48].
Although classified as a pseudokinase [49,50], our previous work [17] has demonstrated that the kinase domain within PEAK1 (aa. 1330–1664) has tyrosine kinase activity. Further-more, we’ve shown that the PEAK1 double point-mutant (K1369M/D1516A), which is pre-dicted to lack ATP-dependent activity, is unable to promote the proliferation of human pancreatic epithelial cells further suggesting a role for the catalytic functions of PEAK1 in its pro-tumorigenic roles [18]. While it is possible that the kinase domain plays an important role in PEAK1-mediated TGFβswitching, further studies are needed to evaluate the efficacy of PEAK1 kinase activity as well as potential substrates in this context. However, previous work from our group [17,18] and that of others [19,21,51], which shows that PEAK1 interacts with Src, Grb2 and Shc1 and can activate MAPK signaling pathways, suggests a scaffolding mecha-nism by which PEAK1 drives TGFβ-induced tumorigenic behavior. Work from the Schiemann laboratory has characterized novel mechanisms by which TGFβconverts from being a Smad2/ 3-dependent tumor suppressor to a Smad2/3-independent tumor promoter. More specifically, they have shown that extracellular matrix fibronectin (or other ECMs that bind/activate integ-rin beta 3) recruits Src kinase to phosphorylate TβRII at tyrosine 284. This leads to Grb2-TβRII binding and downstream MAPK signaling that can drive tumor progression in models of breast cancer [11,12]. These previous studies together with our current work demonstrating that PEAK1 promotes TGFβ-induced MAPK signaling in the presence of extracellular fibro-nectin (Fig 6) places PEAK1 at the center of this signaling cascade (Fig 8). While further work is necessary to elucidate the cellular biochemistry of these signaling events and the molecular determinants within PEAK1 that are essential to facilitate TGFβ-induced MAPK activation in this context, it is useful to consider how antagonists of PEAK1 (e.g., CPX) can be leveraged in combination with existing therapeutic interventions in breast cancer (e.g., Src kinase inhibi-tion) to combat this class of malignancies. In this regard, future studies should evaluate the suc-cess of such targeting combinations using preclinicalin vitroandin vivotumor models.
and sufficient for TGFβ-induced/fibronectin-dependent metastasis and resistance to Src kinase inhibition. This further understanding of the role of PEAK1 in TGFβsignaling during breast cancer progression should pave the way for the development of targeted therapies to block breast cancer progression and increase patient survival.
Methods
Cell Culture
MCF7 and MDA-MB-231 cells were obtained from the American Tissue Culture Collection (ATCC). MCF7 cells were cultured in DMEM/High-Glucose growth media supplemented with 10% FBS, and 10μg/mL insulin. MDA-MB-231 cells were cultured in DMEM/High-Glucose growth media supplemented with 10% FBS. MCF7 Vector and MCF7 PEAK1 were generated from the parental line in Dr. Richard Klemke’s laboratory as previously published [17]. MCF10A, MCF10AT1k, MCF10CA1h and MCF10CA1a cells were purchased from the Kar-manos Cancer Center (made in the laboratory of Dr. Fred Miller). MCF10A cells were cultured in DMEF12 growth media, supplemented with 5% horse serum, 10μg/mL insulin, 20ng/mL EGF, 0.5μg/mL hydrocortisone, 100ng/mL cholera toxin and antibiotics. MCF10AT1K cells were cultured in DMEF12 growth media, supplemented with 5% horse serum, 10μg/mL insu-lin, 20ng/mL EGF, 0.5μg/mL hydrocortisone and antibiotics. MCF10CA1h and MCF10CA1a cells were cultured in DMEF12 growth media and supplemented with 5% horse serum and antibiotics.
TGF
β
Treatments
Acute—Cells were plated at 3x10⁵cells/mL in 2mL and left to grow to 70% confluent. Cells were then serum starved for 8 hours, treated for 30 minutes with 2.5ng/mL TGFβof 0.1% BSA. Cells were lysed with RIPA Lysis Buffer containing phosphotase and protease inhibitors and a western blot was performed. Chronic—Cells were plated at 1x10^5 cells/mL in 2mL in a 6-well plate and left to attach overnight. Cells were then treated with 2.5ng/mL TGFβor 0.1% BSA. Cells were maintained (media changed every 48 hours and passaged when necessary) and retreated every 48 hours. Cells were expanded as needed.
Lentiviral Transduction
MCF10CA1h cells were plated at 1.6x10⁴cells/well into a 96-well plate and left to attach over-night. Cells were then treated with 10μL of viral particles containing a puromycin resistant pKLO.1 vector with a scramble shRNA or PEAK1-specific shRNA (3’-UTR targeting) in 110μL of complete media and left to incubate for 18hrs, after which the media was changed. The fol-lowing day media was changed and supplemented with 10μg/mL puromycin. Media was changed with puromycin supplemented media every 3 days until resistance was definite. Cells were then maintained in media containing puromycin.
Single Cell Migration Assays
Wound Healing Assays
Wells of a 24-well plated were coated for one hour with 3μg/mL of fibronectin, collagen, or laminin. MCF10 cells were plated at 8x10⁵cells/mL in 1mL of complete media. MCF7 cells were plated at 4x10⁵cells/mL in 1mL of complete media. Wells were treated with indicated treatments when necessary. Cells were allowed to attach overnight, then filled with media con-taining 1M HEPES, sealed and imaged every 10 minutes for 24 hours. Plates were imaged using a Leica widefeild-brightfeild phase contrast microscope and the data was analyzed with Fiji software. Two-way ANOVA analysis was performed to determine statistical significance.
Proliferation Assays
Wells of a 24-well plated were coated for one hour with 3μg/mL of fibronectin, collagen, or laminin. Cells were plated at 1x10⁴cells/mL in 200μL and allowed to attach overnight. Wells were then treated with the indicated treatments and imaged at 0, 24, 96 and 168 hours post-treatment. Cells per image were counted and graphed. Plates were imaged using a widefeild-brightfeild phase contrast microscope and the data was analyzed with Fiji software. Two-way ANOVA analysis was performed to determine statistical significance.
AQueous One Assays
Wells of a 24-well plated were coated for one hour with 3μg/mL of fibronectin, collagen, or laminin. Cells were plated at 1x10⁴cells/mL in 200μL and allowed to attach overnight. Wells were then treated with the indicated treatments then left for 72 hours. 20μL of AQueous One solution was added to each well and the absorbance was taken at 1.5, 2, and 3 hours after addi-tion of AQueous One Soluaddi-tion. Two-way ANOVA analysis was performed to determine statis-tical significance.
Western Blots
Cells were lysed with Stringent RIPA Lysis Buffer and rotated at 4°C for 3 hours. Lysates were then cleared by centrifugation, and the protein concentration was determined via a Bradford Assay. Then 4–12% Bis-Tris gels were ran and transferred to nitrocellulose membranes. The membranes were then probed at 4C overnight with indicated antibodies with the following dilutions: PEAK1 (abcam 1:1000), PEAK1 (santa cruz 1:500), N-cadherin (cell signaling 1:1000), E-cadherin (cell signaling 1:1000), Smad2/3 (cell signaling 1:1000), phospho-Smad2/3 (cell signaling 1:1000), Src (cell signaling 1:1000), phosphor-Src (Y567) (cell signaling 1:1000), Erk1/2 (cell signaling 1:1000), phospho-Erk1/2 (cell signaling 1:1000), beta-actin (PolySci 1:1000). Secondary antibodies were used at a 1:10,000 or 1:25,000 dilution. Band intensities were quantified using Fiji software after image thresh holding. Pixel intensity was collected from boxes of the same size placed around different bands–either and phospho:total protein or protein of interest:housekeeping protein ratios were calculated and plotted.
Quantitative PCR
of 10nmol/mL. 8.75μL of nuclease-free water was mixed with 2.5μL of diluted cDNA, 1.25μL of gene-specific primer, and 12.5μL of Thermo Scientific Maxima SYBR Green. Samples were run on an ABI 7300 instrument.
Cell Cycle Analysis
Cells were plated at 1x10⁵cells/mL in 2mL in a 6-well plate coated with 3μg/mL ECM/PBS solution. The following day, cells were treated with either with 2.5ng/mL TGFβor 0.1% BSA). After 72 hours cells were trypsinized, pelleted and resuspended in 1mL of PBS. Then 2.5mL of 100% ethanol was added to each sample and incubated on ice for 15 minutes. The samples were next centrifuged at 1500rpm for 5 minutes to form a pellet. Samples were resuspended in 500μL of 50μg/mL Propidium Iodide (PI) solution and incubated for 40 minutes at 37°C. PBS was added to each sample, and centrifuged at 1500rpm for 5 minutes to obtain a pellet. The pellet was resuspended in 1mL PBS and analyzed by flow cytometry (FlowJo Analysis Software).
Dose Response with Kinase Inhibitors
MCF7 Vector and PEAK1 control and TGFβtreated cells were plated at 1x10⁴cells/mL in 200μL in a 96-well plate coated with 3μg/mL of fibronectin. Cells were then treated with 1000μM, 100μM, 10μM, 1μM, or 0.1μM of AZM or SB-431542. After 72hrs an AQueous One assay was performed.
CAM in vivo Assay Cell Preparation
MCF10CA1h shRNA cells were plated at 6x10⁴cells/mL in 10mL in a 10cm plate coated with 3ug/mL fibronectin. The following day cells were treated with either 2.5ng/mL TGFβor 0.1% BSA. After 72 hours cells were trypsinized, counted and pelleted. Cells were then resuspended at 1x10⁶cells/20μL of matrigel. Cells were then xenografted onto the CAM of the prepared egg.
CAM in vivo Assay
Chicken eggs were purchased from Meyer Hatchery, and incubated for 10 days at 37°C, 60% humidity. The CAM Assay was preformed according to a previously described protocol [38]. On day 10 post fertilization, the CAM was dropped and the eggs were windowed. A plastic ring was then placed on the CAM and cells were xenografted within the ring. Surgical tape was then placed over the window, and the egg was then placed back into the incubator. After an addi-tional 7 day incubation, the egg was opened and the primary tumor was removed from the CAM. The embryo was then extracted from the egg and sacrificed. The liver and lung tissue was collected and flash frozen then stored at -80°C until processed. Upon processing, the tissue was thawed on ice, weighed and homogenized in digestion solution. Samples were then heated at 57°C for 5 hours. Genomic DNA was then extracted using Thermo Scientific GeneJet Geno-mic DNA purification kit. DNA concentration was then quantified by NanoDrop. gDNA was then diluted to 22.5ng/mL and qPCR was preformed for humanalurepeats and chicken GAPDH.
Supporting Information
lines were divided by biomarker status and the data were analyzed for PEAK1 expression relative to EMT gene signatures (epithelial or mesenchymal) that had been previously reported to change in response to PEAK1 expression in mammary epithelial cells.Linear regression analysis was performed and the Pearson r-values and associated p-values were cal-culated for the line of best fit for each data set.
(TIF)
S2 Fig.Top: Micrographs along the edge of a wounded monolayer of MCF10A, AT1K, CA1h and CA1a cells.Arrow indicate sites of increased lamellopodia formation.Bottom: Micrographs of MCF10A, AT1K, CA1h, and CA1a cells at sub-confluence. Arrow indicates a cell that is more spread and mesenchymal, representative of the whole population of CA1h cells (Scale bar: 90μm).
(TIF)
S3 Fig. Single cell migration assays were performed on the indicated cell populations when plated on the various ECM substrates (i.e., Fibronectin—F, Collagen—C, Laminin—L, or Plastic–P).3 images per condition were collected every 10 minutes for 24 hours. Cells were tracked using Fiji software.10 representative cell tracks for each of the indicated cell popula-tions are shown when cells were migrating on fibronectin.
(TIF)
S4 Fig. Using microarray data from previously published breast cancer patient data, the correlation between PEAK1 and TGFβresponse genes was observed in relation to clinical outcome and biomarker status.Statistical significance was calculated using a unpaired stu-dent’s t-test.
(TIF)
S5 Fig. (A) Western blot analysis on MCF7-Vector and–PEAK1 cells for indicated proteins and phosphor-proteins. (B) Proliferation assay with the MCF7-Vector and–PEAK1 cells, plated on plastic and imaged at 0, 24, 96, and 168 hours. Cells were counted using Fiji Soft-ware and ANOVA statistical analysis was performed. Cell number vs. time in hours is plot-ted. (C) Cell cycle analysis of MCF7-Vector and–PEAK1 cells showing cell cycle stage percentages in the inlay. (D) AQueous One assay was performed on the CA1h-shCntrl and-shPEAK1 cells 72 hours after plating on plastic. The relative cell number was plotted and ANOVA statistical analysis was performed using Prism software. The inlay shows a western blot of PEAK1 andβ-actin confirming knockdown of PEAK1. (E) Cell cycle analysis of CA1h -shCntrl and–shPEAK1 cells showing cell cycle stage percentages in the inlay. indicate p-values<0.001.
(TIF)
S6 Fig. Phase and overlay of GFP channels for MCF7-Vector/Control,-Vector/TGFβ ,-PEAK1/Control and–PEAK1/TGFβcells plated on fibronectin.
(TIF)
Acknowledgments
Author Contributions
Conceived and designed the experiments: JAK MA AC DB. Performed the experiments: MA AC MH AH DB SLK. Analyzed the data: JAK MA. Contributed reagents/materials/analysis tools: RLK. Wrote the paper: JAK MA.
References
1. Eswaran J, Cyanam D, Mudvari P, Reddy SD, Pakala SB, Nair SS, et al. (2012) Transcriptomic land-scape of breast cancers through mRNA sequencing. Sci Rep 2: 264. doi:10.1038/srep00264PMID: 22355776
2. Yalcin B (2013) Staging, risk assessment and screening of breast cancer. Exp Oncol 35: 238–245.
PMID:24382431
3. Shi Y, Massague J (2003) Mechanisms of TGF-beta signaling from cell membrane to the nucleus. Cell 113: 685–700. PMID:12809600
4. Kalluri R, Weinberg RA (2009) The basics of epithelial-mesenchymal transition. J Clin Invest 119: 1420–1428. doi:10.1172/JCI39104PMID:19487818
5. Thiery JP, Lim CT (2013) Tumor dissemination: an EMT affair. Cancer Cell 23: 272–273. doi:10.1016/
j.ccr.2013.03.004PMID:23518345
6. Massague J, Gomis RR (2006) The logic of TGFbeta signaling. FEBS Lett 580: 2811–2820. PMID:
16678165
7. Massague J (2008) TGFbeta in Cancer. Cell 134: 215–230. doi:10.1016/j.cell.2008.07.001PMID:
18662538
8. Massague J (2012) TGF-beta signaling in development and disease. FEBS Lett 586: 1833. doi:10. 1016/j.febslet.2012.05.030PMID:22651913
9. Massague J (2012) TGFbeta signalling in context. Nat Rev Mol Cell Biol 13: 616–630. doi:10.1038/
nrm3434PMID:22992590
10. Wendt MK, Tian M, Schiemann WP (2012) Deconstructing the mechanisms and consequences of TGF-beta-induced EMT during cancer progression. Cell Tissue Res 347: 85–101. doi:10.1007/
s00441-011-1199-1PMID:21691718
11. Galliher-Beckley AJ, Schiemann WP (2008) Grb2 binding to Tyr284 in TbetaR-II is essential for mam-mary tumor growth and metastasis stimulated by TGF-beta. Carcinogenesis 29: 244–251. doi:10.
1093/carcin/bgm245PMID:18174260
12. Galliher AJ, Schiemann WP (2007) Src phosphorylates Tyr284 in TGF-beta type II receptor and regu-lates TGF-beta stimulation of p38 MAPK during breast cancer cell proliferation and invasion. Cancer Res 67: 3752–3758. PMID:17440088
13. Wendt MK, Smith JA, Schiemann WP (2009) p130Cas is required for mammary tumor growth and transforming growth factor-beta-mediated metastasis through regulation of Smad2/3 activity. J Biol Chem 284: 34145–34156. doi:10.1074/jbc.M109.023614PMID:19822523
14. Wendt MK, Schiemann WP (2009) Therapeutic targeting of the focal adhesion complex prevents onco-genic TGF-beta signaling and metastasis. Breast Cancer Res 11: R68. doi:10.1186/bcr2360PMID: 19740433
15. Taylor MA, Davuluri G, Parvani JG, Schiemann BJ, Wendt MK, Plow EF, et al. (2013) Upregulated WAVE3 expression is essential for TGF-beta-mediated EMT and metastasis of triple-negative breast cancer cells. Breast Cancer Res Treat 142: 341–353. doi:10.1007/s10549-013-2753-1PMID:
24197660
16. Kelber JA, Klemke RL (2010) PEAK1, a novel kinase target in the fight against cancer. Oncotarget 1: 219–223. PMID:21301050
17. Wang Y, Kelber JA, Tran Cao HS, Cantin GT, Lin R, Wang W, et al. (2010) Pseudopodium-enriched atypical kinase 1 regulates the cytoskeleton and cancer progression [corrected]. Proc Natl Acad Sci U S A 107: 10920–10925. doi:10.1073/pnas.0914776107PMID:20534451
18. Kelber JA, Reno T, Kaushal S, Metildi C, Wright T, Stoletov K, et al. (2012) KRas induces a Src/ PEAK1/ErbB2 kinase amplification loop that drives metastatic growth and therapy resistance in pancre-atic cancer. Cancer Res 72: 2554–2564. doi:10.1158/0008-5472.CAN-11-3552PMID:22589274
19. Zheng Y, Zhang C, Croucher DR, Soliman MA, St-Denis N, Pasculescu A, et al. (2013) Temporal regu-lation of EGF signalling networks by the scaffold protein Shc1. Nature 499: 166–171. doi:10.1038/
20. Obenauer JC, Cantley LC, Yaffe MB (2003) Scansite 2.0: Proteome-wide prediction of cell signaling interactions using short sequence motifs. Nucleic Acids Res 31: 3635–3641. PMID:12824383
21. Croucher DR, Hochgrafe F, Zhang L, Liu L, Lyons RJ, Rickwood D, et al. (2013) Involvement of Lyn and the atypical kinase SgK269/PEAK1 in a basal breast cancer signaling pathway. Cancer Res 73: 1969–1980. doi:10.1158/0008-5472.CAN-12-1472PMID:23378338
22. Radvanyi L, Singh-Sandhu D, Gallichan S, Lovitt C, Pedyczak A, Mallo G, et al. (2005) The gene asso-ciated with trichorhinophalangeal syndrome in humans is overexpressed in breast cancer. Proc Natl Acad Sci U S A 102: 11005–11010. PMID:16043716
23. Loi S (2008) Molecular analysis of hormone receptor positive (luminal) breast cancers: what have we learnt? Eur J Cancer 44: 2813–2818. doi:10.1016/j.ejca.2008.09.012PMID:18990560
24. Loi S, Haibe-Kains B, Desmedt C, Wirapati P, Lallemand F, Tutt AM, et al. (2008) Predicting prognosis using molecular profiling in estrogen receptor-positive breast cancer treated with tamoxifen. BMC Genomics 9: 239. doi:10.1186/1471-2164-9-239PMID:18498629
25. Finak G, Bertos N, Pepin F, Sadekova S, Souleimanova M, Zhao H, et al. (2008) Stromal gene expres-sion predicts clinical outcome in breast cancer. Nat Med 14: 518–527. doi:10.1038/nm1764PMID:
18438415
26. Lu X, Wang ZC, Iglehart JD, Zhang X, Richardson AL (2008) Predicting features of breast cancer with gene expression patterns. Breast Cancer Res Treat 108: 191–201. doi:10.1007/s10549-007-9596-6
PMID:18297396
27. Uhlen M, Oksvold P, Fagerberg L, Lundberg E, Jonasson K, Forsberg M, et al. (2010) Towards a knowl-edge-based Human Protein Atlas. Nat Biotechnol 28: 1248–1250. doi:10.1038/nbt1210-1248PMID:
21139605
28. Neve RM, Chin K, Fridlyand J, Yeh J, Baehner FL, Fevr T, et al. (2006) A collection of breast cancer cell lines for the study of functionally distinct cancer subtypes. Cancer Cell 10: 515–527. PMID:17157791
29. Dawson PJ, Wolman SR, Tait L, Heppner GH, Miller FR (1996) MCF10AT: a model for the evolution of cancer from proliferative breast disease. Am J Pathol 148: 313–319. PMID:8546221
30. Xu J, Lamouille S, Derynck R (2009) TGF-beta-induced epithelial to mesenchymal transition. Cell Res 19: 156–172. doi:10.1038/cr.2009.5PMID:19153598
31. Padua D, Zhang XH, Wang Q, Nadal C, Gerald WL, Gomis RR, et al. (2008) TGFbeta primes breast tumors for lung metastasis seeding through angiopoietin-like 4. Cell 133: 66–77. doi:10.1016/j.cell.
2008.01.046PMID:18394990
32. Kao KJ, Chang KM, Hsu HC, Huang AT (2011) Correlation of microarray-based breast cancer molecu-lar subtypes and clinical outcomes: implications for treatment optimization. BMC Cancer 11: 143. doi: 10.1186/1471-2407-11-143PMID:21501481
33. Miyake T, Nakayama T, Naoi Y, Yamamoto N, Otani Y, Kim SJ, et al. (2012) GSTP1 expression pre-dicts poor pathological complete response to neoadjuvant chemotherapy in ER-negative breast cancer. Cancer Sci 103: 913–920. doi:10.1111/j.1349-7006.2012.02231.xPMID:22320227
34. Stickeler E, Pils D, Klar M, Orlowsk-Volk M, Zur Hausen A, Jager M, et al. (2011) Basal-like molecular subtype and HER4 up-regulation and response to neoadjuvant chemotherapy in breast cancer. Oncol Rep 26: 1037–1045. doi:10.3892/or.2011.1392PMID:21769435
35. Yang J, Weinberg RA (2008) Epithelial-mesenchymal transition: at the crossroads of development and tumor metastasis. Dev Cell 14: 818–829. doi:10.1016/j.devcel.2008.05.009PMID:18539112
36. Tang B, Yoo N, Vu M, Mamura M, Nam JS, Ooshima A, et al. (2007) Transforming growth factor-beta can suppress tumorigenesis through effects on the putative cancer stem or early progenitor cell and committed progeny in a breast cancer xenograft model. Cancer Res 67: 8643–8652. PMID:17875704
37. Tang B, Vu M, Booker T, Santner SJ, Miller FR, Anver MR, et al. (2003) TGF-beta switches from tumor suppressor to prometastatic factor in a model of breast cancer progression. J Clin Invest 112: 1116–
1124. PMID:14523048
38. Zijlstra A, Mellor R, Panzarella G, Aimes RT, Hooper JD, Marchenko ND, et al. (2002) A quantitative analysis of rate-limiting steps in the metastatic cascade using human-specific real-time polymerase chain reaction. Cancer Res 62: 7083–7092. PMID:12460930
39. Fujimura K, Wright T, Strnadel J, Kaushal S, Metildi C, Lowy AM, et al. (2014) A hypusine-eIF5A-PEAK1 switch regulates the pathogenesis of pancreatic cancer. Cancer Res.
40. Zhang S, Huang WC, Zhang L, Zhang C, Lowery FJ, Ding Z, et al. (2013) SRC family kinases as novel therapeutic targets to treat breast cancer brain metastases. Cancer Res 73: 5764–5774. doi:10.1158/
0008-5472.CAN-12-1803PMID:23913825
42. Xu J, Acharya S, Sahin O, Zhang Q, Saito Y, Yao J, et al. (2015) 14-3-3zeta Turns TGF-beta's Function from Tumor Suppressor to Metastasis Promoter in Breast Cancer by Contextual Changes of Smad Partners from p53 to Gli2. Cancer Cell 27: 177–192. doi:10.1016/j.ccell.2014.11.025PMID:25670079
43. Gray PC, Shani G, Aung K, Kelber J, Vale W (2006) Cripto binds transforming growth factor beta (TGF-beta) and inhibits TGF-beta signaling. Mol Cell Biol 26: 9268–9278. PMID:17030617
44. Akhurst RJ, Hata A (2012) Targeting the TGFbeta signalling pathway in disease. Nat Rev Drug Discov 11: 790–811. doi:10.1038/nrd3810PMID:23000686
45. Matsuura I, Lai CY, Chiang KN (2010) Functional interaction between Smad3 and S100A4 (metastatin-1) for TGF-beta-mediated cancer cell invasiveness. Biochem J 426: 327–335. doi:10.1042/
BJ20090990PMID:20070253
46. Schiemann BJ, Neil JR, Schiemann WP (2003) SPARC inhibits epithelial cell proliferation in part through stimulation of the transforming growth factor-beta-signaling system. Mol Biol Cell 14: 3977–
3988. PMID:14517312
47. Rivera LB, Brekken RA (2011) SPARC promotes pericyte recruitment via inhibition of endoglin-depen-dent TGF-beta1 activity. J Cell Biol 193: 1305–1319. doi:10.1083/jcb.201011143PMID:21708981
48. Weir SJ, Patton L, Castle K, Rajewski L, Kasper J, Schimmer AD (2011) The repositioning of the anti-fungal agent ciclopirox olamine as a novel therapeutic agent for the treatment of haematologic malig-nancy. J Clin Pharm Ther 36: 128–134. doi:10.1111/j.1365-2710.2010.01172.xPMID:21366640
49. Murphy JM, Zhang Q, Young SN, Reese ML, Bailey FP, Eyers PA, et al. (2014) A robust methodology to subclassify pseudokinases based on their nucleotide-binding properties. Biochem J 457: 323–334.
doi:10.1042/BJ20131174PMID:24107129
50. Manning G, Whyte DB, Martinez R, Hunter T, Sudarsanam S (2002) The protein kinase complement of the human genome. Science 298: 1912–1934. PMID:12471243