The Photoaousti Spetrosopy Applied in the
Charaterization of the Cross-linking Proess
in Polymeri Materials
D. T. Dias,A. N. Medina, M. L.Baesso, A. C. Bento
,
UniversidadeEstadualde Maringa, Departamentode Fsia
Av. Colombo5790,87020-900, Maringa-Parana, Brazil
M. F. Porto, and A. F. Rubira
UniversidadeEstadual de Maringa,Departamento deQumia
Av. Colombo5790,87020-900, Maringa-Parana, Brazil
Reeivedon6November,2001
In this work we used the Photoaousti Spetrosopy (PAS)to evaluate the rosslinking of the
opolymerfromethylenevinyltrimethoxysilane(EVS)andthegraftedvinyltrimethoxysilane(VTS)
onlowdensitypolyethylene(LDPE).PASisusedforsoundingtheovertonebandsand strething
frequenies ombinations of the groupings -Si-OH, =CH2, -CH3 and -CH2-CH3, inthe near and
mediuminfraredrange. Thesamplesweretypiallypreparedwith3%,5%and7%ofatalystand
rosslinked inthetemperatures of70, 80and 90 0
C.Using theovertonebandsof -OHgroupsthe
PASshowstheoptimumombination,pointingabetterrosslinkingeetfor80 0
Candintherange
5%to7%ofatalyst,typially.
I Introdution
ThePhotoaoustiSpetrosopy(PAS)isusuallyused
for a nondestrutive analysis of a variety of
materi-als in the visible and infrared range[1, 2℄. As it is a
spetrosopitehnique,itisexpetedthatidentifying
the absorption bands in the ross-linking proess an
follow the ross-linking proess. Although the
ross-linkingproessouldbemonitoredusingFourier
trans-formtehnique(FTIR)inthefarinfraredrange(10000
to40000m 1
),byusingthePAStehniqueitismade
easiertoanalyzetheproessinthenearinfrared(NIR,
800 to 1600 nm) and medium infrared (MIR, 1600 to
3200 nm) beauseof theovertones of hydroxyl bonds
and their ombination with strething modes of CH
bondsthat arefoundeither moredened orseparated
in thisspetralrange[3,4℄.
Nowadays, polymeri materials have been largely
utilizedinindustriesforproduingawiderangeof
spe-ial goods, eah one for a spei purpose of
appli-ation. It is onerned that medium voltage
applia-tionisabigdealforboththegraftedPEandethylene
vinyltrimethoxysilane(EVS)duetotheneedsofagood
thermalondutivityandhigheletririgidity. The
re-dution of the eletririgidity ours after rystalline
phaseisbrokenupeitherduringfabriproessorafter
theextremeonditionsofusagelikeinthehostile
envi-Oneof mostutilized polymerispolyethylene(PE)
thatshouldbemodiedtoahievetheeletri
require-ments to be used as insulating material. Aside
ther-moplastiandrubberross-linked,PEistheworldwide
usedaseletrialinsulatingwires,espeiallyin
applia-tionsthatneedhightemperatureoperation. The
physi-alpropertiesofross-linkedPEanbeenhanedinthis
proessandtheywillbedependentontheross-linking
rate[6℄. Usually,thePEross-linkedby meansof
Sio-plastehnology[7℄, isfoundmostly in thelowvoltage
wiring,beauseitomprisesagoodheattransferallied
totheloweletrialondutivity.
InthispaperwepresentthePASstudyofthe
ross-linkingproessinthegraftedPEandfortheCopolymer
EVS.Theovertonesbandarefollowedforasetof
sam-plesthatwerepreparedusingmainlytwofreevariables,
atalystonentrationandtemperatureofwatervapor,
utilizedforross-linkingthepolymers.
II Photoaousti Method
Thespetralrange of ourinterest hereis 700 to 2600
nmorrespondingto NIR and MIR region, where the
absorptionbandsaremainlyduetoovertonesand
ro-asstrething,bending, sissoring,waggingmakeit
dif-ultto assignthefundamental absorption.
Themoleulespresentaharmonibehaviorfor
high-energyvibrationalstatesandpresentatendenyof
dis-soiation if the bond has a high potential energy. In
thisasethevibrationalstatenolongeranbehavesas
aharmoniosillatorandanharmonistatetakesplae.
It an be shown that for an anharmoniosillator
theenergyisgivenby[8,9,10℄:
E=h
os
(+1=2) h
os x
e
(+1=2) 2
+h
os y
e
(+1=2) 3
+:::; (1)
d
herex
e andy
e
areanharmonionstants,isthe
quan-tum level index,
os
= (=
0
) is the osilattor
fre-queny, being the speed of light and
0
is the
fun-damentalabsorptionpeakinnmorm 1
.
Themostremarkablefeatureofsuhamoleular
an-harmonivibrationisthattransitionformorethenone
energylevelisallowed. Theovertonestransitionrates
isinreasedanditreduesthetransitionprobabilityfor
higherenergybands, sothe1 st
overtoneisweakerand
so it will be the 2 nd
one if they are ompared to the
fundamental absorption. The overtone may our at
wavelength between
0
=2and
0
=3and thusthe
over-tones foraspei moleuledo notouratthe same
spetralregion.
Thenearinfraredregionisdominatedbystrething
modesofO H,N H,andC H bondinbothways
asovertonesor asombination with other vibrational
types. Theovertonebandsanbebetterisolatedinthe
NIRand MIR region due to the anharmonionstant
variation or better instrumental resolution. If a
spe-i overtoneis assigned then it anbe taken for the
analysis.
Bymeans ofthe PAS method, in the region
1050-2600nmwewereabletoidentifyandassignthe
absorp-tion bands for thepolyethylene,referring to the
over-tonesand theirombinationwithstrething modes. It
waspossibletoaompanyingtheross-linkingproess
ofthesampleinanindiretway.
The photoaousti eet onsists in generating an
aoustisignalinsideatightlylosedelllledwithgas.
Theaoustisignalomesfromasamplethattransfers
heat to the gas after being illuminated by modulated
light in a given frequeny !. The heat is transferred
intothegasatthesamefrequenyassampleisheated
produingthentheperiodipressureutuationinside
the hamber. A sensitive mirophone oupled in the
elldetets this eet. Theatual temperature in the
samplesurfaeis givenby[1℄:
F (0)=
I
o
k
s
2
s (r
2
1)
(b+1)(r 1)e
s l
s
(b 1)(r+1)e
s l
s
+2(b r)e l
s
(g+1)(b+1)e sls
(g 1)(b 1)e sls
; (2)
d
where
b= k
b a
b
k
s a
s
; g=
k
g a
g
k
s a
s
; r=(1+j)
2a
s =
s ;
(3)
a
i
is athermaldiusion length (m 1
), is the
opti-alabsorption oeÆientatawavelength(m 1
)with
intensityI
0
,isthethermalondutivity(al/s.m. 0
C),
and de index \s" stands for sample, b= baking and
g=gas. Equation2is obtainedbysolvingtheoupled
setofdiusionequationfortheadjaentmedium: gas,
sampleandsamplebaking. RosenwaigandGersho[1℄
showedthat if boundaryonditionsare applied to the
heat owand temperature ontinuity in theinterfaes
andEq. (2)anbesimpliedusingthe harateristis
ofthesampleafteromparingthenwiththosespeied
forthegasandbaking.
The photoaousti signal is shown to be given by
theequation:
S
F =
P
o (0)
`
g
g T
o
e
jF
; (4)
where is the spei heat ratio
p =
v ,
g
is the gas
pressureand theroomtemperature,respetively. The
instrumental phaseis
f
and thegasolumn depthis
`
g
,and(0)istheinterfaesample-gastemperature.
III Experimental
III.1 Material and the Cross-linking
Method
It is known that bothopolymerEVS andgrafted
PE are suseptibleto ross-linkingwhen they are
un-der vapor ondition and also it is known that these
ross-linked materials presenting some strutural
dif-ferenes. In the silane grafted polyethylene, the
vinyl trimethoxysilaneis graftedto thepolymerhain
throughthe H
abstrationfrom main hain, resulting
in aC2bridgebonded tothetrimethoxysilane. Inthe
EVSopolymersystemthetrimethoxysilanewere
intro-duedduringthepolymerizationandthe
trimethoxysi-lane group is bonded to the main hain through the
silionatom.
Intheaseofsilaneross-linkingunderwatervapor
andinthepreseneofondensationatalyst,thealkoxy
group of the silane derivative is onverted to silanol
group and undergoes a ondensation reation with a
hydroxyl in a adjaent hain to form \Si O Si"
typenetwork. Both,thehydrolysesofalkoxysilaneto
silanol and their ondensation reation ours almost
instantaneously[11℄.
The ross-linking mehanism of silane grafted PE
and EVS opolymer used here follows that desribed
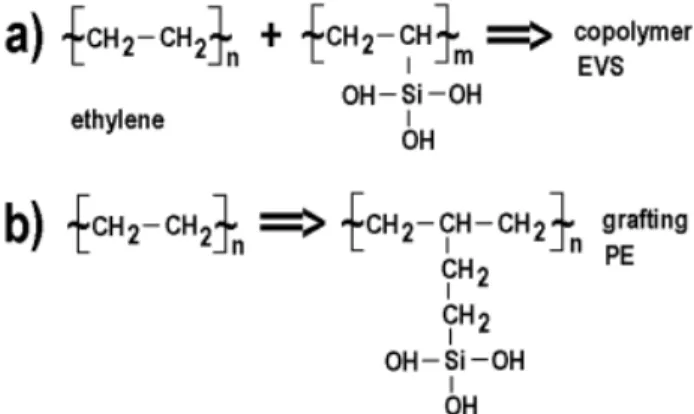
by Kumar [12℄ and Hjertberg [13℄, respetively, (see
Fig. 1.) Silane-graftedPEresultsinalongerandmore
mobile networkwhen omparedwith theEVS
opoly-mer and they have been subjet of studies of many
researhes. The interest is foused in many
impor-tantfatorsseekingabetterunderstandingabout
ross-linking kinetis[14,15,16℄andalsoonthe
morpholog-ialhangesinduedinthepolymerhain[5,17,18℄.
Figure 1. Mehanism of ondensation reation of silanol
groups: a)CopolymerEVSandb)Silanegrafted PE.
For thepresentpaperwehavetakenthe nal
on-trosopi analysis of the ross-linking proess in the
nearandmediuminfraredrange.
III.2 Sample Preparation
Commerial pellets of opolymer (200 g) were
ex-truded with three dierent onentration of atalyst
that is utilized as ross-linking initiator. The pellets
werethenmilledinaknifedmillsuitableforpolymers.
Afterthis stepthepiees were hotpressedin order to
perform theopolymerlms (85 595m thik) and
plaedinafreezerafterbeinglokedinspeialpaking.
Thepelletsoflowdensitypolyethylene(LDPE)(600
g) was kept in a oven at 80 0
C for 12h and after, it
wasgraftedwith 40mlofvinyltrimethoxysilane(VTS)
whose reation was initiated by 2.5g of benzoyl
per-oxideby steering thesolution during 1h. The grafted
LDPEwasthenextrudedusingthesameamountof
at-alystasintheopolymerEVSdesribedabove,keeping
alsothesamesteeringveloity,torh rateand
temper-ature. Thenal grafted LDPE, after beinggrounded,
washotpressedto makelms(90-385mthik),were
maintainedinadequatereipientsandkeptinafreezer
before theross-linkingproess.
The grafted (LDPE + VTS) polymer (hereafter
named as PE
g
) and the opolymer EVS (named as
Cop)lms wereross-linkedin humidity saturated
at-mosphereinaglassreatorfor8hoursinthermostati
ontrolledbathatdierenttemperatures. Inthiswaya
3 2
fatorialplanningdesignhasbeenapplied,the
tem-perature levelswere 70, 80 and90 0
C andthe atalyst
onentration were 3, 5 and 7%, in mass. It resulted
innineexperimentsplusthethreebasesample,onefor
eahonentrationofatalyst.
III.3 Analysis
Figure 2 shows the home made experimental
ar-rangement for the spetrosopi analysis. It is
om-prised of an ar lamp of 1000 Watts produed using
highpressureXenongas(ORIEL68820). Emittedlight
is ollimated into the inlet slit of the
monohroma-tor (ORIEL 77250) whih is settled to refrat visible
lightbymeansofgratingin thevisible region(ORIEL
77296),near infrared (ORIEL 77299)andmedium
in-frared(ORIEL 77300). Theyallow one to san
wave-lengthsfrom 180to 800nm, 800to 1600nmand1600
to 3200 nm, respetively. The dirated wavelengths
passes throughout anoutlet slit3 mm wideand after
gettingo the monohromator, the superior orders of
diration is eliminated by means of a band pass
op-tial lters. Monohromati light is then modulated
usingahighstabilitymehanialhopper(StanfordSR
540) that gives to the systemthe referene pulse
sig-nalthatis feedinto thelok-in amplier(EGG 5110).
beam is direted onto the photoaousti ell, passing
by a quartz window and heats the sample. The ell
body has a very sensitive and apaitive mirophone
oupledin(Bruel&KjaerBK2669). The
photoaous-ti signalis olletedby the mirophone and fed into
the lok-in. A personal omputer(PC) using a usual
IEEEboardingperformsthesignaldetetionand
wave-lengthssanning. The PAS aquisitions were all done
using thefrequeny of 20 Hzand the light powerwas
800W.
Figure2. Photoaoustispetrometerarrangement. MC =
monohromator; Flter seleting band; M=mirror; L=
lens; C= hopper; LIA lok-in-amplier; PC =omputer
fordataaquisition.
IV Results and Disussion
As we alreadyhavedisussed earlier, theusage ofthe
PAS was really neessary in order to follow the
over-tones of the absorption bands referring to hydroxyl
bonds and their ombinations with strething modes
that wereseenpresentedin thespetralregionof NIR
and MIR. This was an eÆient way for studying the
raisingoftheross-linking.
The total PAS spetra (NIR+MIR) for a
spe-i sample grafted polyethylene with VTS (oded as
PE
g 7%80
0
C)anbeobservedin Fig. 3.
Thisisarepresentativespetrumobservedforboth
set of samples, grafted PE and opolymer EVS. The
whole set of PAS spetra is not shown but the same
absorption struture wasobserved, despite of existing
small dierenes in the intensities. Furthermore, no
suhabsorptionband ouldberelatedstraightforward
to the silanes group in the spetral range used. The
observation of these groups ould be very helpful as
theyindiatediretlytheross-linkingofthematerial.
FTIR experimentsouldonly showthat silanesgroup
waspresentand so,that theross-linkingproesswas
initiated,buttheywerenotabletoshowanyevolution
thatwouldhelpusin thisstudy.
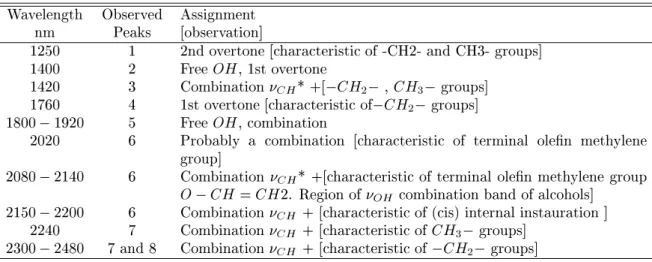
The bands assignments for the samples used here
were done by omparing the found absorption peaks
withsomepreliminarystudiesinthepolyethyleneitself
[12,13℄.thathavepresentedtheassignmentforalmost
absorptionbandsobservedin oursamples[19,20℄.
We analyzed our PAS spetra and by omparing
them wehaveassigned thepolyethylene. TableI
sum-marizesourndingsandinthistabletheolumnnamed
\peaks"arethelabeledpeakspresentedinFig. 3.
1200
1600
2000
2400
0
5
10
15
20
25
30
Peaks 7 8
Peaks
1 2 3 4 5 6
Nor
m
al
iz
ed PAS s
ignal
(
au)
Wavelength (nm)
Figure 3. Typial photoaousti spetrum for the
PE
g 7%80
0
Csamplegivenagainstwavelengthinnm.
ThewaywetookforanalyzingthePASspetrawas
doneperformingagaussianttingofthespetraby
set-tingtheeightmostprominentpeaksobservedinFig. 3.
Theanalysisstrategywastotaketheratioofintensities
fortwodistintpeaksforasample,performing
normal-izationwiththesameratioofitsrespetive\base". In
thiswayoneanobservesiftheross-linkinginreases
ordereasesthis \ratio". The followingequation was
usedin thisanalysis[21℄:
ratio(i;j)= (peak
i =peak
j )
sample%
(peak
i =peak
j )
base%
(5)
ByreturningtoFig.1(a)andFig. 1(b)whihshows
theondensationreationinvolvedintheross-linking
proessforPE
g
andCop,oneanonludethatsample
presentingPASspetrawithreduedintensityratiofor
-OH groups,baseduponEq. (5), indiatedthat more
ross-linksareformedonethesilanegroupsare
ross-linkedbymeansofthehydroxylradial.
Followingthisstatementswehaveplottedallratios
ofthesampleinFigs. 4(NIR)and5(MIR).Weadvise
the reader that these two guresare only
representa-tivesfor the PAS intensities ratio, vertial axis. The
horizontal axis gives us only a better visual sight of
TableI-Tabulatedinfraredbands assignedtoPEin NIRandMIRrange.[19℄
Wavelength Observed Assignment
nm Peaks [observation℄
1250 1 2ndovertone[harateristiof-CH2-andCH3-groups℄
1400 2 FreeOH,1stovertone
1420 3 Combination
CH
*+[ CH
2 ,CH
3
groups℄
1760 4 1stovertone[harateristiof CH
2
groups℄
1800 1920 5 FreeOH,ombination
2020 6 Probably a ombination [harateristi of terminal olen methylene
group℄
2080 2140 6 Combination
CH
*+[harateristiof terminal olenmethylenegroup
O CH =CH2. Regionof
OH
ombinationband ofalohols℄
2150 2200 6 Combination
CH
+[harateristiof(is)internalinstauration ℄
2240 7 Combination
CH
+[harateristiofCH
3
groups℄
2300 2480 7and8 Combination
CH
+[harateristiof CH
2
groups℄
*
CH
stands for all possible ombination modes of CH bonds, inluding symmetri and asymmetri vibration,
strething,rotation,torsion.
0
1
2
3
4
5
0
1
2
3
4
base
70
80
90
0
1
2
3
4
base
70
80
90
7 %
(a) Peak1/Peak2 Ratio
(-CH
2
and CH
3
) / (1
st
ov. Si-OH)
(b)
(a)
7 %
(b) Peak2/Peak3 Ratio
(1
st
ov. Si-OH) / (
ν
CH
+ -CH
2
- , -CH
3
)
5 %
N
o
rm
al
iz
ed
P
A
S
I
n
tensi
ty
(au)
5 %
3 %
3 %
0
1
2
3
4
5
0
1
2
3
4
base
70
80
90
0
1
2
3
4
base
70
80
90
7 %
(c) Peak1/Peak2 Ratio
(-CH
2
and CH
3
) / (1st ov. Si-OH)
7 %
(d) Peak2/Peak3 Ratio
(1st ov. Si-OH) / (
ν
CH
+ -CH
2
- , -CH
3
)
(d)
(c)
5 %
N
o
rm
alize
d P
A
S
Inte
ns
ity
(au
)
5 %
3 %
3 %
Figure4. NormalizedPASintensityintheNIRrangefor thepeaksratioa) Peak1/Peak2ofPEg samples;b)Peak2/Peak3
ofPE
g
,)Peak1/Peak2ofopolymerEVSsamples;d)Peak2/Peak3ofopolymerEVSsamples. Linesareeyeguides.
Looking at the normalized peak ratios plotted in
Fig. 4(a)-4(b) (PE
g
) and 4()-(d) (Cop), referringto
theNIRPASspetra,weanseethatbetweenthePE
g
and Cop sample with 5% atalyst and ross-linkedat
80 0
C presenteda better ross-linkingrate. The ratio
peak1/peak2,shownin Fig. 4(a)and 4()(frames for
urves 5%), were the most prominent and as a
on-sequene, the ratio peak2/peak3, Fig. 4(b) and 4(d)
(frames for urves 5%), presented a small dereases.
The latter, that is referred to the ratio [ 1 st
over-tone of Si-OH/ + -CH - , -CH ℄ also indiates
that the ombination group'sontribution to PAS
in-tensity ould be taking plae. As we already have
statedearlier,thisratiosmainlyshowsthateitherPAS
intensities assigned for Si-OH have dereased or the
PASratiofor-CH
2 -,-CH
3
andstrethingombination
CH
with the-CH
2
- and -CH
3
groups, havebeen
en-haned. For instane, this result at least shows that
samples PE
g 5%80
0
C and Cop5%80 0
C were the best
ross-linked ones. Still observing Fig. 4(a), sample
PE
g 7%80
0
PE
g 5%80
0
CwhilesamplesCop7%(Fig. 4())havenot
hange et all. On the other hand, the poorest
ross-linked set looked to be the 3% atalyst samples. For
both PE
g
and Cop in Fig. 4(a) and 4(), almost no
hanges an be seen in the frames for 3%, the ratio
[2 nd
overtones of CH
2
and CH
3 -/1
st
overtone of
Si OH℄is onstantbut, inFig. 4(b)and4(d), there
existanindiatorofapoorross-linkingproessforthe
whole setof 7%and3%atalyst, pointingthepoorest
asthePE
g
3%set,Fig. 4(b).
Figure 5shows the PAS intensities for normalized
peak ratios in the MIR region, where Fig. 5(a)-5(b)
are for PE
g
samples and Fig. 5()-(d) for Cop
sam-ples. Inthisgureweareplottingthenormalizedpeak
ratios for PAS absorption band assigned for 1 st
over-tone of -CH
2
-, ombination of free-OH and
ombina-tionof
CH
with CH
2
. Aording to ourstrategy
ofanalysisweonludethatsamplePE
g 5%80
0
Cseems
to bethe best ross-linkedin this spetralrange, Fig.
5(a) frame named 5%. By analyzing the plot ratios
forPE
g
3%andPE
g
7%weanseeadereasesinboth
plots,indiatingapoorross-linkingreation(seeFig.
5(a)frames3%and7%). IfwetakealookinFig. 5()
and(d)itispossibletoseesomedegreeofross-linkings
forsamplesCop3%80 0
C,Cop3%90 0
C,Cop5%80 0
Cand
also for Cop7%70 0
C. Although the inreases in these
normalizedplotratiosfor theMIRrangeshowalmost
thesameratio,ingeneraltheywereabout1.2,theNIR
rangeshowsabetterresult,where theratiowerenear
to4.0forPE
g 5%80
0
Candalmost3:0forCop5%80 0
C.
Theoveralloftheseresultsshowsthatbyfollowing
1 st
overtoneoffree OHand ombinationof strething
frequeniesfor CH
2
and CH
3
groupsin theNIR,
and alsothe1 st
overtoneof CH
2
andombination
frequenies of free OH in the MIR range, it is
possi-ble to have someinsightsabout the ross-linking
pro-ess in these two polymer, grafted PEwith VTS and
EVSopolymer. Mainlyitwasobservedthat80 0
Cwas
enoughtohaveagoodross-linkingwhenitisombined
with5%ofatalyst.
Owing to monitor the ross-linking eets that
wouldbepresentinthesample,wehavealsoperformed
aFrequenySanninginthelightpulseatsomespei
wavelengths. Therangeofthisfrequenysanningwas
10 to 100Hz at the wavelengths 1732 nm (peak4
as-signedas1 st
overtoneof CH
2
groupings),1850nm
(peak5 attributed to free OH ombination), 2300 nm
(peak7 ombination of CH
2
groups) and 2400 nm
(peak8also CH
2
ombination). Ingeneral,indoing
suhsanningonemaybeabletomakestudiesofdepth
prolesdistributionfortheabsorptiongroupsbeneath
the surfae of the polymer. This information is also
veryimportant beause the ross-linking ativation is
believedtostartatthepolymersurfae. Ourndingsin
studyingbothsilanegraftedPE(PE
g
)and opolymer
0
1
2
0
1
base
70
80
90
0
1
base
70
80
90
7 %
(a) Peak4/Peak5 Ratio
(-CH
2
-) / (-OH combination)
7 %
(b) Peak5/Peak8 Ratio
(-OH combination) / (
ν
CH
+ -CH
2
-)
(a)
5 %
N
o
rm
a
liz
e
d
P
A
S
I
n
tensi
ty
(
au)
(b)
5 %
3 %
3 %
0
1
2
0
1
base
70
80
90
0
1
base
70
80
90
7 %
(c) Peak4/Peak5 Ratio
(-CH
2
-) / (-OH combination)
7 %
(d) Peak5/Peak8 Ratio
(-OH combination) / (
ν
CH
+ -CH
2
-)
5 %
N
o
rm
a
liz
e
d
P
A
S
I
n
tensi
ty
(
au)
(d)
5 %
3 %
(c)
3 %
Figure 5. Normalized PAS intensity in the MIR range
for the peaks ratio a) Peak4/Peak5 of samples PE
g ; b)
Peak5/Peak8 of PEg; ) Peak4/Peak5 of opolymer EVS
samples;d)Peak5/Peak8ofopolymerEVSsamples. Lines
areeyeguides.
Byttingthelog-logplotsofPASintensityagainst
frequenyofpulseforallrepresentativepeaksdesribed
in thelastparagraph,weobservedthat theabsorption
bandintensitiesshowedanegativeslop,varyingas! a
,
where ! is theangularmodulationfrequenyin Hertz
and the tted parameter \a"is the slope. It was
ob-served\a"from0:9to1:2forthepeaksfromPE
g
sam-plesanditrunsfrom 1:0to1:4fortheCopsamples.
Aording to the photoaoustigeneral theory the
modulationofthefrequenyanbeusedasaprobeby
means of the expression (!) = (2=!) 1=2
depthpenetrationat!. Itmeansthatisruledbythe
frequeny !. So, at lowerfrequeniesthe
photoaous-ti intensity is mainly produed by the polymer bulk
absorptionandotherwise,athigherfrequenies,the
in-tensityisdue topolymersurfaeabsorbinggroups.
In a previous study in impregnated LDPE,
Gan-zarolli et al. [19℄ have proposed that if the slope \a"
islessthen( 3=2)oneanassumethattheabsorption
groupsthatis generatingthePASsignalmaybemore
onentratedin the polymersurfaeratherthan in its
bulk. The onsequene of this is that sample might
have anon-uniform thermal diusivity . In average,
the frequeny sanning at peaks assigned to 1 st
over-tone of CH
2
and to free OH ombination, peak4
and5,havenotshownsomuhdierenesforthePE
g
series. ThePASintensityslopewerefoundS
f !
0:8
and S
f !
0:9
, respetively, while it were observed
S
f !
1:3
forbothpeak7andpeak8.
Nowasto ompare,in theseries Copontheother
hand,thePASintensityslopewereobservedtobe
dif-ferentforpeak4,S
f !
1:2
,and peak5, S
f !
1:0
,
respetively. Forpeaks7and8thePASintensityslope
were almost not distinguished, remained in the range
S
f !
1:4
to S
f !
1:5
. Although the peak
in-tensityslopeshavenotshownanydistintross-linking
eet for both series, PE
g
and Cop,by using
frequen-iessanningweonludethatgroupings OH (peak5)
and CH
2
(peak7)havegreateronentrationinthe
polymer surfaerather than in their bulks. Also this
gradient pattern is greater for CH
2
than OH
grouping. Another onlusion we an retrieve from
intensities slopes is that grafted PE samples present
these absorbinggroups moreonentrated at the
sur-fae whenompared to slopesfound forCop samples.
Thisonlusionwassupported byanalyzingthewhole
PASspetraat20,40,50and80Hz,intherange1600
nmto 2600nmfor samplesPE
g
, itwasobservedthat
the peaks assigned for CH
2
and OH dereases
at higher frequenies, but the dereases is more
pro-nounedfor CH
2
groups(byomparingPAS
spe-tra at 20 and 80 Hz, respetively). That means that
whileintensityfor CH
2
isfading way,theintensity
for OH stillremainsat higherfrequenies.
IntableIIitissummarizedthealulationofthegel
ontent andrystalline perentage. Gelontentis
de-terminedbyweightingtheross-linkedpolymerbefore
and after it has been exposed to anappropriated
sol-vent. The ross-linkedphasehas averylowsolubility
whenexposed to thesolventpresentingintumesenes
[22℄. The degreeof rystallinity of this phase is then
determined by x-ray diration. The rystalline
fra-tion was obtained by integrating the peak area from
two peaks, one for assigned rystalline plane [110℄ at
221:60 andtheotherforplane[200℄at224:20.
Theamorphouspeakwasintegratedwiththeenterat
220:10[23, 24℄.
TableII -Summaryofapparentgelontentandrystallinity.
Samples Coding Apparentgelontent Crystallinityfromx-ray
(%) (%)
PE
g 3%70
0
C 32:7 70:1
PE
g 3%80
0
C 35:8 43:6
PE
g 3%90
0
C 44:7 37:9
PE
g 5%70
0
C 36:9 63:5
PE
g 5%80
0
C 37:5 60:1
PE
g 5%90
0
C 45:6 49:9
PE
g 7%70
0
C 45:2 65:4
PE
g 7%80
0
C 47:2 64:7
PE
g 7%90
0
C 49:3 48:8
Cop3%70 0
C 60:2 27:4
Cop3%80 0
C 55:2 71:0
Cop3%90 0
C 65:5 43:1
Cop5%70 0
C 67:1 62:2
Cop5%80 0
C 69:6 59:0
Cop5%90 0
C 74:9 40:7
Cop7%70 0
C 69:9 47:4
Cop7%80 0
C 74:4 36:7
Cop7%90 0
Itanbeobservedanapparentinreasinginthegel
ontentwithtemperatureforallatalystonentration.
The PE
g 5%80
0
C andPE
g 5%90
0
Cpresentnearlythe
same value of PE
g
7%. Also it an be seen that PE
g
samples present lower gel ontent then that for Cop.
Thisresultisbelievedtobeduetoapeuliarinreasing
of theross-linkings one the photoaoustifrequeny
sanningresultsindiatethat PE
g
hasamore
remark-ableross-linkingeets in the surfaewhereasin the
Cop,it looked tospreadout in thebulk. Inthe
anal-ysisof rystallinity,onean see that it dereaseswith
temperature andit isfollowsthat itindiates alarger
degree for PE
g
than that for Cop samples, if similar
samplesare tobeompared. Themajorityofsamples
inthesethavepointedthisway.
The onlusiononean takefrom the observed
ef-fetsisthatifsampleisross-linkedathigher
temper-ature, theross-linking degreeis enhanedand on an
opposite way, the degree of rystallinity dereases. It
appears that thereis aompetition betweenbothand
isreasonableto saythat 80 0
Cappears tobethe
opti-mizedpointforsamplepreparation.
V Conlusion
The PAS has pointed out that in the set of sample
weused,thebettervariableforross-linkingwas80 0
C
and atalyst in the range 5 to 7%, typially. It was
also shown that PAS isaapable tehniquefor ev
alu-ating ross-linking ratein opolymerand grafted PE,
byanalyzingtheovertonesabsorptionbandintheNIR
andMIR.Inthefrequenysanninganalysisitwas
ob-served no distint ross-linking eet for both series,
PE
g
and Cop, but it loatesgroupings OH (peak5)
and CH
2
(peak7)moreonentratedinthesurfae,
showingalargergradientfor CH
2
than OH.
In-tensities slopesindiate that graftedPEpresentthese
groups more onentrated at the surfae when
om-paredtothoseforCopsamples.
Aknowledgments
The authors aknowledge the Brazilian agenies
CNPqandCapesforthepartialsupportofthiswork.
Referenes
[1℄ A.Rosenwaig,Photoaousti andPhotoaousti
Spe-trosopy,(JohnWiley&Sons,NewYork,1980).
[2℄ D. P. Almond and P. M. Patel, Photothermal
Si-eneandTehnology,(Chapman&Hall,London,UK,
1996).
[3℄ H.VargasandL. C.M.Miranda,Phys.Rep.161,43
(1988).
[4℄ 11thICPPP-InternationalConfereneon
Photoaous-ti and Photothermal Phenomena, Book of abstrats,
ed.T.Sawada,25-29June/2000,Kyoto,Japan,
olle-tionofpaperstherein.
[5℄ S.Grzybowski,P.Zubielik,andE.Kuel,IEEE
Trans-ationsonPowerDelivery4,1507 (1989).
[6℄ H.G.Elias,inMaromoleules1Strututure and
Pro-prieties,2 nd
ed.,(PlenumPress,NewYork,1983).
[7℄ M.Markis,A.Tzur,A.Vaxman,Polym.Eng.Si.25,
13(1985).
[8℄ K.B.Whetsel,Appl.Spe.Rev.2,1(1968).
[9℄ L.G.Weyer,Appl.Spe.Rev.21,1(1985).[Inner
ref-erenes: S.Glasstone, Theoretial Chemistry. An
In-trodutiontoQuantumMehanis,Statistial
Mehan-is,andMoleularSpetraforChemists,VanNostrand,
NewYork,180(1944)℄.
[10℄ I.A. Cowe,Near InfraredAnalysis-Today or
Tomor-row?,Anal.Pro.(London),20,65(1983).
[11℄ S. Cartasegna, RubberChem. and Tehnol. 59, 722
(1986).
[12℄ A.KumarSen,B.Mukherjee,A.S.Bhattaharyya,P.
P.De,andA.K.Bhowmik,J.Appl. Polym.Si. 44,
1153(1992).
[13℄ T.Hjertberg, M.Palmlof, and B.A.Sultan, J.Appl.
Polym.Si.42,1185(1991).
[14℄ M. Palmlof, T.Hjertberg, and B.A.Sultan, J.Appl.
Polym.Si.42,1193(1991).
[15℄ A. K.Sem, B.Mukherjee, A.S.Bhattaharyya,P.P.
De, and A. K. Bhowmik, J. Therm. Anal. 39, 887
(1993).
[16℄ A.J.Muller,Z. H.Hernandez,M.L.Arnal,and J.J.
Sanhez,Polym.Bullet.39,465(1997).
[17℄ W.K.Wong,D.C.Varrall,Polym. 35,5447 (1994).
[18℄ I.L.Hosier,A.S.Vaughan,andS.G.Swingler,J.Mat.
Si.32,4523(1997).
[19℄ M.G.Oliveira,O.PessoaJr.,H.Vargas,andF.
Galem-bek,J.Appl.Polym.Si. 35,1791(1988).
[20℄ L.GlattandJ.W.Ellis,J.Chem.Phys.19,449(1951).
[21℄ D. T. Dias, Master Dissertation presented to
Depar-tamentodeFsia,UniversidadeEstadualdeMaringa,
Parana,Brazil, (2001).
[22℄ M. F. Porto, Master Dissertation presented to
Pro-grama de Mestrado em Qumia Apliada,
Universi-dadeEstadualdeMaringa-UEM,(2001).
[23℄ B.E.Warren,X-rayDiration,Addison-Wesley,
Lon-don,pp.13-16(1969).
[24℄ S.L.AggarwalandG.P.Tilley,J.Polym.Si.XVIII,