www.nat-hazards-earth-syst-sci.net/8/1417/2008/ © Author(s) 2008. This work is distributed under the Creative Commons Attribution 3.0 License.
and Earth
System Sciences
An observational and numerical study of a flash-flood event over
south-eastern Italy
M. M. Miglietta1and A. Regano1,*
1Institute of Atmospheric Sciences and Climate, Lecce, Italy
*now at: Museo Storico della Fisica e Centro Studi e Ricerche Enrico Fermi, Rome, Italy
Received: 22 February 2008 – Revised: 17 September 2008 – Accepted: 19 November 2008 – Published: 15 December 2008
Abstract. A flash-flood episode affecting a small area in
Apulia (south-eastern Italy) on 22 October 2005 is docu-mented. A rainfall amount of 160 mm was recorded in a 6 h interval in the central part of the region, producing severe damage and causing six fatalities. Synoptic maps, observa-tions from surface staobserva-tions and remote-sensing data are used here to describe the evolution of the rainfall system. The vertical profiles show features similar to those observed in other orographic heavy-rain events, such as a low-level jet, a conditionally unstable environment, and a nearly saturated warm low-level air mass. The low hills in the centre of the region play an important role in the release of the instabil-ity and the localisation of the rainfall, providing the uplift necessary to the air parcels to reach the level of free con-vection. Numerical simulations are performed in order to understand the mechanisms responsible for the heavy rain event. The Weather Research and Forecasting model (WRF) is setup in a 2-way nesting configuration including two do-mains. The model is able to realistically simulate the evolu-tion of the precipitaevolu-tion system and to capture fairly well the localisation, the amount and the timing of the rainfall. The simulations suggest the important synergy of low and upper-tropospheric features which act as the triggering mechanism for the development of convection. A sensitivity experiment confirms the importance of the orography for the develop-ment of convective cells.
Correspondence to:M. M. Miglietta ([email protected])
1 Introduction
Flash flooding is normally defined as a local flood of great volume and short duration due to heavy rainfall in the vicin-ity. It is characterized by the relatively small spatial scale (from a few to hundreds of km2) and the high rainfall inten-sity, normally concentrated in a short time period. As well as in many other temperate areas in the world, in Europe flash flooding is one of the most devastating natural hazards in terms of human life loss. As observed in the Intergovern-mental Panel on Climate Change (IPCC) Fourth Assessment Report (2007), the problem could be even more pressing in the near future, since heavy-rain events are expected to be-come more frequent in most future-climate scenarios.
The Mediterranean region is particularly affected by heavy-rain events, as different mechanisms can be responsi-ble for their occurrence (see Buzzi et al., 2005). Focusing our attention to Italy, a recent study collected the flood events af-fecting the region in the 20th century, showing that about half of all Italian towns have been damaged with floods induced by heavy rainfall (Guzzetti et al., 1994). Some remarkable flash floods have been recorded in localised areas in Italy in the last few years. In June 1996, an extraordinary event affected the Versilia sub-region in Tuscany (Gozzini et al., 1998). The rainfall amount reached locally about 400 mm in less than 6 h, with a maximum rainrate of 88 mm in 30 min. In September 2000, a severe flood occurred in Soverato, a small town along the Ionian coast of Calabria (Bellecci et al., 2003). A rainfall accumulation of 350 mm was recorded in 24 h with a peak of 185 mm in 6 h (Anquetin et al., 2004).
TARANTO
BRINDISI AIRPORT AD
RIATIC
SEA
IONIAN SEA
GARG
ANO
TYR
RHENIA
N SEA
BARI PALESE
ALTAMURA CASSANO MURGE
SANTERAMO OT
R A N T O C H A N N E L
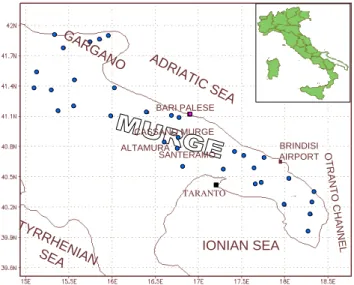
Fig. 1. Map of south-eastern Italy showing the position of the 33 surface stations, the radar site (Bari Palese) and the sounding station (Brindisi airport). The names of the stations and the geo-graphic areas mentioned in the paper are shown in the figure. The inset on the upper right side of the figure shows the location of the Apulia region (in white) with respect to the Italian peninsula.
frequency of southerly winds, which transport warm and moist air masses from the Mediterranean toward the coast and thus destabilize the atmosphere inland; and finally, the presence of complex orography in the area, which induce vertical motions and help to trigger convection.
Although the synoptic analysis can help to detect the con-ditions most favourable for the development of deep convec-tion, such as the presence of areas with upward large-scale velocity, low-level convergence of water vapour and convec-tive instability (Doswell, 1987), the main tool for the pre-diction of heavy rain comes from numerical weather fore-casting. In spite of the significant progress achieved in me-teorological modelling in the last few years, the occurrence and the intensity of localised heavy rain still remains diffi-cult to predict. In fact, uncertainties inherent in numerical modelling affect more adversely the smaller scales of mo-tion, such as the meso-β and meso-γ scales involved in this kind of events.
In the present study, observations and numerical simula-tions will be used to analyse a flash flooding affecting Apu-lia on 22 October 2005. ApuApu-lia is a region in south-eastern Italy bordering the Adriatic Sea to the east and the Ionian Sea to the southwest (Fig. 1). The topography of the re-gion is characterised mainly by large planes; some hills are present in the northern part (promontory of Gargano) and in the central part, where they are known as Murge hills. This small mountain chain has different shape, origin and nature with respect to the Apennines; its height, which at its north-ern side is nearly 700 m, decreases progressively towards the southeast. Apulia has a typical Mediterranean climate, due
to the mitigating influence of two seas surrounding the re-gion. Precipitation is quite scarce and mainly concentrated between October and February; nevertheless, several heavy rain events affected the region in the last few years (Horvath et al., 2006; Moscatello et al., 2008).
The event described in the present paper affected a small area in the central part of Apulia during the evening of 22 Oc-tober 2005 (Regano, 2007). About 160 mm were recorded at the station of Cassano Murge (location in Fig. 1) in just 6 h: this amount represents more than a quarter of the average an-nual precipitation registered at that station (600 mm) and his-torical datasets shows that the last event with a similar inten-sity in the area dates back to 1926 (Baldassare and Frances-cangeli, 1987). The effects of the flooding were dramatic: many roads, houses and farms in the area were flooded; some roads were damaged, some bridges collapsed, several cars were swept away, causing six deaths. Six carriages of a train went off the rails near Bari due to a landslide sweeping away the ground beneath the rail tracks, leaving a carriage over-hanging a chasm.
The present paper is organised mainly in two parts, the first one focuses on the observational analysis and the sec-ond one on numerical simulations. In Sect. 2, synoptic maps show the large-scale atmospheric conditions occurring dur-ing the episode; in Sect. 3, the observations from surface stations and remote sensing allow the analysis of the evolu-tion of the event and suggest some hypotheses on the mech-anisms responsible for the heavy rainfall. In Sect. 4, the vertical soundings in Brindisi are analysed, showing some features common to other heavy-rain events. In Sect. 5 nu-merical simulations are performed to better understand the mechanisms responsible for the generation and maintenance of convection. Discussion and conclusions are presented in Sect. 6.
2 Synoptic analysis
Figure 2 shows the reanalysis of the NCEP – NCAR (Na-tional Centre for Atmospheric Research – Na(Na-tional Cen-tre for Environmental Prediction) 40-year Reanalysis Project (NNRP; Kalnay et al., 1996) of the 500 hPa geopotential height, the mean sea level pressure (left) and the 850 hPa geopotential height and temperature (right) at 00:00 UTC, 22 October (top), before the event, and 00:00 UTC, 23 Oc-tober (bottom), during its occurrence. The horizontal reso-lution of the reanalysis data is about 2.5◦, and thus is
600
588
576
564
552
540
528
m/10
26
20
14
8
2
-4
°C
1015
990 L
a)
995b)
L L
H H
H H
H H
1015 1010
1000
1000
1005 1010
1015
1015
1020 1025
1030
c)
L
L L
H
H
H
H
1020
1020
1015
1020 1030
1025 1035
1010
1015 1015
1005 1000
552 1010
1015 1000 995
10 15
10 5
5 0
-5
152 144
136
10
15 10
10
20
5 0 -5
0
152 136
144
152 144
128
5
L L
H
H
d)
b)
Fig. 2. NCEP reanalysis (source: http://www.wetterzentrale.de): mean sea level pressure (in hPa, white lines) and 500 hPa geopotential height (in m/10, colours)(a), 850 hPa temperature (in◦C, colours) and geopotential height (in m/10) at 00:00 UTC, 22 October 2005(b);
mean sea level pressure (in hPa, white lines) and 500 hPa geopotential height (in m/10, colours)(c), 850 hPa temperature (in◦C, colours)
and geopotential height (in m/10) at 00:00 UTC, 23 October 2005(d). “H” stands for high pressure, “L” for low pressure. The position of the Apulia region is indicated with the black box in(a).
high-pressure centre is positioned over the Atlantic ocean (not shown) at the latitude of southern Europe, while a wide ridge, extending from Libya to Russia, affects the eastern Mediterranean Sea. In between the two high-pressure ar-eas, a deep trough approaches the western Mediterranean coast from the Atlantic ocean and a weaker wave affects the central Mediterranean sea, with its axis extending from Sar-dinia to Tunisia. The 850 hPa temperature shows a tongue of warm air extending from Libya to the Balcanic Peninsula and a cold short-wave disturbance, associated with the fast-moving, weak geopotential trough, present also at 850 hPa, affecting the western Mediterranean Sea (Fig. 2b).
After 24 h, both the high-pressure centres shift eastward (Fig. 2c) so that the pressure gradient weakens over ern Italy and only the Otranto channel (that is the south-easternmost part of Mediterranean sea surrounding Apulia, separating the region from Albania; Fig. 1) remains affected by the moist and warm airflow associated with the anti-cyclonic circulation centred over eastern Europe. A weak gradient of mean sea level pressure is present over most of the Italian peninsula, while a weak pressure minimum is pre-sented on the map over southern Italy. The Bracknell ana-lysis chart (that is a surface pressure anaana-lysis map issued by
the UK Met Office including frontal systems and instabil-ity lines; not shown) shows an instabilinstabil-ity line moving across Apulia during the night. Similar to the pressure field, the tongue of warm air at 850 hPa (Fig. 2d) moves eastward, with its axis extended from Libya to Greece.
It is relevant to note that at upper levels (Fig. 2c) the deep trough, associated with a cold frontal system, reaches Spain, while the weak shortwave trough, in phase with the mslp minimum, approaches the southern Italian regions, contribut-ing to the destabilization of the environment. As a conse-quence, the value of CAPE (Convective Available Potential Energy) in Pratica di Mare sounding, about 20 km south of Rome, increases from 70 J kg−1 at 00:00 UTC, 22 October
to 866 J kg−1 at 12:00 UTC, 22 October and is still about
700 J kg−1at 00:00 UTC, 23 October.
3 Surface and remote sensing data
B
D E
C B
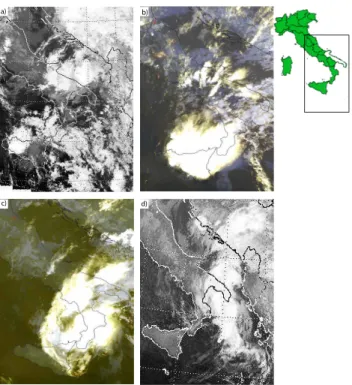
Fig. 3.NOAA-15 (channel 4) at 05:25 UTC, 22 October 2005(a), at 15:39 UTC, 22 October 2005(b), at 20:25 UTC, 22 October 2005
(c), NOAA-12 (channel 3) at 03:53 UTC, 23 October 2005(d). The images are enlarged over southern Italy (source: www.dlr.de). The part of Italy represented in the figure is approximately delimited by the box in the upper right corner.
Aerotech S.r.l. (S.r.l. stands for limited liability company), and located a few km north of Bari, at Bari Palese airport (lo-cation in Fig. 1). Due to its geographic lo(lo-cation, the radar is able to properly cover the area affected by the most intense precipitation in the case study. Reflectivity maps are shown in Fig. 4. Thirty-three meteorological stations in Apulia re-gion, belonging to SMA S.p.A. (System for the Meteorology and the Environment, a joint stock company supporting the Italian national system of civil defence), provide the values of several surface meteorological fields every 15 min. The location of the stations over the region is shown in Fig. 1.
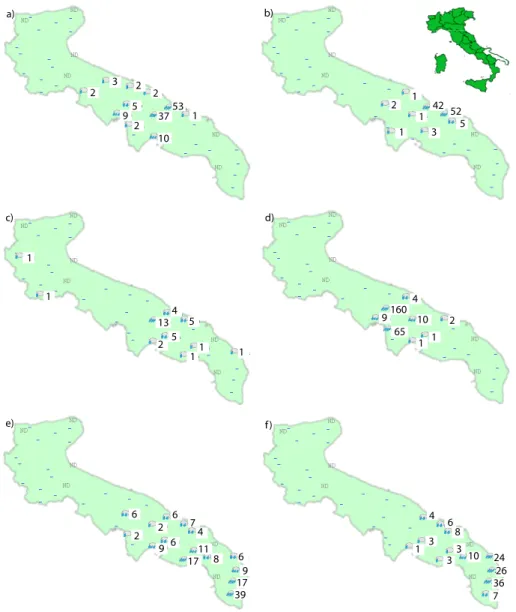
From 22 October, 00:00 UTC to 23 October, 12:00 UTC, the 6-h accumulated rainfall is shown in Fig. 5. The rain-fall affected the region for approximately 36 h, starting early in the morning of 22 October 2005. Hereafter, we discuss the evolution of the large scale cloud system over south-ern Italy (shown in Fig. 3) in relation with the precipi-tation over Apulia, as emerging from Figs. 4 and 5. In the first phase, precipitation was observed only at a few stations in central Apulia, concentrated mainly along the Adriatic coast (Fig. 5a and b). During this phase, the satel-lite image (Fig. 3a) and the radar reflectivity maps (Fig. 4a) detect some convective clusters responsible for the precipita-tion, extending from the Adriatic Sea to the Gulf of Taranto.
dbZ
80 65 60 57 54 51 48 45 42 39 35 30 25 20 15 10 5 -5 BARI PALESE
°
a)
c)
b)
d)
Fig. 4.Reflectivity maps (radar elevation 2.75◦) in dbZ, generated
by the radar in Bari Palese (Aerotech S.r.l.) at(a)04:05 UTC,(b)
15:11 UTC,(c)19:03 UTC, 22 October 2005 and(d)03:15 UTC, 23 October 2005. The part of the Apulia region represented in the figure is delimited by the box in the upper right corner.
The sequence of reflectivity maps during this phase (not shown) shows a rapid movement of the cellular clusters east-north-eastward across Apulia.
In the afternoon, the clouds over southern Italy, associ-ated with a synoptic-scale minimum (Fig. 2a and c), are mainly localised between Sicily and Calabria; an intense south-westerly flow over the Ionian Sea is responsible for the orographic clouds positioned north-east of Calabria (Fig. 3b). A few convective cells start to form above the Apulia region: as apparent in the reflectivity maps (Fig. 4b), they are gen-erated north of Taranto, at the foothills of the Murge hills. No relevant rainfall amount is recorded during this phase (Fig. 5c).
F G E D
C B
Fig. 5. 6-h accumulated rainfall recorded in the stations of SMA S.p.A. in the following time interval: (a)00:00–06:00 UTC,(b)06:00– 12:00 UTC,(c)12:00–18:00 UTC, 22 October 2005,(d)18:00 UTC, 22 October–00:00 UTC, 23 October,(e)00:00–06:00 UTC,(f)06:00– 12:00 UTC, 23 October. “ND” stands for “Not Available”. The upper right side of the figure shows the location of the Apulia region (in white) with respect to the Italian peninsula.
cells are advected toward the Adriatic Sea by the upper-level south-westerly flow. In this period, the band remains quasi-stationary for several hours producing a maximum rainfall amount of 160 mm recorded in 6 h in a small area confined inland, north-west of the Gulf of Taranto and south-west of Bari (Fig. 5d).
After midnight, the central and southern part of Apulia are covered with clouds and the synoptic-scale cloud sys-tem, that moves east-north-eastward, get closer to the iso-lated cells over central Apulia, which progressively weaken and move south-eastward (Figs. 3d and 4d). In the follow-ing hours, the rainfall moves progressively farther south-eastward, following the transit of the synoptic system (Fig. 5e and f).
Figure 6 shows the 1-h accumulated precipitation vs. time in the station of Cassano Murge, where the maximum 6 h rainfall, equal to 160 mm, was recorded. It is apparent that the precipitation occurred in a 6-h interval, namely from 19:00 UTC, 22 October to 01:00 UTC, 23 October, but that most of the rainfall has been recorded in just 4 h, with a rain-rate peak of about 60 mm h−1at 21:00 UTC, consistent with
60 55 50 45 40 35 30 25 20 15 10 5 0
00 03 06 09 12 15 18 21 00 03 UTC 22/10/2005 23/10/2005
Fig. 6. 1-hour accumulated rainfall recorded in Cassano Murge from 00:00 UTC, 22 October 2005 to 06:00 UTC, 23 October 2005.
Figure 7 shows that southerly low-level winds are prevail-ing in the central and in the southern part of the region. It is also apparent that northerly winds are present immediately to the north of the hills, showing that an area of wind conflu-ence is localised mainly between Cassano Murge, Altamura and Santeramo surface stations (Fig. 1), that is the area af-fected by the largest rainfall. The topography superimposed on the v-component suggests that the confluence occurs as a consequence of the presence of the Murge hills which deflect the synoptic southerly wind coming from the Ionian Sea. As well recognised since the 40’s (Byers and Braham, 1949), the low-level convergence can be relevant for the generation of the ascending motion and, thus, for the development of convective cells; its importance in the present case will be discussed in Sect. 4.
4 Sounding
The vertical profiles of temperature, dew point and wind in Brindisi airport (lat=40.65◦N, lon=17.95◦E) at 12:00 UTC,
22 October 2005 and 12 h later, respectively before and dur-ing the heavy-rain event, are shown in Fig. 8. The sounddur-ing station is located in the southern part of the Apulia region, more than 50 km south-east of Cassano Murge. Although quite far from the location of the largest rainfall, the vertical profiles can at least provide a rough description of the tem-poral evolution of the atmosphere over the southern part of the region, upstream of the Murge hills.
It emerges from comparing the two soundings that in 12 h the wind from the low levels up to 400 hPa backs from south-west to south, due to the approach of the weak synoptic trough shown in Fig. 2a, and the wind speed increases at levels below 700 hPa (however, the wind speed weakens very close to the ground). As a consequence, the flow brings a larger amount of humidity inland, blowing from the Gulf of
Fig. 7. V-wind component (colours) and observed wind vector (white barb; the flag is draw at the end of the barb for 10 knots, and is offset from the end for 5 knots) at 18:00 UTC, 22 October 2005. Wind analyses are generated using the Cressman interpolation tech-nique (Daley, 1993) implemented in the GrADS graphical package (Grid Analysis and Display System; http://www.iges.org), from the measurements of thirty-three surface stations distributed along the south-eastern part of Italy. Isotachs over the sea and surrounding regions are masked since they cannot represent realistically the me-teorological fields in areas of missing data. The isohypses, relative to the height with respect to the mean sea level as represented in the WRF model, are in black contours (c.i.=100 m).
Taranto instead from the Apennines, almost saturating the at-mosphere at Brindisi and also close to the Murge hills (for example, in the station of Santeramo, the humidity grows suddenly from 40% to 100% during the afternoon; Fig. 12c shows the simulated of humidity over the region). The temperature profile is slightly unstable in both soundings, since CAPE is approximately equal to 400 J kg−1 (respec-tively 435 J kg−1at 12:00 UTC, 22 October, and 388 J kg−1 at 00:00 UTC, 23 October). During the evening, the warming of the layers around 850 hPa produces a temperature inver-sion which inhibits the vertical motions from below. 4.1 Discussion
Many features of the 00:00 UTC, 23 October sounding are typical of heavy-rain orographic convective events (Pontrelli et al., 1999; Lin et al., 2001):
(note that the Murge hills have a maximum peak only 700 m high; however, the very low lifting condensation level – 965 hPa, about 500 m, in Brindisi sounding at 00:00 UTC, 23 October – allows for even a small as-cending motion to generate condensation and eventually convection);
- the light upper-level winds, which favour the persis-tence of convective systems over the same area for a long time (Chappell, 1986);
- the conditionally unstable environment;
- the nonzero CINH (26 J kg−1 at 12:00 UTC, 22 Octo-ber), which confines the initiation of convection only in areas where the uplift is sufficient, and thus prevents a widespread convection;
- the nearly saturated and warm airflow in the lowest few km, which supplies the atmosphere with large humidity content.
Also, the synoptic environment is favourable for heavy rain (Pontrelli et al., 1999), due to the location of the system be-tween a ridge and a weak shortwave trough approaching from the southwest and contributing to the destabilization of the environment (as discussed in Sect. 2).
Finally, the very low lifting condensation levels, together with the pronounced low-level wind, reduce the evaporation and prevent the associated production of cold pools (Chu and Lin, 2000). In fact, density currents can be generated as a consequence of the evaporative cooling due to rain and can propagate far from the mountain, preventing a large rainfall accumulation to occur. The intensity of the evaporative cool-ing is dependent on the degree of saturation of the surround-ing atmosphere: thus, in presence of low cloud bases, cold air outflows cannot spread out of the mountains to trigger new convective cells and no density currents can be gener-ated. As a consequence, the storms remain quasi-stationary upwind and over the mountain top, favouring a large rainfall accumulation in a confined area (Stein, 2004). The minimal evaporative losses may increase the precipitation efficiency, too.
Two mechanisms may be responsible for the upward mo-tion required to release convective instability: the low-level convergence and the direct orographic uplift. The first forc-ing affects the nearly stagnatforc-ing air close to the ground, whose depth can be estimated as about 100 m (in the Brin-disi sounding, the wind speed is equal to 5 knots at 10 m, but increases to 15 knots at 160 m), while the second one affects a layer roughly estimated as 1–1.5 km deep. The unsaturated moist Froude number H (H=hmN/U – with N moist unsaturated Brunt-V¨ais¨al¨a frequency,hmthe max-imum mountain height, U the average wind speed in the layer −) is the parameter relevant for the classification of
a)
b)
Fig. 8. Thermodynamic soundings observed in Brindisi sta-tion (17.95◦E, 40.65◦N) at 12:00 UTC, 22 October (a), at
00:00 UTC, 23 October 2005(b)(source: University of Wyoming, http://weather.uwyo.edu/upperair/sounding.html). The wind barbs follow the same convention as Fig. 7.
A B
C
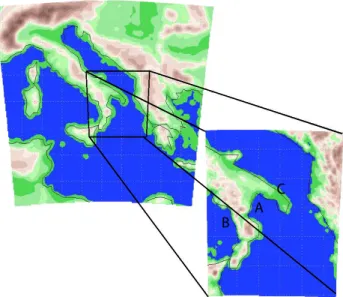
Fig. 9. WRF model integration domains: the external domain is shown on the left, the box on the right represents the nested domain, where A, B and C denote the positions of the simulated soundings shown in Fig. 11.
speed together with the small mountain height determines a value ofH <1 (H∼0.2), which corresponds to a “flow over”
regime. A similar evaluation has been performed in the lower 1.5 km and for the 00:00 UTC, 23 October sounding, show-ing a value of H corresponding to the same flow regime (H∼0.4–0.6).
In order to understand which of the two forcings is more important, one can roughly estimate the vertical velocity associated with each one (see Table 1). For direct oro-graphic uplift, wor=U hm/a (where: U∼10 m s−1 is
eval-uated in the lowest 1 km, hm∼500 m and a∼20 km are
re-spectively the maximum height and the characteristic length, perpendicular to the low-level flow, of the Murge hills), we estimate wor∼0.25 m s−1. The vertical velocity
asso-ciated with the low-level convergence is calculated apply-ing the continuity equation in the layer close to the ground (100 m deep) in the region comprising the stations of Cas-sano Murge, Santeramo and Altamura: from the observa-tions of the three staobserva-tions at 18:00 UTC, it emerges that: dw/dz=du/dx+dv/dy∼7 m s−1/20 km, corresponding to a
ver-tical velocity much smaller than 0.1 m s−1. In conclusion,
from the analysis of the Brindisi sounding, it seems reason-able to suppose that when the ribbon of moist and condition-ally unstable air approaches the mountains, the orographic uplift favours the release of instability and the initiation of convection. The low-level convergence can produce an ad-ditional contribution to the ascending motion, but represents only a secondary effect with respect to the direct orographic uplift. These rough calculations have been performed with
Table 1.Estimation of the vertical velocity associated with the di-rect orographic uplift and the low-level convergence.
Uplift Low-level convergence
w(m s−1) 0.25 0.04
the purpose of extracting some pieces of information from the observations alone and will be confirmed by the model re-sults, as discussed in Sect. 5.1 (comments related to Fig. 14).
5 Numerical simulations
The Weather Research and Forecasting (WRF) Model (Michalakes et al., 2005; Skamarock et al., 2005; www. wrf-model.org) is a numerical weather prediction system designed to serve both operational forecasting and atmo-spheric research needs. The equation set is fully compress-ible and nonhydrostatic, with a run-time hydrostatic option available. The prognostic equations are cast in conservative (flux-) form for conserved variables, while non-conserved variables like pressure and temperature are diagnosed from prognostic conserved variables. The model uses the terrain-following, hydrostatic-pressure vertical coordinate with ver-tical grid stretching (we chose 31 levels for the simulations shown in the present study); the top of the model is a con-stant pressure surface (=50 hPa). The horizontal grid is an Arakawa-C grid. A time-split integration method using a 3rd-order Runge-Kutta scheme is utilised (Wicker and Ska-marock, 2002), with smaller time steps for acoustic and gravity-waves modes. In the setup adopted here, the 5th-order advection is employed in the horizontal, the 3rd-5th-order in the vertical.
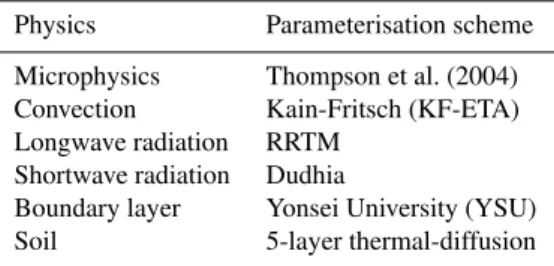
The model integration domains are shown in Fig. 9. The largest area, which covers approximately the central Mediter-ranean basin, represents the coarse-resolution domain, with a horizontal resolution of 16 km. The inner domain cov-ers southern Italy and adjacent seas with a resolution of 4 km. The simulations are employed with a two-way nesting technique. Different parameterization schemes are available in WRF for microphysics, convection, turbulence, soil pro-cesses, boundary layer, radiation. The adopted model pa-rameterisations are given in Table 2. No convective parame-terisation is active on the inner grid.
5.1 Comparison with observations
A numerical simulation with the WRF model was performed from 21 October 2005, 00:00 UTC, to 23 October 2005, 12:00 UTC. The 0.5◦×0.5◦ECMWF (European Centre for
Table 2. WRF model parameterisation schemes on the two grids. No convection parameterisation scheme is active on the inner grid.
Physics Parameterisation scheme Microphysics Thompson et al. (2004) Convection Kain-Fritsch (KF-ETA) Longwave radiation RRTM
Shortwave radiation Dudhia
Boundary layer Yonsei University (YSU)
Soil 5-layer thermal-diffusion
lateral boundary conditions on the large domain every 6 h. The initial and lateral boundary condition files are gener-ated using the WRF Standard Initialisation (http://wrfsi.noaa. gov/). Hereafter, the simulation will be referred to as “con-trol run”. The precipitation forecast for the night between 22 and 23 October on the inner grid is shown in Fig. 10, where the position of Cassano Murge station (lat=40.88◦N,
lon=16.77◦E) is represented with a “X”, and can be
com-pared with the observed rainfall showed in Fig. 5. It is ap-parent that the model precipitation forecast is quite good both considering the location of the maximum rainfall, that is shifted just a few tens of km to the east, its intensity (120 vs. 160 mm) and the distribution of precipitation. In the bottom panel of Fig. 10, the temporal evolution of the forecast pre-cipitation is shown in the point where the model reproduces the largest rainfall (lat=40.80◦N, lon=16.95◦E). Comparing
it with Fig. 6, the timing of the event is reproduced correctly as well as its temporal duration of about 6 h, although the occurrence of the peak is delayed a few hours.
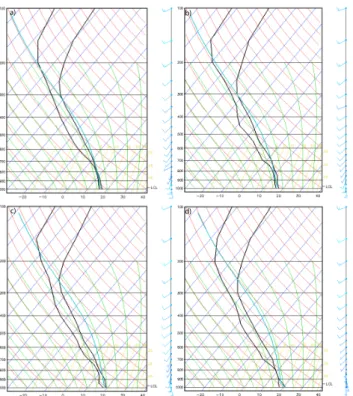
In order to define the characteristics of the air moving to-ward the hills, we first consider the simulated sounding at the Brindisi station (17.95◦E, 40.65◦N; the position is denoted
with C in Fig. 9b) at 00:00 UTC, 23 October (Fig. 11a), and compare it with the observed sounding at the same time. Al-though the simulated profile is smoother than the observed sounding, the model is able to reproduce correctly most of the features described in Sect. 4: the non-negligible CINH; the very low lifting condensation level (LCL in Fig. 11) – at about 975 hPa; the light upper-tropospheric winds; the weakly unstable environment (CAPE∼300–400 J kg−1); the
nearly saturated air in the low levels. Some small differences emerge in the wind profiles: in the simulation, the wind speed is slightly weaker and the low-level southerly flow is con-fined to a shallower layer; however, the main patterns are correctly reproduced.
After showing that the model is able to capture the basic features of the sounding at Brindisi and to reproduce the rain-fall correctly, one can be quite confident of the ability of the model to reproduce accurately the dynamical mechanisms in-volved during the event and so move on to analyse the sim-ulated soundings at other points. Thus, the differences with respect to the Brindisi soundings are representative of real
at-100
80 60 40 30
20 10 5 3 1
mm/h
17-1818-1919-2020-2121-2222-2323-0000-0101-0202-03 22October 23October
16°E17°E18°E 19°E 42°N
41°N
40°N X
a)
b)
100 100
200 200 300
400 300 400 400500
200
300
400 1100
Fig. 10. WRF model-inner grid output fields, shown over central and southern Apulia: (a)total rainfall predicted during the phase of heavy rain, from 17:00 UTC, 22 October to 03:00 UTC, 23 Oc-tober 2005 (mm);(b)1h-rainfall (mm h−1) at (40.8◦N, 16.95◦E),
the point with the largest simulated precipitation amount. The bold horizontal line at lat=40.8◦N in(a)denotes the location of the cross
sections represented in Fig. 13. The “X” in(a)denotes the location of Cassano Murge.
mospheric features and are not model artefacts. We analyse hereafter the simulated soundings at 18:00 UTC, 22 October, which is immediately before the heavy rain occurs, at Brin-disi (Fig. 11b) and at the two distinct points shown in Fig. 9, A(17.0◦E, 40.0◦N) and B(15.5◦E, 39.5◦N). The first point
is located to the south of the Murge hills over the Ionian Sea, upstream of Cassano Murge with respect to the low-level flow (Fig. 11c); the second is located over the Tyrrhe-nian Sea, representative of the upper-level air advected to-ward Apulia (Fig. 11d), although the characteristics of the air mass can be modified after its passage over the Apennines (Stein, 2004). The sounding in Brindisi remains very close to the profile simulated 6 h later, apart from the fast evolu-tion of the low-level wind field (compare Fig. 11a vs. b). The most relevant differences in A and B with respect to the Brin-disi sounding is the large value of CAPE (1100 J kg−1in A;
1560 J kg−1in B), mainly due to the warmer air present in the
a) b)
c) d)
Fig. 11. WRF-model inner-grid thermodynamic soundings simu-lated in C (17.95◦E, 40.65◦N) at 00:00 UTC, 23 October(a), at
18:00 UTC, 22 October 2005(b); in A (17.0◦E, 40.0◦N)(c)and B
(15.5◦E, 39.5◦N)(d)at 18:00 UTC, 22 October 2005. The three
points are represented in Fig. 9. The black lines represent the tem-perature (right curve) and the dew point (left curve) vertical profiles, the cyan lines the pseudo-adiabatic from the lifting condensation level (LCL); wind profiles are shown on the right (the flag is draw at the end of the barb for 10 m s−1, and is offset from the end for
5 m s−1).
5.2 Lower and upper level features
The atmospheric properties at 18:00 UTC, 22 October, are better described in Fig. 12, which combines meteorologi-cal fields at different pressure levels, representative, respec-tively, of the upper-, middle- and lower-tropospheric con-ditions on the external domain. In Fig. 12a, the 300 hPa geopotential height together with the Potential Vorticity (PV) anomaly on the 340 K isentropic surface are shown. It is apparent that there is an upper-level trough that affects the southern Tyrrhenian Sea and moves quickly to the east, so that it is positioned above the Ionian Italian regions during the night (not shown). The levels located immediately be-low (down to 500 hPa) show a similar phase of the geopo-tential field. Incidentally, heavy-rain events in the Mediter-ranean basin are often associated with an upper-level trough, generally propagating eastward (Tripoli et al., 2005), and with the intrusion of stratospheric air into the upper tropo-sphere (Federico et al., 2008). This feature is documented
PVunits
trough
Oe(K)
324 323 322 321 320 319 318 317 316 315 314 313
r.h.
90 70 50 30
10m/s
L L
10 9 8 7 6 5
-a)
b)
c)
9480 9440
9400 9360
3180 3140 3100
3120
3160 3080
1015 1017
1017 1019
1021
Fig. 12. WRF model-external grid outputs at 18:00 UTC, 22 Oc-tober 2005: 300 hPa geopotential height (lines, c.i.=20 m) and PV anomaly (PVU, colours) on the 340 K isentropic surface(a); 700 hPa geopotential height (lines, c.i.=10 m) and equivalent poten-tial temperature (K, colours)(b); mean sea level pressure (lines, c.i.=1 hPa), 10 m wind vectors (white arrows; unit length in the right bottom side of the panel) and 850 hPa relative humidity (%, colours)
(c).
by the presence of a PV anomaly, that in the present case shows a maximum larger than 6 PVU on the 340 K surface (1 PVU=10−6m2s−1K kg−1), elongated from central Eu-rope into the middle of the Mediterranean Sea. A positive PV anomaly results in a weaker atmospheric stability and stronger ascending motion which have an important impact on the cyclone evolution. No significant upper-level jet is present in the Mediterranean area at this time (not shown).
ofθe, produces a further destabilisation of the environment over the central part of the region (CAPE∼1300 J kg−1).
Compared to that of the upper level, the 700 hPa geopotential presents a trough that is shifted more to the west, since the main axis is elongated from Sardinia to Tunisia.
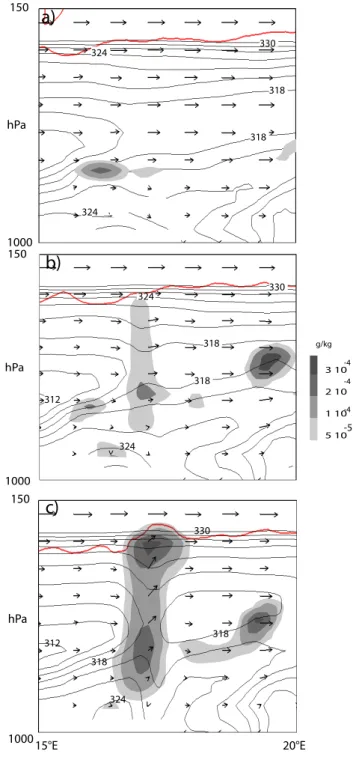
In general, the tropopause undulations, associated with the intrusion of an upper-level PV anomaly, produce a deforma-tion of the isentropes imposing ascending modeforma-tion of lower-level air ahead of the anomaly, that can act synergistically with the processes acting in a low-level baroclinic region (Hoskins et al., 1985; Thorpe et al., 1985). In order to show that the intense rainfall observed during the night can be in-terpreted as a consequence of the interaction of the upper with lower levels, Fig. 13 shows the evolution of the equiva-lent potential temperature, the dynamic tropopause (defined as equal to 1.5 PVU), the cloud water and ice content along a cross section W-E through the latitude of the maximum simulated rainfall (lat=40.8◦N) at 18:00 UTC (Fig. 13a),
21:00 UTC (Fig. 13b), 22 October and 00:00 UTC, 23 Octo-ber (Fig. 13c). The upper-level positive PV anomaly moves closer to the region with maximum baroclinicity, favouring ascending motion in the mid-troposphere close to the Murge hills. There, the level of free convection (LFC) is very low due to the moistening of the surface air by wind induced sur-face fluxes (WISHE mechanism; Emanuel, 1987) over the Ionian Sea, a large humidity content is present in the low tro-posphere (Fig. 12c), the instability is large and an orographic uplift occurs in the very low levels (Fig. 14). As a conse-quence, deep moist convection is triggered, coupling the low levels with the upper-level PV anomaly (Tripoli et al., 2005). Figure 12c shows that a pressure minimum is positioned over Sicily, associated with the diffuse cloud coverage over southern Italy shown in Fig. 3. The low is not very deep, but the presence of an area of high pressure over Greece pro-duces a strong pressure gradient on the eastern side of the low, over the Ionian Sea. Thus, the mean sea level pres-sure pattern generates an intense south-easterly low level jet which ensures that air masses impinge over the Murge hills only after a long fetch over the Ionian Sea, driving intense surface fluxes from the sea (Fig. 12c) which provide an in-tense moisture supply to the air moving inland. In the fol-lowing few hours, the pressure gradient moves to the east, so that the southerly flow remains intense only over the extreme southern tip of the region (not shown).
The presence of a pronounced low-level flow upstream the Murge hills at 18:00 UTC, 22 October, is more apparent in Fig. 14a, where the 950 hPa vertical velocitywand the hori-zontal wind vectors simulated over the inner grid are shown, superimposed on the topography of the region. Ascend-ing motion is present upslope, with the maximum simulated vertical velocity located in the concavity of the topography, where the slope is larger. The maximum value of 950 hPa vertical velocity, equal to 0.3 m s−1, is consistent with the
rough evaluation given in Sect. 4. The low-level conver-gence, shown in Fig. 7, is not reproduced in the simulation.
c)
330
318
324 312
318 150
hPa
1000
150
hPa
1000
150
hPa
1000 15°E 20°E
a)
b)
3 10
2 10
1 10
5 10
-4
-4
-4
-5 g/kg 330
324
318
318
324
330
318
318
324 312
324
Fig. 13. WRF model-external grid outputs: equivalent potential temperature (dark lines, c.i.=2 K, only values smaller than 330 K are shown), dynamic tropopause (defined as equal to 1.5 PVU; bold red line), cloud water plus ice content (shaded areas) along a cross section W-E (longitude from 15◦E to 20◦E; vertical extension from
1000 to 150 hPa) through the latitude of the maximum simulated rainfall (lat=40.8◦N) at 18:00 UTC(a), 21:00 UTC(b), 22 October
0.10.20.3
16°E17°E18°E19°E
40.8°N
39.5°N a)
b) 700
1000 hPa
40°N40.5°N41°N41.5°N -0.30-0.20-0.100.100.200.30 m/s 304
300
296 4
6
8 10
12 14
10
298 302
294
Fig. 14. WRF model-inner grid outputs at 18:00 UTC, 22 Octo-ber 2005, zoomed upstream the area of the largest recorded rainfall: 950 hPa vertical velocity (m s−1, colors) and wind vectors (arrows, unit length in the right bottom side of the panel)(a); vertical veloc-ity (colours), potential temperature (green lines, c.i.=2 K), v-wind component (black contours, c.i.=2 m s−1) and cloud water plus ice
content (red lines, c.i.=2×10⁻⁴g kg−1) along a N-S cross section
(b), whose position is shown in panel a. The cross section is lo-cated at the longitude (16.95◦E) of the place affected by the largest
simulated rainfall and extends vertically from 1000 to 700 hPa and horizontally from the Ionian to the Adriatic Sea. The orography is represented with black contours in panel(a)(c.i.=200 m) and is located approximately in correspondence with the white box in the lower part of panel(b).
The fact that the model is able to correctly simulate the rain-fall distribution and amount, although it does not reproduce the low-level convergence, confirms that the direct uplift due to an orographic “flow over” is the main mechanism for the generation of ascending motion.
The vertical velocity, the potential temperature, the v-wind component and the cloud water plus ice content at 18:00 UTC, 22 October are plotted in Fig. 14b along a N-S cross section (thus along the wind direction in the low-est levels), whose position is shown in Fig. 14a. The cross section is located at the longitude (16.95◦E) of the place
af-fected by the largest simulated rainfall and extends vertically from 1000 to 700 hPa and horizontally from the Ionian to the Adriatic Sea. The presence of a low-level jet is apparent
100
80
60
40
30
20
10
5
3
1
200 300
300 400 500
1100
200
Fig. 15. WRF model-inner grid rainfall amount predicted during the phase of heavy rain, that is from 17:00 UTC, 22 October to 03:00 UTC, 23 October 2005 (mm) in a sensitivity experiment per-formed by eliminating the Murge hills orography from 12:00 UTC, 22 October onward.
both upstream, above and also immediately downstream of the hills. In agreement with our previous considerations, the upstream ascending motion produces condensation and in-duces the generation of some cells over the upslope; in a few hours, the cells further grow and move slightly downstream (not shown). The upward displacement of the isentropes on the upstream side and the presence of closer descending isen-tropes on the downstream side, responsible for the stronger wind speed, is typical of “flow over” regimes in weakly non-linear flows over a “wide” mountain (H∼0.5; Bauer et al.,
2000).
of the incoming low-level flow is allowed. The smaller rain-fall is a consequence of the suppression of the Murge hills which significantly reduces the orographic ascent compared to the control run.
6 Discussion and conclusions
A heavy-rain event took place in a small area in Apulia re-gion on 22–23 October 2005, producing several casualties and unprecedented damages. The intensity of this event (see Figs. 5 and 6) prompts questions related to its origin and na-ture. In the present paper, a combination of observations, synoptic analysis, and numerical modelling has been used to understand the mechanisms responsible for the heavy rain-fall.
The observed atmospheric conditions bear a striking re-semblance to some features reported in other devastating heavy rainfall episodes caused by convective systems re-maining quasi-stationary in the neighbourhood of an oro-graphic obstacle for several hours (Pontrelli et al., 1999). The distribution of radar reflectivity along the band just down-stream of the Murge hills suggests an orographic origin of the cells (Fig. 4b). The intense moisture-laden, low-level, southerly airflow, impinging on the mountain chain (Figs. 8b and 12c), provides an adequate supply of moisture in the lower troposphere and a mechanism for initiating and main-taining convection. In fact, although the mountain ridge is low (the peak is about 700 m), the large low-level humidity content is responsible for a low LFC, thus the air parcels near the ground receive an uplift sufficient to remove the even-tual convective inhibition and initiate convection. Moreover, the weak middle- and upper-tropospheric currents (Figs. 8 and 11) cooperate with the absence of evaporation-induced density currents to generate slow-moving storms which fo-cus excessive rainfall on a confined area. The relevance of the local orography for the location and the intensity of the rainfall has also been evidenced in a sensitivity experiment performed without the Murge hills (Fig. 15).
The importance of low-level features has been analysed also in two additional sensitivity experiments, not discussed in the present paper, performed as the control run apart from switching off the latent heat due to condensation and the sur-face fluxes after 36 h of simulation. Relevant differences with respect to the control run in the intensity and the location of the peak show that both these factors are important for the development of convection.
The role of upper level features for the intense rainfall emerges from the synoptic analysis and the control simu-lation. The upper level synoptic maps show the approach-ing of a cold shortwave disturbance, associated with a fast-moving weak geopotential trough, and signal the destabi-lization of the environment (Figs. 2 and 11). The analysis of the model simulation confirms this point and emphasises the importance of the interaction of upper and lower level
processes. From a theoretical standpoint, the lateral trans-lation of a strong upper-level positive PV anomaly connotes specific features favourable for inducing heavy precipitation, that is reduction of the static stability beneath the anomaly and ascent on the anomaly forward flank to enhance and sus-tain convection (Massacand at al., 1998). A powerful PV anomaly has been found to play a major role during intense rainfall events in several Mediterranean areas (Fehlmann et al., 2000; Krichak et al., 2007; Federico et al., 2008). In the present case, destabilization and ascending motion are in-duced by the transit of a PV anomaly in the mid-troposphere close to the Murge hills, where they act synergistically with the processes working in the low levels (Figs. 12 and 13).
Finally, other numerical simulations, that start from dif-ferent initial and boundary conditions, have been performed to analyse the predictability of the event. The results are not discussed in the present paper but it is worth mention-ing here that a strong sensitivity comes out. This is a con-sequence of the large uncertainties inherent in the current deterministic quantitative precipitation forecasts, that affect more adversely the smaller scales. Therefore, the numeri-cal prediction of orographic convective system conducive to heavy precipitation can be misleading. It is thus important that forecasters of any region with significant orographic re-lief identify the presence of the factors responsible for these kinds of events, and in particular be vigilant when a moist, conditionally unstable low-level jet is forced to rise over an orographic feature for an extended period of time, in corre-spondence with a positive potential vorticity anomaly in the upper levels.
Acknowledgements. The author would like to thank Andrea Buzzi, Silvio Davolio, Paolo Martano (ISAC-CNR) and Richard Rotunno (NCAR) for proof-reading the manuscript, Agata Moscatello for Fig. 7, two anonymous referees for their comments.
Edited by: A. Mugnai and V. Kotroni Reviewed by: two anonymous referees
References
Anquetin, S., Creutin, J. D., Delrieu, G., Ducrocq, V., Gaume, E., and Ruin, I.: Increasing the forecasting lead-time of Weather driven Flash-floods, Joint Research Center, Institute for Envi-ronment and Sustainability, H01/812/02/D9056/AG/ct, 33 pp., 2004.
Baldassare, G. and Francescangeli, R.: Osservazioni e consider-azioni sulla inondazione del 6 novembre 1926 in Bari e su un relativo deposito, Memorie Societ`a Geologica Italiana, 37, 7–16, 1987.
Bellecci, C., Colacino, M., and Federico, S.: Quantitative precip-itation of the Soverato flood: the role of orography and surface fluxes, Il Nuovo Cimento C, 26C, 7–22, 2003.
Buzzi, A., Richard, E., and Romero, R.: Summary report on MEDEX studies and scientific results on Mediterranean cy-clones causing high impact weather, Report on scientific results, available at: http://medex.aemet.uib.es/documents/Summary on MEDEX studies Nov05.pdf, 2005.
Byers, H. R. and Braham, R. R.: The thunderstorm, US Government Printing Office, Washington, DC, 287 pp., 1949.
Chappell, C. F.: Quasi-stationary convective events, in: Mesoscale Meteorology and Forecasting, edited by: Ray, P. S., The Ameri-can Meteorological Society Ltd., 289–310, 1986.
Chu, C.-M. and Lin, Y.-L.: Effects of orography on the gen-eration and propagation of mesoscale convective systems in a two-dimensional conditionally unstable flow, J. Atmos. Sci., 57, 3817–3837, 2000.
Daley, R.: Atmospheric Data Analysis, Cambridge University Press, Cambridge, 480 pp., 1991.
Doswell III, C. A.: The distinction between large-scale and mesoscale contribution to severe convection: A case study ex-ample, Weather Forecast., 2, 3–16, 1987.
Emanuel, K. A.: An air-sea interaction model of intraseasonal os-cillations in the tropics, J. Atmos. Sci., 44, 2324–2340, 1987. Federico, S., Avolio, E., Bellecci, C., Lavagnini, A., Colacino, M.,
and Walko, R. L.: Numerical analysis of an intense rainstorm occurred in southern Italy, Nat. Hazards Earth Syst. Sci., 8, 19– 35, 2008
http://www.nat-hazards-earth-syst-sci.net/8/19/2008/.
Fehlmann, R., Quadri, C., and Davies, H. C.: An Alpine rainstorm: Sensitivity to themesoscale upper-level structure, Weather Fore-cast., 15, 4–28, 2000.
Gozzini, B., Maracchi, G., Meneguzzo, F., and Niccolai, M.: The catastrofic flood occurred in Versilia basin, Tuscany, on 19th June 1996: a way to predictability, in: RIBAMOD (river basin mod-elling, management and flood mitigation, Concerted Action) Pro-ceedings of the first workshop, edited by: Casale, R., Pedroli, G. B., and Samuels, P., Delft (Netherlands), 13–15 February 1997, 211–228, 1998.
Guzzetti, F., Cardinali, M., and Reichenbach, P.: The AVI project: A bibliographical and archive inventory of landslides and floods in Italy, Environ. Manage., 18, 623–633, 1994.
Horvath, K., Fita, L., Romero, R., Ivan`ean-Picek, B., and Stiperski, I.: Cyclogenesis in the lee of the Atlas Mountains: a factor sepa-ration numerical study, Adv. Geosci., 7, 327–331, 2006 http://www.adv-geosci.net/7/327/2006/.
Hoskins, B. J., McIntyre, M. E., and Robertson, A. W.: On the use and significance of isentropic potential vorticity maps, Q. J. Roy. Meteor. Soc., 111, 877–946, 1985.
Intergovernmental Panel on Climate Change (IPCC): Climate Change 2007: The Physical Science Basis, edited by: Solomon, S., Qin, D., Manning, M., Chen, Z., Marquis, M., Averyt, K. B., Tignor, M., and Miller, H. L., Cambridge University Press, Cam-bridge, UK and New York, NY, USA, 996 pp., 2007.
Kalnay, E. and Coauthors: The NCEP/NCAR 40-Year Reanalysis Project, B. Am. Meteorol. Soc, 77, 437–471, 1996.
Krichak, S. O., Alpert, P., and Dayan, M.: A southeastern Mediter-ranean PV streamer and its role in December 2001 case with tor-rential rains in Israel, Nat. Hazards Earth Syst. Sci., 7, 21–32, 2007
http://www.nat-hazards-earth-syst-sci.net/7/21/2007/.
Lin, Y.-L., Chao, S., Wang, T. A., Kaplan, M. L., and Weglarz, R. P.: Some common ingredients for heavy orographic rainfall, Weather Forecast., 16, 633–660, 2001.
Marshall, J. S. and Palmer, W. M.: The distribution of raindrops with size, J. Meteorol., 5, 165–166, 1948.
Massacand, A. C., Wernly, H., and Davies, H. C.: Heavy precipi-tation on the Alpine south-side: An upper-level precursor, Geo-phys. Res. Lett., 25, 1435–1438, 1998.
Michalakes, J., Dudhia, J., Gill, D., Henderson, T., Klemp, J., Ska-marock, W., and Wang, W.: The Weather Research and Fore-cast Model: Software Architecture and Performance, in: 11th ECMWF Workshop on the Use of High Performance Comput-ing, in: Meteorology, Reading UK, edited by: Zwieflhofer, W. and Mozdzynski, G., World Scientific, 156–168, 2005.
Miglietta, M. M. and Buzzi, A.: A numerical study of moist strati-fied flows over isolated topography, Tellus A, 53, 481–499, 2001. Miglietta, M. M. and Rotunno, R.: Numerical simulations of condi-tionally unstable flows over a ridge, in: International Conference on Alpine Meteorology, Chamb´ery, France, 4–8 June 2007, 1, 87–90, 2007.
Moscatello, A., Miglietta, M. M., and Rotunno, R.: Observational analysis of a Mediterranean “hurricane” over south-eastern Italy, Weather, 63, 306–311, 2008.
Pontrelli, M. D., Bryan, G., and Fritsch, J. M.: The Madison County, Virginia, Flash Flood of 27 June 1995, Weather Fore-cast., 14, 384 404, 1999.
Regano, A.: Dall’assimilazione dei dati all’analisi meteorologica, Ph.D. thesis, University of Bari, 2007.
Simmons, A. J.: Development of a high-resolution, sami-Lagrangian version of the ECMWF forecast model, Numerical Methods in Atmospheric Models, European Centre for Medium Range Forecasts, 2, 281–324.
Skamarock, W. C., Klemp, J. B., Dudhia, J., Gill, D. O., Barker, D. M., Wang, W., and Powers, J. G.: A description of the Ad-vanced Research WRF Version 2, NCAR Tech. Note 468STR, 88 pp., 2005.
Stein, J.: Exploration of some convective regimes over the Alpine orography, Q. J. Roy. Meteor. Soc., 130, 481–502, 2004. Stein, U. and Alpert, P.: Factor separation in numerical simulations,
J. Atmos. Sci., 50, 2107–2115, 1993.
Smith, R. B.: The influence of mountains on the atmosphere, Adv. Geophys., Academic Press, 21, 87–230, 1979.
Thorpe, A. J.: Diagnosis of balanced vortex structure using poten-tial vorticity, J. Atmos. Sci., 42, 397–406, 1985.
Tripoli, G. J., Medaglia, C. M., Dietrich, S., Mugnai, A., Pane-grossi, G., Pinori, S., and Smith, E. A.: The 9–10 November 2001 Algerian flood: a numerical study, B. Am. Meteorol. Soc., 1229–1235, 2005.