www.nat-hazards-earth-syst-sci.net/14/459/2014/ doi:10.5194/nhess-14-459-2014
© Author(s) 2014. CC Attribution 3.0 License.
Natural Hazards
and Earth System
Sciences
A model-based study of the wind regime over the Corinthian Gulf
I. Koletsis, V. Kotroni, and K. Lagouvardos
National Observatory of Athens, Institute of Environmental Research and Sustainable Development, Athens, Greece
Correspondence to:I. Koletsis ([email protected])
Received: 19 April 2013 – Published in Nat. Hazards Earth Syst. Sci. Discuss.: 17 May 2013 Revised: 5 January 2014 – Accepted: 20 January 2014 – Published: 28 February 2014
Abstract.The Corinthian Gulf is a narrow sea-level passage surrounded by a steep complex topography that consists of high mountains as well as elevated and sea-level gaps and straits. The complex terrain is expected to affect the wind flow in the area that often experiences high winds, with im-portant consequences on the commercial and recreational activities over the gulf’s maritime area. For that reason, a model-based study of the wind regime over the Corinthian Gulf has been created, as observational data over the area are recent and spatially sparse. Analysis of 5 yr of data from the fifth-generation Penn State/NCAR mesoscale model (MM5) model reveals that the wind regime of the gulf is greatly in-fluenced by the topography. Easterly winds occur more fre-quently and are stronger in the maritime area in the western edge of the gulf, with a frequency of occurrence on the or-der of 70 %. Moreover, the most intense wind events at this area occur during the winter season (December, January, and February). Finally the paper also provides a discussion on the synoptic patterns, which lead to the strongest wind events in the studied area.
1 Introduction
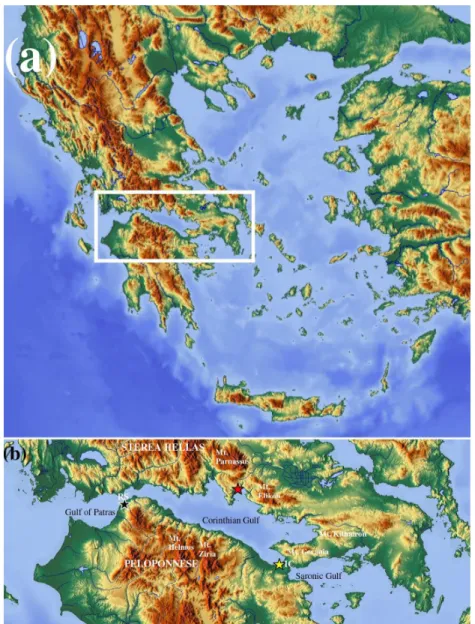
The Corinthian Gulf represents a narrow maritime strip sepa-rating Peloponnese from mainland Greece that is surrounded by steep topography (Fig. 1). The topography presents an inclined shape, rising abruptly from sea level to 200–400 m within a few kilometers from the coast on both sides, and to even higher elevation further south (Mt. Ziria and Mt. Chel-mos, 2340 and 2370 m high, respectively, 20 km south of the coastline), as well as further north (Mt. Parnassus, 2400 m high, 20 km north of the coastline, and Mt. Elikon, 1800 m high, just 8 km north of the coastline). The gulf axis has an east–west orientation about 120 km long and 20 km wide and
it is bounded at the east by the Isthmus of Corinthos, a strait that includes the shipping route between the Corinthian and the Saronic Gulf, and at the west by Rio Strait (2 km wide), which links the Corinthian Gulf to the Gulf of Patras and the Ionian Sea.
The narrow steep channels on both sides of the gulf fa-vor the establishment of strong winds under certain meteo-rological conditions. During the summer months, the strong northwest surface winds in the western part of Saronic Gulf, which are related to the gap outflow of Isthmus of Corinthos Strait, create problems for recreational activities (sailing, sea sports, and fishing) during the high touristic season. In the area of Rio Strait, which is a major waterway for commer-cial and recreational use, surface winds over 15 m s−1are
fre-quently observed. These strong winds often disrupt the mar-itime routes over the strait and may cause traffic restrictions over the Rio Strait bridge. Moreover, the strong winds in the Corinthian Gulf play an important role in the expansion of forest fires in the surrounding coastal areas.
Despite the fact that the strong wind events have important societal impacts, the wind climatology of the Corinthian Gulf has not been investigated in detail. A major reason for this is the absence of long-term, in situ measurements of meteoro-logical variables in the area. Therefore, model-based clima-tologies are imperative in areas where observations are sparse or absent. The primary aim of this study is to examine the wind field within the Corinthian Gulf, using 5 yr data pro-vided from model simulations. From these model results, de-tailed study of the wind regime across the gulf as well as an attribution of synoptic pattern leading to strong wind events is obtained.
Fig. 1.(a) Map of Greece: the white box indicates the location of the Corinthian Gulf. (b) Topographical details of the white box area of (a), in which the major topographical elements as well as the adjacent gulfs are shown. RS refers to Rio Strait and IC to Isthmus of Corinthos. The colored five-point stars show the location of the ground meteorological stations along the coast of the Corinthian Gulf (black: Rio; red: Antikira; and yellow: Isthmus of Corinthos).
are presented in Sect. 3. Using these model data, analy-sis of the short-term climatology of the wind flow across the Corinthian Gulf is achieved in Sect. 4. The identifica-tion of the synoptic patterns associated with strong wind events, using the technique of composite fields, is discussed in Sect. 5. Finally, the concluding remarks of this study are given in Sect. 6.
2 Literature review
Strong winds often develop in coastal gaps or channels worldwide when an along-gap pressure gradient is estab-lished. Such winds occur in specific periods of the year,
hav-ing a strong impact on the local weather conditions and on the definition of the local climatology. Of particular interest is the study of strong winds in straits that constitute a major waterway for commercial, military, and recreational use. In the literature, there are many studies that have investigated the structure and development of sea-level gap winds as well as gap outflow over maritime areas.
that the maximum wind speeds were located well down-stream of the narrowest constriction, at the gap exit, in con-trast to the Venturi effect, which is a popular explanation for the strong gap winds (Reed, 1931). This effect is based on simple conservation principles that dictate that the strongest wind should be observed at the narrowest part of a gap. How-ever, additional wind maxima may also be present within a gap due to Venturi and other hydraulic effects (Jackson and Steyn, 1994; Sharp and Mass, 2002). Colle and Mass (2000) examined the three-dimensional flow and dynamics of east-erly gap flow through the Strait of Juan de Fuca, in the inter-national boundary area between USA and Canada, which is characterized by complex topography. Focusing on the event of 9–10 December 1995 and using high-resolution observa-tions and model simulaobserva-tions, the authors found that, contrary to the classic conceptual model of gap flow down a long channel, there was a confluence within the gap as a result of northeasterly flow descending into the strait from southern Vancouver Island. They also found that the maximum winds were present around the gap exit, supporting previous stud-ies such as those by Overland and Walter (1981), Lackmann and Overland (1989), and Dorman et al. (1995). Steenburgh et al. (1998) investigated the structure and evolution of gap outflow over the Gulf of Tehuantepec in Mexico for the case of 12–14 March 1993 using primarily model output as well as observations from soundings and satellite images. The re-sults showed that the passage of a cold surge over the com-plex topography of the area produced gap winds that reached a maximum of∼25 m s−1.
An intense weather phenomenon can be investigated also from the climatological point of view. An important clima-tological study with regard to gap winds was done by Sharp and Mass (2004). They examined the Columbia Gorge gap winds in the USA using observational data from meteoro-logical stations, for a period of∼2.5 yr, in order to under-stand the wind climatology of the area. Furthermore, synop-tic composite fields were created to identify the large-scale atmospheric patterns leading to strong winds, snowfall, and freezing rain in the gorge.
Numerous studies adopt model output in order to exam-ine the climatology of strong winds over complex topog-raphy, especially in areas where observations are sparse or even do not exist. The low-level jets, orographic effects, and extreme events in Nares Strait, between Ellesmere Is-land and GreenIs-land, were investigated by Samelson and Bar-bour (2008). The analysis of the 2 yr model simulation time series from the mesoscale atmospheric model MM5 (fifth-generation Penn State/NCAR mesoscale model) revealed the extreme meteorological environment of Nares Strait. In Eu-rope, Heimann (2001) analyzed a 12 yr period of Euro-pean Centre for Medium-Range Weather Forecast (ECMWF) reanalysis data to elaborate on basic climatological wind characteristics over the Adriatic Sea and the maritime area of Croatia during winter (Bora and Jugo wind regimes). Goyette (2008) established a numerical model-based
clima-tology of extreme winds over Switzerland, combining the Canadian Regional Climate Model (CRCM) with a wind gust parameterization scheme in order to examine severe wind-storms climatology.
The complex topography of Greece, which consists of many mountainous and sea-level gaps, in combination with the frequent passage of atmospheric disturbances, leads to the formation of numerous terrain-induced wind events. However, the investigation of this interaction has received little attention. Kotroni et al. (2001) evidenced the modu-lation of the Etesian winds in the southern Aegean by the presence of the mountains of Crete. Recently, Koletsis et al. (2009, 2010) examined the interaction of northern wind flow with the complex topography of Crete using both an extensive observational data set as well as high-resolution model simulations. The principal findings of these studies revealed that the presence of the island strongly modifies the general wind flow, producing an upstream deceleration and deflection around the island. Furthermore, the stronger winds were observed at the gap exit, while the changes in pressure difference between gap entrance and exit with the wind in-tensity in gap exit area were in phase, indicating the strong relationship between them.
3 Model and data
Table 1. List of stations and corresponding geographical information.
Station Latitude Longitude Elevation (m)
Rio 38◦18′36′′ 21◦46′48′′ 2
Antikira 38◦22′48′′ 22◦37′48′′ 336 Isthmus of Corinthos 37◦57′00′′ 22◦57′36′′ 2
October 2002) and found that the MRF scheme produces the most consistent forecasts.
Three one-way nested grids – with 24, 8, and 2 km grid resolution in the outer, intermediate, and inner nests – are defined and used on an operational basis. Grid 1 has 24 km horizontal grid increment, covering the major part of Europe, the Mediterranean, and the northern African coast. Grid 2 has 8 km horizontal grid increment, covering the Greek ter-ritory and all the Greek islands. Finally, grid 3 has a 2 km horizontal grid increment, covering the entire Athens area and the adjacent water bodies. The horizontal extension of the defined outer and intermediate operational grids as well as the studied area of Corinthian Gulf is shown in Fig. 2. This study is based on the analysis of model simulations pro-vided by Grid 2. In the vertical direction, 24 unevenly spaced full sigma levels are used, with the maximum resolution in the boundary layer (1.00, 0.99, 0.98, 0.96, 0.93, 0.89, 0.85, 0.80, 0.75, 0.70, 0.65, 0.60, 0.55, 0.50, 0.45, 0.40, 0.35, 0.30, 0.25, 0.20, 0.15, 0.10, 0.05, and 0.00). The MM5 model runs once daily and is initialized at 00:00 UTC. The 00:00 UTC Global Forecast System (GFS, provided by the National Cen-ters for Environmental Predictions (NCEP), USA) gridded analysis fields and 6 h interval forecasts, at 0.5◦square
lati-tude/longitude horizontal grid increment, are used to initial-ize the model and to nudge the boundaries of grid 1 dur-ing the simulation period. No preforecast spin-up period or assimilation of additional observations is used in the opera-tional MM5 model chain.
As aforementioned, the lack of in situ observations within the Corinthian Gulf motivated the authors to investigate cli-matological trends of wind flow using model data. For that reason, 6-hourly model fields from the first 24 h of simulation from grid 2 (8 km grid increment) during the period January 2007 to December 2011 were used. In order to overcome any spin-up problems, the estimation of the wind regime across the Corinthian Gulf is developed using the output data 6 h after the initialization of the model. Hence, a 5 yr model-based climatology has been created. It should be noted that MM5 has been extensively and successfully used to simu-late terrain-induced wind events in complex topography en-vironments worldwide (e.g., Steenburgh et al., 1998; Colle and Mass, 2000; Samelson and Barbour, 2008; Koletsis et al., 2010).
The results are compared with 2 yr of wind observations (2010–2011) from three surface automated meteorological
stations. Two stations are located close to Rio Strait and Isth-mus of Corinthos, while the third one is situated on the north-ern coast in the middle of the Corinthian Gulf. The locations as well as geographical information about the stations are given in Fig. 1 and Table 1, respectively.
Finally, in order to identify the synoptic patterns that lead to strong wind events in a specific area across the gulf, grid-ded analysis data from the ECMWF have been used. The data set has a horizontal resolution of 0.5◦and the time interval is 6 h.
4 Corinthian Gulf wind regime
The investigation of the wind regime across the Corinthian Gulf is accomplished through analysis of the model simu-lated 10 m wind for a 5 yr period. With the aim to study the wind flow over the maritime areas, only the sea grid model points have been considered in the analysis.
4.1 A 5 yr mean wind speed analysis
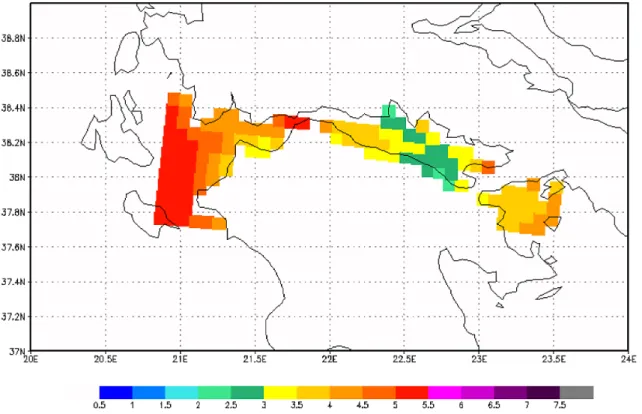
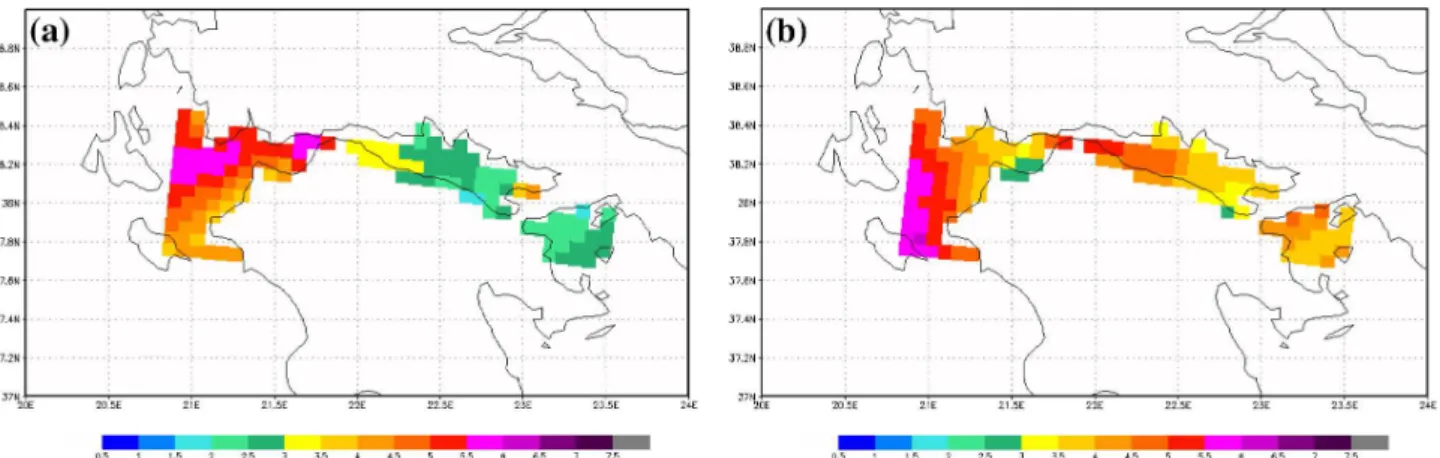
Figure 3 shows the mean wind speed during the period of January 2007 to December 2011 for the studied region (de-noted by the white rectangle in Fig. 1a). The maximum wind speeds are found at the western edge of the Gulf of Patras with values around 5–5.5 m s−1, as well as on both sides of Rio Strait (see Fig. 1b for the locations mentioned in the text). The high average wind speed at Rio Strait is in good agreement with the relevant literature, which showed that the maximum wind speed is found in terrain restrictions, and especially where the channel/strait abruptly widens (gap exits) (Dorman et al. 1995; Steenburgh et al., 1998; Sharp and Mass, 2002; Samelson and Barbour, 2008). Inside the Corinthian Gulf, the average winds gradually decrease east of Rio Strait down to 2.5–3 m s−1, except for a local
maxi-mum at the northwestern edge of Isthmus of Corinthos with average speed exceeding 5 m s−1. Focusing on the area of
the Saronic Gulf, the wind speed reveals a local maximum on both sides of Isthmus of Corinthos (3–3.5 m s−1), but the strongest winds are located further to the east within the Sa-ronic Gulf.
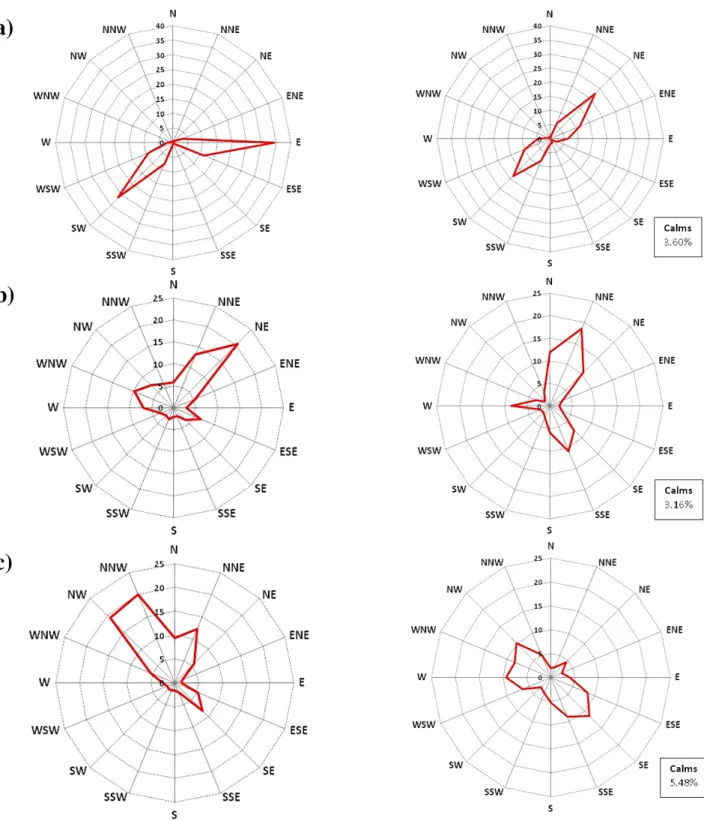
4.2 Wind roses analysis
The frequency distribution of wind speed direction is an im-portant climatological element, and is a complementary con-stituent for investigating the wind climatology. Wind roses have been drawn for six selected grid points, as shown in Fig. 4, with the aim to describe the wind regime at
– the sea grid points on both sides of Rio Strait (red and yellow star in Fig. 4),
Fig. 2.Horizontal extensions of MM5 operational grids. The rectangles inside the grid 1 area (24 km grid spacing) denote the location of grid 2 (8 km grid spacing) as well as the studied area of Corinthian Gulf, which is found inside the intermediate grid.
Fig. 3.Mean wind speed at 10 m derived from 6 h model data for the period January 2007–December 2011.
– the sea grid points on both sides of the Isthmus of Corinthos (black and light-grey star in Fig. 4).
As shown in Fig. 4 the wind roses represent three wind speed ranges: light (0–5 m s−1), moderate (5–10 m s−1), and strong wind (>10 m s−1).
direction is evident. Easterly and southwesterly winds pre-vail at the western edge of Rio Strait (red star), with a per-centage of about 34 and 27 %, respectively, while the moder-ate and strong winds are mainly from the east. On the other hand, at the eastern edge of the Rio Strait (yellow star), a clockwise shift of the prevailing direction is obvious, due to the surrounding gap orientation, with east-southeasterly and west-southwesterly directions prevailing with 36 and 30 %, respectively. As concerns the strong winds, eastern sector winds also dominate on this side of the strait.
Inside the Corinthian Gulf, the western sea grid point (green star in Fig. 4) has a similar wind rose to Rio Strait’s sea grid points, but it is further rotated clockwise following the geometry of the Corinthian Gulf. At the eastern grid point of the gulf (light-blue star in Fig. 4), north-northeasterly winds dominate with a percentage of occurrence of∼19 %. This direction is associated with the local-scale topographic effects on wind field, such as downslope and gap flow, that are generated from the surrounding complex terrain. More-over, the seasonal analysis (not shown) for the specific grid point revealed that the higher frequency of north and north-northeastern winds occurs during the summer and autumn months (∼6 %), suggesting that the dominant north winds could be associated with the Etesian flow over the Aegean Sea during these months (Meteorological Office, 1962).
Finally, the prevalence of northwesterly winds on both sides of the Isthmus of Corinthos is caused by the chan-neling of the wind through the strait. This chanchan-neling has been identified in studies devoted to air pollutant transport over the Athens area that were either based on observational campaigns (Asimakopoulos et al., 1994) or model simula-tions (Kotroni et al., 1999). At the western edge of the strait (black star in Fig. 4) the northwestern sector (northwesterly and north-northwesterly winds) prevails with a frequency of ∼40 %. A similar pattern is seen at the eastern sea grid point (light-grey star in Fig. 4), with the northwesterly winds pre-senting an occurrence percentage of 23 %. Strong winds at this strait are often observed from the northwest direction.
4.3 Model validation
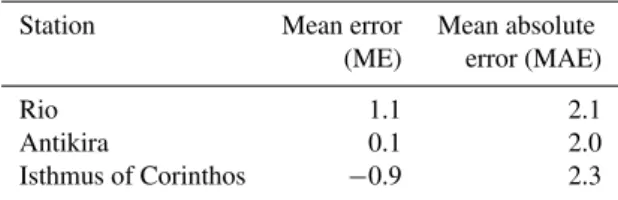
Because of the scarcity of observations along the Corinthian Gulf, detailed observational documentation of the wind field is not possible. Surface station data within the Corinthian Gulf area are available at three locations: Rio, Antikira, and Isthmus of Corinthos (Fig. 1b, Table 1). These stations were quite recently deployed by the NOA (from late 2009). Al-though the period of the available observational data is quite short, these data can be used in order to investigate the valid-ity of the model results. The comparison between simulated and observed wind field is achieved using the grid point near-est to the surface station. For the qualitative validation, wind rose diagrams have been plotted for the period 2010–2011. In addition, a quantitative validation has been performed by cal-culating the statistical measures of bias (mean error, ME) and
Table 2.Mean error and mean absolute error of the wind speed at Rio, Antikira, and Isthmus of Corinthos stations.
Station Mean error Mean absolute (ME) error (MAE)
Rio 1.1 2.1
Antikira 0.1 2.0
Isthmus of Corinthos −0.9 2.3
mean absolute error (MAE) for the same period. The mean error is defined as ME= |Ps−Po|, wherePsis the simulated
andPothe observed wind speed, and the mean absolute error
is defined as MAE = |Ps−Po|/n, wherenis the number of
records.
At almost all of these stations the wind direction distribu-tion is well reproduced by the model (Fig. 5). At Rio stadistribu-tion, the simulated distribution of wind direction is also bimodal, with a clockwise deflection towards easterly directions in comparison to the observations (Fig. 5a). This difference could be explained by the veering of wind flow over the sea, as the friction is much weaker over the smooth sea surface under certain stability conditions (Brettle and Smith, 1999; Savijärvi, 2004). However, the vicinity of Rio station to the high mountains of northwestern Peloponnese (Fig. 1b) could noticeably modify the general airflow, producing a wind flow more parallel to the shoreline (Barry, 2008; Burch, 2008). Inside the Corinthian Gulf, and especially at Antikira, both wind roses present a very similar distribution of the wind di-rections (Fig. 5b). On the eastern side of the gulf, the simu-lated wind rose at Isthmus of Corinthos presents a qualitative agreement with the observed one, as the northwest wind di-rection dominates for both wind roses (Fig. 5c).
The statistical results for the quantitative evaluation are summarized in Table 2. Simulated wind speed is in good agreement with observations. The wind speed mean error ranges from−0.9 to 1.1 m s−1(positive bias indicates over-estimation of wind speed by the model). The mean abso-lute errors are on the order of 2 m s−1, which is comparable with MAE values reported by Lagouvardos et al. (2003), who compared BOLAM model wind forecasts against buoy data over the Aegean Sea, and by Akylas et al. (2007), who ver-ified MM5 model wind forecasts against surface stations in Athens.
Fig. 6.Mean wind speed at 10 m derived from 6 h model data for (a) the eastern sector (wind direction from 45 to 135◦) and (b) the western sector (wind direction from 215 to 315◦) winds.
4.4 Easterly and westerly winds
The results from the wind rose analysis revealed that the western and the eastern sector winds present the highest fre-quencies of occurrence. For that reason, and in order to focus on these directions, the wind data with a direction from 45 to 135◦(eastern sector) and those with a direction from 225 to 315◦ (western sector) have been analyzed separately. From this classification, two average wind speed charts for each wind sector were produced (Fig. 6).
Focusing on the eastern sector winds (Fig. 6a), the max-imum average wind speed is found over the Gulf of Pa-tras (4–6 m s−1), with lower average winds in the
neigh-boring Corinthian (2–3.5 m s−1) and Saronic gulfs (1.5–
3 m s−1). Remarkable are two sea grid points above
Isth-mus of Corinthos where the average wind speed reaches 3.5– 4.5 m s−1. It should be noted that a few kilometers eastward of these grid points, two important topographic features lie in the area (Fig. 1b), Mt. Kithairon (1400 m) and Mt. Gerania (1300 m), while between them, the terrain consists of numer-ous hills up to 600 m, in which elevated gaps are included. Thus the higher-than-average wind speed suggests that the wind regime in this area is strongly affected by the neighbor-ing topography that produced the downslope winds and/or gap winds.
On the other hand, the stronger western sector winds are located at the southwestern edge of the Gulf of Patras over the Ionian Sea (5–6 m s−1, Fig. 6b). Upstream of Rio
Strait the average wind speed reveals a deceleration zone (3.5–4 m s−1) due to the presence of the mountainous
ter-rain of northwestern Peloponnese and western Sterea Hel-las (Fig. 1). This deceleration is a common characteristic in areas of airflow blocked by high mountains (Smith, 1982; Kotroni et al., 2001; Koletsis et al., 2009b). As the westerly flow moves out the eastern Rio Strait, it seems to accelerate because of the terrain narrowing to about 5–5.5 m s−1. Inside the Corinthian Gulf the higher average wind speed is located
east of Rio Strait up to the center of the gulf (4.5–5.5 m s−1) at a distance of∼60 km downstream, while moving eastward the average wind speed decreases gradually to 3–3.5 m s−1. This flow behavior is a classic gap outflow, and a significant number of studies have been devoted to its downstream ex-tension (Overland and Walter, 1981; Legeckis, 1988; Bond and Macklin, 1993; Schultz et al., 1997; Steenburgh, 1998). Finally, in the Saronic Gulf, a similar pattern of the wind field is observed, as the average wind speed presents its max-imum value southeast of the Isthmus of Corinthos gap exit (4–4.5 m s−1)extending in an area of∼15 km, with a grad-ual deceleration farther downstream.
4.5 Seasonal analysis
The study of eastern and western sector winds revealed that the wind regime along the gulfs is greatly influenced by the gap flow from Rio and Isthmus of Corinthos straits. More-over, the maximum wind speeds are located at the nearest sea grid points on both sides of Rio Strait. In order to gain insight into the high-wind climatology in the area, a seasonal analysis of wind distribution on both sides of straits is per-formed. Seasonal analysis has been integrated for all wind data of the period of January 2007 to December 2011 that exceed the threshold of 12 m s−1.
Fig. 7.Seasonal bar diagrams of the frequency of occurrence (%) of each wind direction (a) west and (b) east of Rio Strait. The minimum selected wind speed threshold throughout the period January 2007 to December 2011 is 12 m s−1. Seasonal bar diagrams of the frequency of occurrence (%) of each wind direction (c) west and (d) east of the Isthmus of Corinthos. The minimum selected wind speed threshold throughout the period January 2007 to December 2011 is 12 m s−1.
east-southeast winds prevail during winter (∼28 %), fol-lowed by the second-greatest percentage of 6 % during au-tumn and spring. Westerly–southwesterly winds occur more often compared to the area west of Rio Strait, with a fre-quency of 14 and 13 % for winter and spring, respectively.
The high-speed wind distribution at the eastern part of the Corinthian Gulf is given in Fig. 7c and d. Northwest of Isth-mus of Corinthos Strait (black star location in Fig. 4), the prevailing wind directions for all seasons presents a range from west-northwest up to north-northeast, with the high-est percentages being from northwhigh-est directions (40 %). In winter, the northwest winds occur more often (20 %), while the north-northwest winds follow with a percentage of 10 %. The dominant wind direction for strong winds during the transitional seasons is from northwest and north-northeast (∼10 %), in contrast to summer, when strong winds oc-curred only from the northwest direction. In the area south-east of Isthmus of Corinthos Strait (light-grey star location in Fig. 4) (Fig. 7d), the west-northwest direction presents the maximum percentage for spring and winter season (∼15 %), while during summer the dominating wind direction is from northwest (7 %). The prevalence of northwest winds during summer months over this area has also been evidenced in previous studies, especially concerning air pollutant trans-port over the greater Athens area and sea breeze mechanisms (Asimakopoulos et al., 1994; Helmis et al., 1995; Kotroni et al., 1999). The seasonal analysis of the high winds in the eastern part of the Corinthian Gulf showed that the Isthmus of Corinthos Strait plays an important role in the definition of the wind regime in the area.
5 Synoptic analysis
The results from the short-term climatological analysis of the eastern and western sector winds revealed that the stronger winds are found in the maritime area west of Rio Strait (Fig. 6a). Indeed, this characteristic is especially important during winter months, as suggested by the seasonal analysis (Fig. 7a). In addition, considering the societal importance of the Gulf of Patras (maritime transport) and Rio Strait (road and maritime link between Peloponnese and western Greece) a further investigation of the synoptic conditions that favor the development of such high winds is needed. To concisely illustrate the atmospheric circulations that generated strong winds, upper-air and surface analysis data from the ECMWF were used; namely, composite charts have been created.
Many studies in atmospheric sciences used composite fields in order to identify synoptic patterns that are associ-ated with particular weather events. Sharp and Mass (2004) uses this technique to determine the large-scale atmospheric patterns leading to strong east and southeast winds, snowfall, and freezing rain in the Columbia Gorge. Heimann (2001), in his study concerning Bora and Jugo winds in the Adriatic Sea, used average fields at the level of 500 hPa to identify the synoptic pattern that leads to these windstorms. In ad-dition, Goyette (2008) used the synoptic average mean sea level pressure and 1000–500 hPa thickness field to illustrate the pattern for the 10 strongest windstorms over Switzerland during a period of almost 30 yr.
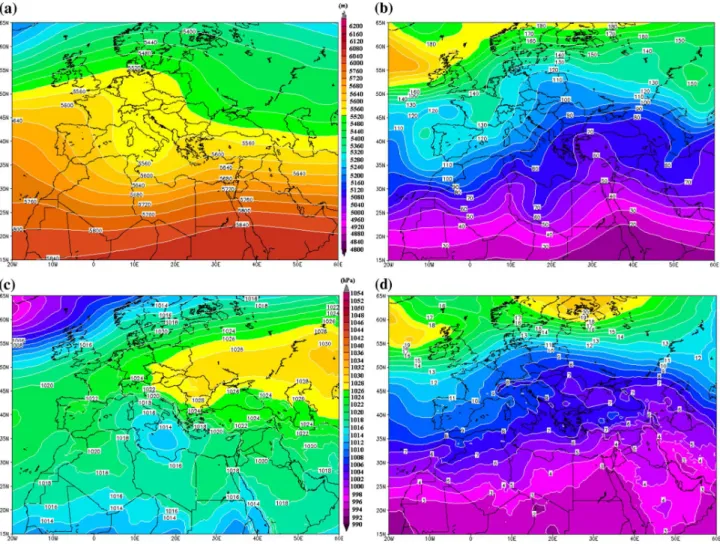
Fig. 8.Composite field of (a) 500 hPa geopotential height (at 40 m contour intervals) and (c) mean sea level pressure field (at 2 hPa contour intervals) with their corresponding standard deviation fields (b) and (d), respectively.
were characterized by eastern sector winds (east and east-southeast winds) exceeding 10 m s−1. The aim is to elucidate the synoptic forcing that leads to the strongest winds in that area. Since gap flow events in Rio Strait often last several days, care has been taken to ensure that data for a specific day are used only once in the creation of composites. Thus, an event is considered as the first day in which the composite criteria is satisfied, and an interval of at least 48 h not meeting the criteria was required for the next event to be considered independent of the previous one. From the 6 h data set of an event, the time stamp with the maximum wind speed was selected in order to produce the composite. In addition, fol-lowing the results of the seasonal analysis, only winter events (December, January, and February; hereafter DJF) were se-lected.
During the study period of 451 winter days, a total of 25 events (69 days) in DJF have been identified with easterly mean wind speed exceeding 10 m s−1. The mean compos-ite as well as the standard deviation fields of the 500 hPa geopotential height and mean sea level pressure are
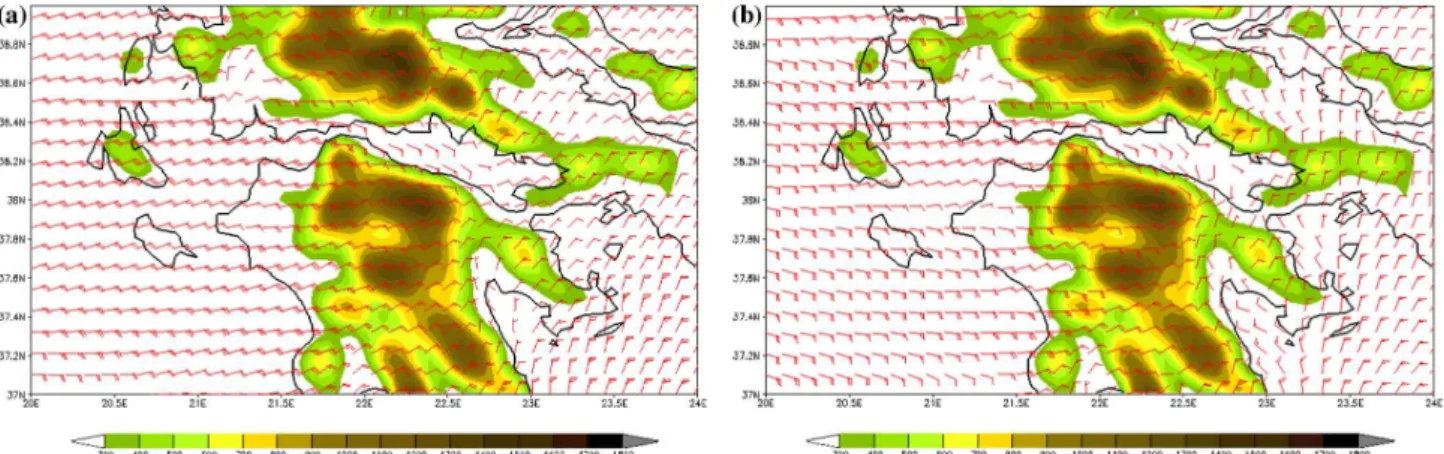
Fig. 9.10 m wind speed from MM5 model valid at (a) 06:00 UTC on 26 December 2011 and (b) 18:00 UTC on 12 January 2009. A full barb corresponds to 5 m s−1. Colored shading shows the terrain heights exceeding 300 m.
over central Europe (upstream of the Dinaric Alps) without a well-defined cyclone to the south (Gohm and Mayr, 2005).
It should be noted that when increasing the speed thresh-old to 12 m s−1, the respective composite fields show an upper-level cut-off low, which is located over southwestern Italy and the Tyrrhenian Sea (5520 m), with a more intensi-fied upper-level ridge over western Europe (not presented). Moreover, the composite field of mean sea level pressure shows a similar pattern with the field of Fig. 8c, with the high-pressure center over central and eastern Europe reach-ing 1032 hPa (not shown).
Looking in detail at the wind events used for the compos-ite analysis, it should be noted that the strongest episode of the 18 selected wind events occurred on 26 December 2011, when the simulated wind speed west of Rio Strait reached 17 m s−1. All the wind events were characterized by the pres-ence of a strong anticyclone over central Europe, and the highest pressure center was 1038 hPa, which was associated with the wind events of 28 December 2007 and 26 Decem-ber 2011. As concerns the prevalence of low pressures over Sidra Gulf, the deepest low-pressure systems were associ-ated with the high-wind events of 16 December 2010 and of 24 February 2011, with central pressures of 1004 and 1000 hPa, respectively. During these two events, the maxi-mum simulated wind speed in the western part of Rio Strait was 13.5 and 12.5 m s−1, respectively. Finally, as has already
been discussed, the airflow across the gulf is noticeably mod-ified by the topography of the area. In order to highlight this behavior, the two strongest wind events that occurred during the study period (26 December 2011 and 12 January 2009) are presented in Fig. 9. It can be seen that the air flow is strongly affected by the surrounding terrain across the gulf, and especially near Rio Strait, where the maximum winds occurred. It should be pointed out, for both cases, the abrupt wind direction change as well as the wind speed reinforce-ment at the westward exit of Rio Strait.
6 Summary and conclusions
The complex terrain that surrounds the Corinthian Gulf, as well as the presence of straits at its western and eastern edges, plays an important role on the definition of the wind flow in the area. In order to investigate the wind regime of the Corinthian Gulf, a 5 yr wind climatology (January 2007 to December 2011) has been constructed using model outputs from grid 2 of the operational mesoscale model MM5. The model-based analysis of the wind flow provides a full spatial coverage of wind information with a horizontal grid incre-ment of 8 km, especially in this specific maritime area where observational records are very recent and spatially sparse.
The analysis showed that, on average, the windiest areas are located at the open sea of the Gulf of Patras as well as on both sides of Rio Strait. Inside the gulf the average wind speed decreases, and at the eastern gulf strait (Isth-mus of Corinthos), the wind speed slightly increases on both sides of the terrain restriction. Analysis of the wind directions showed that the eastern sector winds prevail on both sides of Rio Strait, while at the Isthmus of Corinthos the dominant wind direction is from northwest. The finding of this study that the strongest winds are located in the exit areas of the straits is in agreement with previous studies concerning gap flows worldwide (Overland and Walter, 1981; Dorman et al., 1995; Sharp and Mass, 2002; Colle and Mass, 2000).
The investigation of the seasonal distribution of strong winds (>12 m s−1) showed that to the west of Rio Strait,
Corinthos, and the west-northwest (15 %) for the southeast-ern side of Isthmus of Corinthos Strait exit. Furthermore, the summer frequency of northwesterly flow for both areas is re-markable.
The results of the 5 yr analysis of the wind flow showed that the highest winds in the area are eastern sector winds at Rio Strait. The synoptic pattern related with these high winds is described by the presence of a 500 hPa trough over Italy. At the surface these events are characterized by a low-pressure center north of Sidra Gulf and high pressures over central Eu-rope. The upper-level southwesterly flow and easterly surface flow direction suggests the presence of a strong wind shear over the area of western Greece, and especially across the Corinthian Gulf. An atmospheric wind shear over a complex terrain often is associated with the creation of mean state crit-ical levels above mountain tops enhancing the development of low-level high winds (Durran and Klemp, 1987; Bacmeis-ter and Pierrehumbert, 1988; Colle and Mass, 1998; Koletsis et al., 2009a).
The estimation of the wind regime provided in this study is restricted to the surface wind flow. The investigation of the vertical structure of the wind flow over the Corinthian Gulf, and especially the gap flow mechanisms over the straits, will allow for further insight to be gained in order to understand the evolution of these strong wind events. For that reason, high-resolution mesoscale simulations over the straits are necessary and it is in the authors’ plan to perform such study in the near future.
Supplementary material related to this article is available online at
http://www.nat-hazards-earth-syst-sci.net/14/459/2014/ nhess-14-459-2014-supplement.zip.
Acknowledgements. ECMWF is kindly acknowledged for the provision of gridded analyses data. The topographic maps that are presented in this study have been downloaded from the web site http://www.maps-for-free.com/. The authors are grateful to Dr. Nikolaos Mazarakis for his help in producing the composite fields.
Edited by: M.-C. Llasat
Reviewed by: P. K. Katsafados and two anonymous referees
References
Akylas, E., Kotroni V., and Lagouvardos, K.: Sensitivity of high resolution operational forecasts to the choice of the planetary boundary layer scheme, Atmos. Res., 84, 49–57, 2007.
Asimakopoulos, D. N., Kallos, G., Kalogiros, J., Papadopoulos, H., Petrakis, M., and Soilemes, A. T.: The SECAP experimen-tal campaign during summer 1993. Intermediate Report prepared
for the DGXII of the EU, available from Laboratory of Meteorol-ogy, University of Athens, PHYS-5, Athens 15784, Greece, 150 pp., 1994.
Bacmeister, J. T. and Pierrehumbert, R. T.: On high-drag states of non-linear stratified flow over an obstacle, J. Atmos. Sci., 45, 63– 80, 1988.
Barry, G. R.: Mountain Weather and Climate, 3rd Edition, Cam-bridge University Press, Boulder, 2008.
Bond, N. A. and Macklin, S. A.: Aircraft observations of off-shore-directed flow near Wide Bay, Alaska, Mon. Weather Rev., 121, 150–161, 1993.
Brettle, M., and Smith, B.: Weather to Sail, Crowood Press, Marl-borough, UK, 126 pp., 1999.
Burch, D.: Modern Marine Weather, Starpath Publications, 179– 192, 2008.
Colle, B. A. and Mass, C. F.: Windstorms along the western side of the Washington Cascade Mountains. Part I: A high-resolution observational and modeling study of the 12 February 1995 Event, Mon. Weather Rev., 126, 28–52, 1998.
Colle, B. A. and Mass, C. F.: High-resolution observations and nu-merical simulations of easterly gap flow through the strait of Juan de Fuca on 9–10 December 1995. Mon. Weather Rev., 128, 2398–2422, 2000.
Dorman, C. E., Beardsley, R. C., and Limeburner, R.: Winds in the Strait of Gibraltar, Q. J. Roy. Meteor. Soc., 121, 1903–1921, 1995.
Durran, D. R. and Klemp, J. B.: Another look at downslope windstorms. Part II: Nonlinear amplification beneath wave-overturning layers, J. Atmos. Sci., 44, 3402–3412, 1987. Gohm, A. and Mayr, G. J.: Numerical and observational case-study
of a deep Adriatic bora, Q. J. Roy. Meteor. Soc., 131, 1363–1392, 2005.
Goyette, S.: Development of a model-based high-resolution ex-treme surface wind climatology for Switzerland, Nat. Hazards, 44, 329–339, 2008.
Heimann, D.: A model-based wind climatology of the eastern Adri-atic coast, Meteorol. Z., 10, 5–16, 2001.
Helmis, C. G., Papadopoulos, K. H., Kalogiros, J. A., Soilemes, A. T., and Asimakopoulos, D. A.: Influence of background flow on evolution of Saronic Gulf sea breeze, Atmos. Environ., 29B, 3689–3701, 1995.
Hong, S.-Y. and Pan, H.-L.: Nonlocal boundary layer vertical diffu-sion in a medium-range forecast model, Mon. Weather Rev., 124, 2322–2339, 1996.
Jackson, P. L. and Steyn, D. G.: Gap winds in a Fjord, Part I: Ob-servations and numerical simulation, Mon. Weather Rev., 122, 2645–2665, 1994.
Kain, J. S. and Fritsch, J. M.: Convective parameterization for mesoscale models: The Kain-Fritsch scheme. The Representa-tion of Cumulus in numerical models, Meteor. Mon., No 46, Amer. Met., Soc., 165–177, 1993.
Koletsis, I., Lagouvardos, K., Kotroni, V., and Bartzokas, A.: Numerical study of a downslope windstorm in Northwestern Greece, Atmos. Res., 94, 178–193, 2009a.
Koletsis, I., Lagouvardos, K., Kotroni, V., and Bartzokas, A.: The interaction of northern wind flow with the complex topogra-phy of Crete Island – Part 2: Numerical study, Nat. Hazards Earth Syst. Sci., 10, 1115–1127, doi:10.5194/nhess-10-1115-2010, 2010.
Kotroni, V. and Lagouvardos, K.: Precipitation forecast skill of dif-ferent convective parameterization and microphysical schemes: application for the cold season over Greece, Geophys. Res. Lett., 28, 1977–1980, 2001.
Kotroni, V., Kallos, G., Lagouvardos, K., Varinou, M., and Walko, R.: Numerical Simulations of the Meteorological and Dispersion Conditions during an Air Pollution Episode over Athens, Greece. J. Appl. Meteorol., 38, 432–447, 1999.
Kotroni, V., Lagouvardos, K., and Lalas, D.: The effect of the island of Crete on the Etesian winds over the Aegean Sea, Q. J. Roy. Meteor. Soc., 127, 1917–1937, 2001.
Lackmann, G. M., and Overland, J. E.: Atmospheric structure and momentum balance during a gap-wind event in Shelikof Strait, Alaska, Mon. Weather Rev., 117, 1817–1833, 1989.
Lagouvardos, K., Kotroni, V., Koussis, A., and Feidas, H.: The Meteorological Model BOLAM at the National Observatory of Athens: Assessment of two-year operational use, Am. Meteor. Soc., 42, 1667–1678, 2003.
Legeckis, R.: Upwelling off the Gulfs of Panama and Papagayo in the tropical Pacific during March 1985, J. Geophys. Res., 93, 15485–15489, 1988.
Meteorological Office: Weather in Mediterranean, Vol. I, General Meteorology, 2nd Edn., H.M.S.O., London, 1962.
Overland, J. E. and Walter Jr., B. A.: Gap winds in the Strait of Juan de Fuca, Mon. Weather Rev., 109, 2221–2233, 1981.
Reed, T. R.: Gap winds in the Strait of Juan de Fuca, Mon. Weather Rev., 59, 373–376, 1931.
Samelson, R. M. and Barbour, P. L.: Low-Level Jets, Orographic Effects, and Extreme Events in Nares Strait: A Model-Based Mesoscale Climatology, Mon. Weather Rev., 136, 4746–4759, 2008.
Savijärvi, H.: Model predictions of coastal winds in a small scale, Tellus, 56A, 287–295, 2004.
Schultz, D. M., Bracken, L. F., Bosart, G. J., Hakim, M. A., Bedrick, M. J., Dickinson, M. J., and Tyle, K. R.: The 1993 Superstorm cold surge: Frontal structure, gap flow, and tropical impact, Mon. Weather Rev., 125, 5–39; Corrigendum, 125, p. 662, 1997. Schultz, P.: An explicit cloud physics parameterization for
opera-tional numerical weather prediction, Mon. Weather Rev., 123, 3331–3343, 1995.
Sharp, J. and Mass, C. F.: Columbia Gorge gap flow – Insights from observational analysis and ultra-high-resolution simulation, B. Am. Meteorol. Soc., 83, 1757–1762, 2002.
Sharp, J. and Mass, C. F.: Columbia gorge winds: their climato-logical influence and synoptic evolution, Weather Forecast., 19, 970–992, 2004.
Smith, R. B.: Synoptic observations and theory of orographically disturbed wind and pressure, J. Atmos. Sci., 39, 60–70, 1982. Steenburgh, W. J., Schultz, D. M., and Colle, B. A.: The structure