Variation of North-South Asymmetry of
Solar Flare Index and Associated
Solar Activity
A. B. BHATTACHARYA†
Department of Physics, University of Kalyani, Kalyani 741235, West Bengal, India
asit1951@yahoo.com
M. DEBNATH
Department of Physics, University of Kalyani, Kalyani 741235, West Bengal, India min2debnath.806@rediffmail.com
T. DAS
Department of Physics, University of Kalyani, Kalyani 741235, West Bengal, India
dastanusree1979@gmail.com
Abstract
The unequal distributions of various aspects of solar activity between the north and south hemisphere of the Sun have been reported in the paper. When we consider north and south asymmetries of both sunspot area and solar flare indices over the cycles 20 to 23 it is noted that (i) there are large variations both in northern and southern sunspot areas, (ii) both hemispheres have an asymmetric behavior in terms of a solar activity measure, (iii) sunspot areas in northern and southern hemispheres exhibit 11 year periodicity when they were analyzed separately, (iv) asymmetry at the end of prolonged cycle 23 is unusually high, (v) the northern hemisphere is dominant up to 2001 but thereafter the southern hemisphere takes over from 2002 to the end of solar cycle 23 and then the northern hemisphere dominates in the beginning of cycle 24, (vi) yearly plot of flare index reveals that the northern and southern hemisphere is not in phase wherein the northern hemisphere leads in phase by 2 years with two adjacent peaks.
Keywords: North-south asymmetry; solar flare; solar activity.
1. Introduction
2. Analyses
Variations in the monthly total sunspot areas over the whole solar disk and separately over the northern and southern hemispheres have been analyzed. Statistical properties of sunspots and their magnetic fields are extracted from the SOHO full disk white light images and magneto grams for the searchable Solar Feature Catalogue (SFC).
To study asymmetry of flare-index (AFI) it is customary to use the following formula
AFI =
(
)
(
)
N
S
N
S
(1)where N and S stand for the monthly north and south flare index values respectively.
The asymmetry of the sunspot number (ASN) has been considered according to their hemispherical position. The smoothed monthly mean sunspot number and sunspot area in the northern and southern hemispheres have been taken into consideration to investigate the characteristics of long term hemispheric sunspot activity.
Sunspot number is computed according to the Wolf Sunspot Number R=k (10g+s), where g is the number of
sunspot groups (regions) and s is the total number of individual spots in all the groups; k is a variable scale
factor which is usually less than one [6-8].
3. Results
The total sunspot areas in the Northern and Southern hemispheres measured from a single solar image and their cumulative areas during the whole cycle are shown to have a strong North-South asymmetry with the Northern hemisphere prevailing around and after the maximum while the Southern one taking over towards the solar minimum 2008. It is clear from our study that a significant part of these variations can be accounted for by the fact that the two hemispheres are not exactly in phase. When the activity of the northern hemisphere leads that in the southern hemisphere, the north dominates early in the cycle while the south dominates in the declining phase [9].
In Figure 1 we have plotted the data of northern hemispherical flare index and that occurring in the southern hemisphere during the period 1966 to 2010. It is observed from the plot that these two types of flare index are not in phase. Also we find that at the solar minimum southern hemisphere dominates for flare index. The plot further shows that northern hemisphere dominates at the beginning of the cycle 21, but southern hemisphere is more prominent at the end of this solar cycle. It is also observed that high values of flare index sustain for a long time for both the hemispheres and there is no clear deep valley between two maxima for both hemispheres for cycle 21.It is very interesting to note that these two behaviors are also observed in the cycle 23. For the cycle 22 the figure shows that there is a sharp fall of flare index for northern hemisphere at the end of the cycle. Plot shows that there is a deep valley between two maxima for the cycle 22.
The yearly average values of solar flare indices both for the northern and southern hemispheres are used to investigate the characteristics of long term hemispheric solar activity. Figure 2 reveals that flare indices exhibit peak at different times in the two hemispheres - earlier in the northern hemisphere and later in southern hemisphere. It is interesting to note that the FI values show the two subsequent peaks in all solar activity cycles.
The most prominent two peaks are in 21st solar cycle in northern hemisphere but in 22nd solar cycle in southern
hemisphere. For cycle 20 and 23 the FI were of medium values. It is clear that the northern hemisphere leads in phase by 2 years when two adjacent peaks are observed.
Fig. 2. Yearly variation of flare indices with time (years 1966-2010).
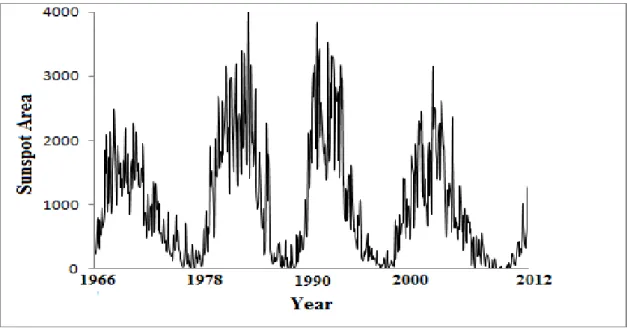
It is evident from Figure 3 and Figure 4that cycle 23 is relatively weak compared to the cycle 21 and cycle 22.
Figure 3 clearly shows the variation of total flare index, while in Figure 4we have plotted sunspot area during
the period January 1966 to February 2012. During the rising phase of the cycle 23 the solar activity indices viz., sunspot number and sunspot area are equal for the northern and southern hemispheres.
Fig. 4. Variation of sunspot area from January 1966 to February 2012.
In Figure 5 we have plotted the average number of sunspot against solar flare index during 1992-2010 where monthly averages over each year is taken into account. It is observed that these two dominant features of solar activity vary linearly with respect to each other. A calculation shows that the correlation coefficient between them is 0.93.
Fig. 5. Sunspot number vs. solar flare index during 1992 to 2010.
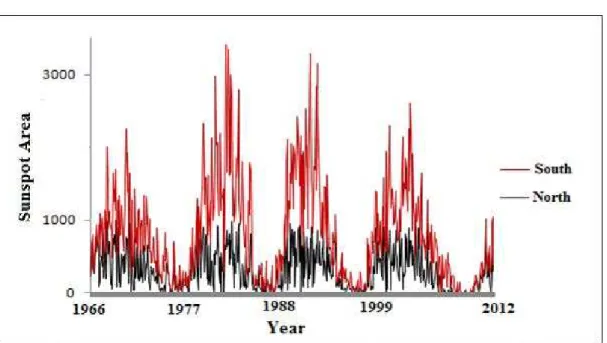
Based on the derived hemispheric sunspot numbers, sunspot areas and solar flare indices we have studied the significance of N-S asymmetries. The asymmetry in solar features is found to be significantly high in statistical consideration. Sunspot activity never peaks at the same time in two hemispheres. Figure 6 shows the variation of
sunspot number from 1992 to February 2012. Figure 7 show the monthly variation of sunspot area for both
Fig. 6. Variation of sunspot number January 1992 to February 2012.
Fig. 7. Monthly variation of sunspot area during January 1966 to February 2012.
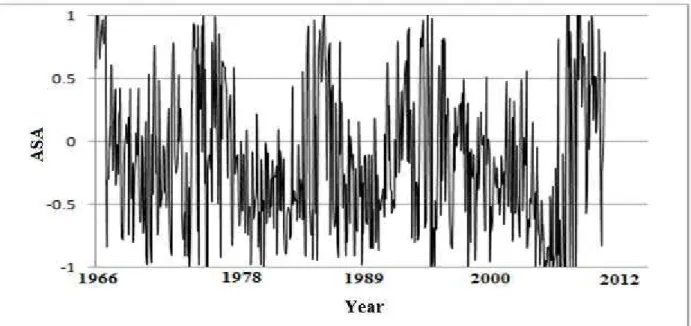
Fig. 8. Asymmetry in sunspot area for the period1966 to February 2012.
Fig. 10. ASN during the year January 1992 to February 2012.
We have plotted AFI and ASN in the same diagram (Figure 11) when we observe that ASN and AFI are not in phase though total flare index varies linearly with total sunspot number as evident from the figure. We find from the figure that AFI asymmetry peaks during solar activity minimum. During the cycle 23 northern hemispheres dominates according to sunspot number. It is interesting to note that the flare activity dominates in southern hemisphere during the ending of cycle 22 and dominance increases during cycle 23.
Fig. 11. ASN (red) and AFI (Black) during 1992 to 2010.
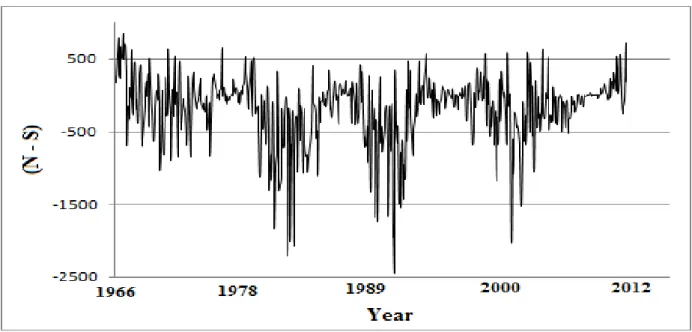
We have plotted in Figure 12 the absolute north-south asymmetry of sunspot area without any normalization i.e., the north south hemispheric difference of sunspot area which is defined as δ(area)=(SA)North-(SA)South;where
conclusions obtained before. For the beginning part of 24 northern hemispheres is stronger than southern hemisphere.
Fig. 12. Difference in sunspot area 1966 to February 2012
From Figure 12 it is clear that though the southern hemisphere leads (with respect to sunspot area) during 1966 to 2008, but during the beginning of new solar cycle 24 (considered up to February 2012) the northern hemisphere leads in phase.
4. Discussion
It is assumed that the north-south asymmetry of sunspot area is due to phase asynchrony between the northern and southern hemispherical activities. This assumption is further supported by the cross-recurrence plot method to examine the synchronization of sunspot area in the northern and southern hemispheres [9, 11]. Long-term observations of solar activity indicate that the behavior of solar activity is asymmetric in nature. For a long time it was believed that occurrences of different features on the northern and southern part of the solar disk are not uniform and that more features occur in one or the other part of the disk in the different intervals. From the analysis of the N-S asymmetry of different features of solar activity, it is noted that the N-S asymmetry is statistically significant and not a random fluctuation and the asymmetry are increased during solar minimum. We have seen that one of the two hemispheres is always slightly advanced in the progress of its cyclic activity compared to the other hemisphere during the last 300 years. Interestingly, after several cycles, the hemispheres change their roles. Other aspects of solar activity reflect these unevenness viz. magnetic fields of the photosphere, faculae, monochromatic and K-corona, prominences and possibility of solar wind. These problems are needed to be considered in a greater detail [12].
Acknowledgements
We are thankful to the Council of Scientific and Industrial Research for financial support through a project (Project No.03(1153)/10/EMR-II, dated 26.04.2010).We also acknowledge the following data sources: http://solarscience.msfc.nasa.gov/greenwch/sunspot_area.txt, http://maurol.com.ar/solar_cycle/, http://solarscience.msfc.nasa.gov/, http://sidc.oma.be/sunspots/bulletins/monthly/,
http://www.swpc.noaa.gov/Data
References
[1] Kleczek,J. 1952,Publ. Inst. Centr. Astron., No. 22, Prague.
[2] Li,K.J.; Su, T.W.; Gao, P. X.(2005): Sunspot Unit Area: A New Parameter to Describe Long-Term Solar Variability, The Astrophysical Journal, 621, pp.L81
[3] Bhattacharya, A.B.; Raha, B.;Das,T.; Debnath ,M.;Halder,D.(2011): Anatomy of Solar Cycle Length and sunspot number: Dependence of Average Global Temperature on Solar Activity, International Journal of Engineering Science and Technology, 3(11) , pp.8012-8018.
[5] Nair,V.S.; Nayer,S.R.P. North South Asymmetry in Solar Wind Activity and Solar Cycle Evolution, Indian Journal of Radio and Space Physics, 37, 391, (2008).
[6] Wilson, O.C.; Vaughan,A.H.; and Mikalas, D.(1981), The Activity Cycles of Stars, Scientific American, 244, pp.104-119.
[7] Wang,Y.M.; Robbrecht,E.( 2011):Asymmetric Sunspot Activity And The Southward Didplacement Of The Heliospheric Current Sheet, The Astrophysical Journal,736 (2), pp. 136.
[8] Temmer,M.; Rybák J., Bendík,P., Veronig,A.; Vogler, F.; Otruba,W.; Pötzi,W.; Hanslmeier, A. (2006), Hemispheric Sunspot Numbers Rn and Rs from 1945–2004: Catalogue and N-S Asymmetry Analysis for Solar Cycles, Astronomy & Astrophysics, 447, pp. 735.
[9] Zolotova, N.V.; Ponyavin, D.I.( 2006),: Phase Asynchrony of the North-South Sunspot Activity, Astronomy & Astrophysics, 449(1), pp. L1–L4.
[10] Ballester, J.L.; Oliver, R.; Carbonell, M. (2005), The Periodic Behaviour of The North-South Asymmetry of Sunspot Areas Revisited, Astronomy & Astrophysics,431, pp. L5.
[11] Donner, R.; Thiel, M.(2007), Scale-resolved Phase Coherence Analysis of Hemispheric Sunspot Activity:A New Look at The North-South Asymmetry, Astronomy & Astrophysics,475, pp.L33.