ALINE DIAS PAIVA
MECANISMO DE AÇÃO E
EFEITOS IMUNOESTIMULATÓRIOS
DE BOVICINA HC5, UMA BACTERIOCINA
PRODUZIDA POR Streptococcus bovis HC5
Tese apresentada à Universidade Federal de Viçosa, como parte das exigências do Programa de Pós-Graduação em Microbiologia Agrícola, para obtenção do título de Doctor Scientiae.
VIÇOSA
ii BIOGRAFIA
ALINE DIAS PAIVA, filha de Hélio de Assis Paiva e Odília Dias Paiva, nasceu em 08 de Junho de 1983, em Juiz de Fora - Minas Gerais.
Iniciou o curso de Nutrição, na Universidade Federal de Viçosa, em Março de 2001, pelo qual graduou-se Nutricionista em Julho de 2005.
iii SUMMARY
LIST OF FIGURES ……… vi
LIST OF TABLES ……….. xxi
LIST OF ABBREVIATIONS ……… xxii
RESUMO ... xxv
ABSTRACT ... xxvii
CHAPTER 1 LITERATURE REVIEW ………...... 1
1.1.Introduction ……… 1
1.2.Bacteriocins produced by gram-positive bacteria ……….. 3
1.3.Mode of action of bacteriocins produced by gram-positive bacteria .. 9
1.4.Bacteriocin application and safety ………. 15
1.5.Bovicin HC5 ……….. 18
1.6.References ……….. 20
CHAPTER 2 The role of Lipid II and membrane thickness in the mechanism of action of the lantibiotic bovicin HC5 ……… 35
2.1. Abstract ……….. 35
2.2. Introduction ……… 36
iv
2.3.1. Chemicals and materials ……… 38
2.3.2. Bacterial strains and culture conditions ……… 38
2.3.3. Bacteriocinas ………. 38
2.3.4. MIC determinations ……….. 39
2.3.5. Membrane depolarization assay using intact cells ……… 39
2.3.6. Preparation of large unilamellar vesicles (LUVs) .…...………. 40
2.3.7. Carboxyfluorescein leakage assay ………. 40
2.3.8. Proton permeability assay ……….. 41
2.3.9. Isothermal Titration Calorimetry (ITC) measurements ………. 41
2.3.10. Assessing assembly using pyrene labeled Lipid II ………….. 41
2.3.11. Preparation of GUVs using electroformation ……….. 42
2.3.12. Confocal Fluorescence Microscopy ………. 42
2.4. Results ……….……… 42
2.4.1. Antimicrobial activity ……… 42
2.4.2. Membrane depolarization ………..……… 43
2.4.3. Specific interaction with Lipid II ……….. 44
2.5. Discussion ……….. 55
2.6. References ……….. 58
CHAPTER 3 The effects of Lipid II binding on bovicin HC5 ……… 62
3.1. Abstract ……….. 62
3.2. Introduction ……… 63
3.3. Experimental procedures .……… 64
3.3.1. Chemicals and materials ……… 64
3.3.2. Bovicin HC5 ……….……… 64
3.3.3. Large unilamellar vesicles and soluble Lipid II ……… 65
v
3.3.5. Acrylamide quenching ………...……… 66
3.3.6. Spin-labeled lipid quenching ……….…...………. 66
3.3.7. Circular dichroism measurements ………. 67
3.4. Results ……….……… 68
3.4.1. Tryptophan fluorescence - Emission spectra ………. 68
3.4.2. Acrylamide quenching ………..………. 70
3.4.3. Spin-labeled lipid quenching ………. 72
3.4.4. Circular dichroism spectroscopy ………..………. 73
3.5. Discussion ……….. 77
3.6. References ……….. 80
CHAPTER 4 Morphologic and immunostimulatory effects of the lantibiotic bovicin HC5 upon oral administration to an animal model ……… 83
4.1. Abstract ……….. 83
4.2. Introduction ……… 84
4.3. Experimental procedures .……… 85
4.3.1. Streptococcus bovis HC5 and bovicin HC5 ...……… 85
4.3.2. Animals …….……….……… 85
4.3.3. Gut permeability ……… 86
4.3.4. Histological and morphometric analysis …….……….. 87
4.3.5. Analysis of relative gene expression by real time PCR ……… 88
4.3.6. Statistical analysis ……….…...………. 91
4.4. Results ……….……… 91
4.4.1. Weight gain .………..………. 91
4.4.2. Gastrointestinal permeability …..…..………. 92
4.4.3. Histological and morphometric analysis ……...………. 93
vi
4.5. Discussion ……….. 106
4.6. References ……….. 114
CHAPTER 5 Effects of the oral administration of Streptococcus bovis HC5 on BALB/c mice ……… 122
5.1. Abstract ……….. 122
5.2. Introduction ……… 123
5.3. Experimental procedures .……… 124
5.3.1. Streptococcus bovis HC5, media and growth conditions ..…… 124
5.3.2. Animals …….……….……… 124
5.3.3. Gut permeability ……… 125
5.3.4. Histological and morphometric analysis …….……….. 126
5.3.5. Analysis of relative gene expression by real time PCR ……… 127
5.3.6. Statistical analysis ……….…...………. 129
5.4. Results ……….……… 130
5.4.1. Weight gain .………..………. 130
5.4.2. Gastrointestinal permeability …..…..………. 131
5.4.3. Histological and morphometric analysis ……...………. 132
5.4.4. Immune parameters ……….………..………. 140
5.5. Discussion ……….. 145
5.6. References ……….. 151
vii
LIST OF FIGURES
CHAPTER 1
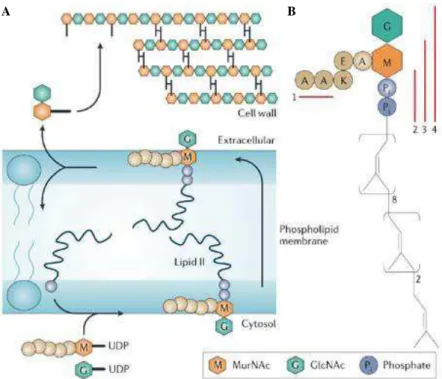
Figure 1. Cell wall assembly. (A) The cell wall biosynthesis starts on the cytosolic side of the bacterial plasma membrane. UDP-activated precursor sugars are assembled on a polyisoprenoid carrier and the coupling of which molecule produces Lipid II; Lipid II is transported across the membrane and peptidoglycan subunits are transferred to the growing peptidoglycan chain; the polyisoprenoid carrier is recycled back to the cytoplasmic side and the cycle is completed. (B) Lipid II structure, showing the polyisoprenoid anchor (eight cis-conformation isoprene units, two units in the trans-conformation and the terminal isoprene unit) and the pentapeptide. Red bars indicate the minimal binding sites in Lipid II of glycopeptide antibiotics (1), nisin (2), ramoplanin (3) and mersacidin (4). GlcNAc,
viii
Figure 2. Nisin-Lipid II interaction. (A) Nisin reaches the bacterial membrane; (B) Nisin’s N-terminal binds to the hydrophilic headgroup of Lipid II, with high affinity; (C) The pore formation starts, and nisin adopts a transmembrane orientation; (D) During or after assembly of four 1:1 (nisin:Lipid II) complexes, four additional nisin molecules are recruited and
the final pore complex is formed. 12
CHAPTER 2
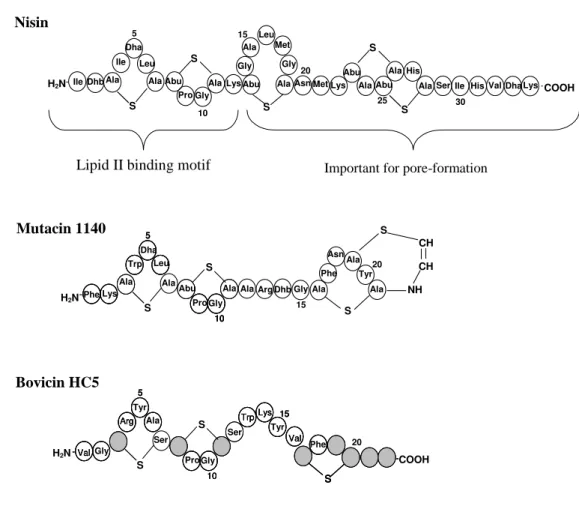
Figure 1. Comparison of primary structures of nisin, mutacin 1140 and
bovicin HC5. In nisin’s and mutacin`s structures, the
posttranslationally modified amino acids residues, dehydroalanine (Dha) and deydrobutyrine (Dhb), as well as the lanthionine rings (Abu-S-Ala and Ala-S-Ala) are shown. In
bovicin HC5’s structure, the residues indicated by striped
circles do not correspond to any 20 amino acids commonly found in proteins, and represent putative posttranslational modified amino acids residues; the suggested positions of
lanthionine linkages are indicated by the traces. 37
Figure 2. Effect of bovicin HC5 and nisin on the membrane potential of glucose-energized cells of Staphylococcus cohnii, determined using DiSC2 (5), a membrane potential sensitive fluorophore.
(A) 0.2 μM bovicin HC5; (B) 0.05 μM nisin; (C) 4 μM bovicin HC5; (D) 0.2 μM nisin. The bacterial cells were diluted to an
OD600nm of 0.05 and DiSC2 (5) was added to a final
concentration of 0.4 μM. The bacteriocin addition was performed when a baseline was reached. Dye release was monitored at excitation and emission wavelengths of 622 and
ix
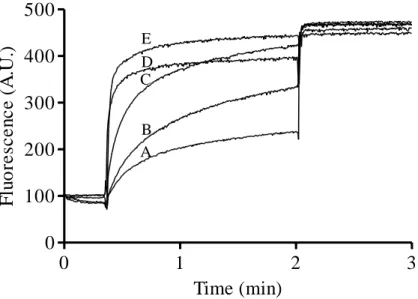
Figure 3. Activity of 0.1 μM (A) and 1 μM (B) bovicin HC5 towards DOPC Lipid II vesicles. Fluorescence of samples containing CF-loaded DOPC vesicles with 0.1 mol % Lipid II was recorded for 3 min. Nisin or bovicin HC5 were added after 20 s and Triton X-100 solution was added to yield the 100 % leakage value. Activity of 0.1 μM nisin (C) is shown as a
positive control. 44
Figure 4. Effect of bovicin HC5 and nisin on the proton permeability of DOPC Lipid II containing vesicles. Time courses of HPTS fluorescence are shown after addition of the bacteriocins to model membranes: (A) 0.1 μM bovicin HC5; (B) 1 μM bovicin HC5; (C) 0.1 μM nisin. Measurements were performed in 10 mM MES, 0.2 M Na2SO4 buffer (pH 5.5) and DOPC
Lipid II vesicles (25 μM final lipid-Pi). 45
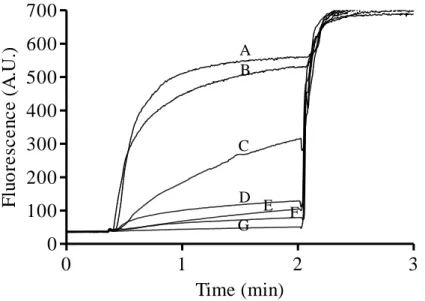
Figure 5. Interference of Lipid II-dependent pore formation activity of nisin by bovicin HC5. Different concentrations of bovicin HC5 (0.01-0.1 μM) were added 20 seconds prior nisin addition (0.1
μM final concentration) to DOPC vesicles (25 μM lipid-Pi) containing 0.1 mol % Lipid II. CF leakage was monitored for 2 minutes, and after that, Triton X-100 was added to determine the maximum CF leakage. (A) 0.1 μM nisin; (B) 0.01 μM bovicin HC5; (C) 0.02 μM bovicin HC5; (D) 0.03 μM bovicin HC5; (E) 0.04 μM bovicin HC5; (F) 0.05 μM bovicin HC5;
x
Figure 6. Calorimetric titrations of bovicin HC5 with DOPC vesicles containing 2 mol % Lipid II. Vesicles were dissolved in 10 mM Tris and 150 mM NaCl (pH 7.5). The graph on the top shows the heat peaks after injections of 5 μL vesicles (20 mM final phospholipid concentration) into the sample cell containing 20 μM bovicin HC5 in the same buffer. The bottom graph displays the integrated heat per injection, normalized to the injected amount of moles of Lipid II and is displayed
against the molar ratio of Lipid II versus bovicin HC5. 48
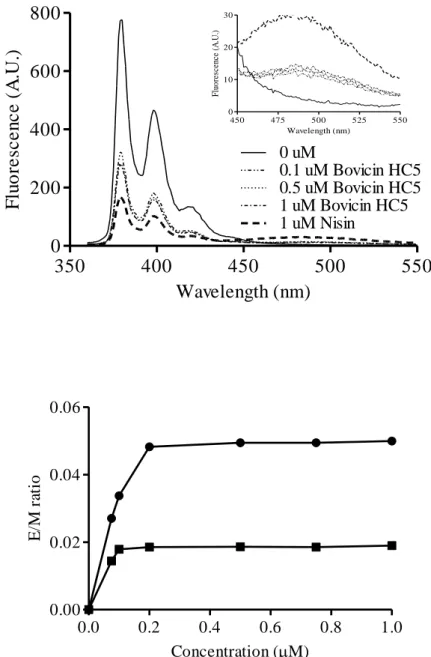
Figure 7. (A) Fluorescence spectra of pyrene labeled Lipid II (0.5 mol %) in DOPC vesicles (25 μM lipid-Pi). Pyrene labeled Lipid II fluorescence was recorded in the absence of bovicin HC5 and after incubation for 5 min with different concentrations of bovicin HC5 (0.1; 0.5; 1 μM). The fluorescence spectrum in the absence of bacteriocins (0 μM) and after addition of 1 μM nisin are shown as negative and positive controls, respectively. The inset shows an enlarged view of the excimer emission part of the spectra. Spectral recordings were performed between 360 and 550 nm, and at an excitation wavelength of 350 nm. (B) Ratio between monomer and excimer signals (E/M ratio) of pyrene labeled Lipid II obtained for DOPC LUVs, after addition of nisin (circles) and bovicin HC5 (squares). The E/M
ratio is shown as a function of bacteriocin concentration. 50
Figure 8. Activity of bovicin HC5 ((A) 0.1 μM; (C) 1 μM) and nisin ((E) 0.1 μM) towards DLPC/DMoPC Lipid II vesicles. Activity of 1 μM bovicin HC5 (B) and 0.1 μM nisin (D) towards DLPC/DMoPC vesicles without Lipid II are also shown. Fluorescence of samples containing CF-loaded DLPC/DMoPC vesicles with 0.1 mol % Lipid II was recorded for 3 min. Nisin or bovicin HC5 were added after 20 s and 100 % leakage level
xi
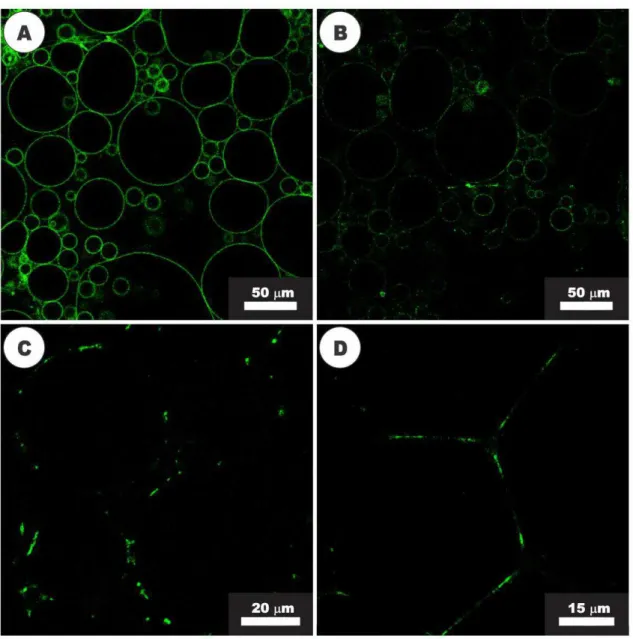
Figure 9. Activity of nisin (20 µM) visualized with confocal fluorescence microscopy. (A) GUVs composed of DOPC and NBD-labeled Lipid II before the addition of nisin; (B) GUVs after 2 min of exposure to nisin, showing the beginning of Lipid II segregation process; (C) After 7 min of nisin activity, the clustering of Lipid II into large domains was observed. (D) Adhesion of GUVs in close proximity, after 10 min of
exposure to nisin. 53
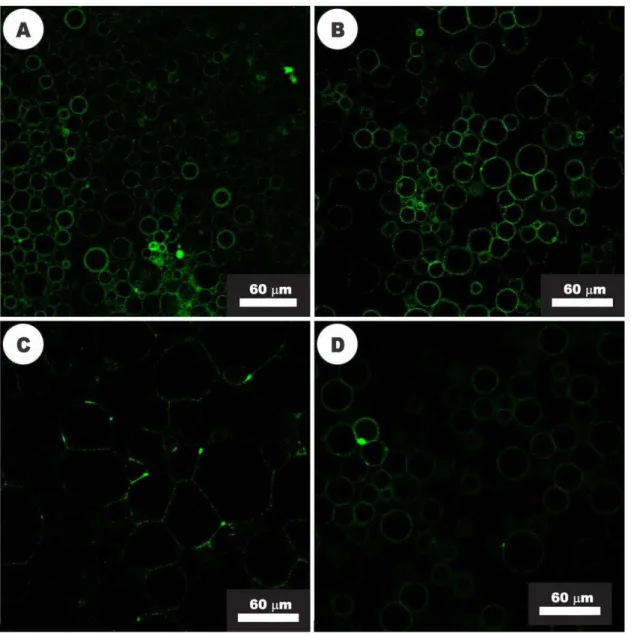
Figure 10. Activity of bovicin HC5 visualized with confocal fluorescence microscopy. (A) GUVs composed of DOPC and NBD-labeled Lipid II before the addition of bovicin HC5; (B) Changing of the common shape of GUVs, after 5 min of exposure to bovicin HC5 (20 µM); (C) After 30 min of bovicin HC5 activity or (D) at higher concentrations of this peptide (40
µM), the segregation of Lipid II into domains was observed. 54
CHAPTER 3
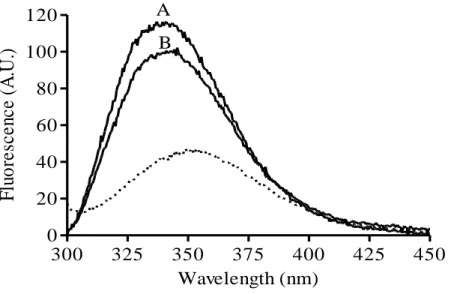
Figure 1. Fluorescence emission spectra of the tryptophan residue of bovicin HC5 in the absence and presence of model membranes. Spectra were recorded for 1 μM bovicin HC5 in the absence (dotted line) and in the presence of model membranes, composed of DOPC (tracing A), or DLPC/DMoPC (tracing B) containing 1 mol % Lipid II. An excitation wavelength of 280 nm was applied, and emission was recorded between 300 and 450 nm. Spectra were corrected by blank subtraction. The vesicle final concentration used was
xii
Figure 2. Lipid II:Bovicin HC5 ratio-dependent change of the bovicin
HC5’s tryptophan fluorescence. Different amounts of DOPC
(filled circles) or DLPC/DMoPC (open squares) vesicles containing 1 mol % Lipid II were added to 1 μM bovicin HC5. Single-wavelength recordings were performed at 340 nm using an excitation wavelength of 280 nm. Fluorescence intensities before (F0) and after addition of Lipid II-containing
membranes (F) were used to calculate F/F0 values, which were
plotted against the Lipid II:Bovicin HC5 ratio. 70
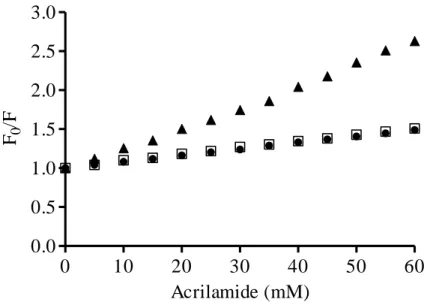
Figure 3. Stern-Volmer plot, showing the acrylamide quenching of
bovicin HC5’s tryptophan residue measured for samples containing 1 μM bovicin HC5 in the absence (filled triangles) and presence of DOPC (filled circles) or DLPC/DMoPC (open
squares) vesicles containing 1 mol % Lipid II (100 μM lipid -Pi). Single-wavelength recordings were performed at 340 nm using an excitation wavelength of 280 nm. F0: Fluorescence
measured in the absence of the quencher; F: Fluorescence
measured in the presence of the quencher. 71
Figure 4. Quenching efficiency of the fluorescence emitted by the tryptophan residue of bovicin HC5 by spin-labeled lipids (TEMPO-PC, 5DOX-PC and 12DOX-PC) incorporated at 25 mol % in DOPC (black bars) or DLPC/DMoPC (white bars) vesicles containing 1 mol % Lipid II. Single-wavelength recordings were performed at 340 nm using an excitation wavelength of 280 nm. The quenching efficiencies were calculated from tryptophan fluorescence in the presence of
xiii
Figure 5. CD spectra of 20 μM bovicin HC5 in solution (10 mM potassium phosphate/40 mM potassium sulphate) and in different pH values (from 2 to 10). The samples were scanned from 195 to 280 nm, at 20 ºC. Each spectrum represents an average of five recordings after subtracting the blank spectrum
from each bovicin HC5 spectrum. 74
Figure 6. CD spectra of bovicin HC5 in the presence of model membranes composed of DOPC (A) or DLPC/DMoPC (B) containing Lipid II. Each spectrum was recorded for bovicin HC5 (20 μM) in buffer at pH 6, and in the presence of 5-30
μM Lipid II. The samples were scanned from 195 to 280 nm, at 20 ºC. Each spectrum was an average of five recordings and blank spectrum (in the absence of bovicin HC5) was
subtracted from each spectrum obtained. 75
Figure 7. CD spectra of bovicin HC5 in the presence of different concentrations of water-soluble Lipid II (3-LII). Each spectrum was recorded for bovicin HC5 (20 μM) in buffer at pH 6 and in the presence of 5-30 µM 3-LII. The samples were scanned at 20 ºC from 195 to 280 nm. Each spectrum was an average of five recordings and blank spectrum (in the absence
of bovicin HC5) was subtracted from each spectrum obtained. 76
Figure 8. CD spectra of bovicin HC5 in the presence of water-soluble Lipid II (3-LII), in different pH values. Each spectrum was recorded in the presence of 20 μM bovicin HC5 and 20 µM 3-LII. The samples were scanned from 195 to 280 nm, at 20 ºC. Each spectrum was an average of five recordings and blank spectrum (in the absence of bovicin HC5) was subtracted from
xiv CHAPTER 4
Figure 1. Gain or loss of body weight in BALB/c mice during the experimental period. The gain/loss of weight is shown as
percentage of the animals’ weight and was calculated
comparing the weight at the end of the experiment (day 58) to the weight at the day of the first immunization (day 0). Each bar represents the mean value from six determinations with the standard deviation (SD). Different letters mean significant difference among treatments (p < 0.05). NC: negative control
group; Bov: bovicin HC5 group; PC: positive control group. 92
Figure 2. -lactoglobulin levels in animal sera from the treatment groups. An intragastrically dose of -LG (20 mg) was administered as a bystander protein to the negative control (NC), bovicin HC5 (Bov) and positive control groups (PC). At the indicated time points following -LG administration, the levels of -LG in mice sera were determined by FPLC. The results show an average of the -LG level detected in four animals of each group. -LG was not detected in all serum
samples from negative control group. 93
Figure 3. Comparison of the number of splenocytes among the groups analyzed ((NC) negative control; (Bov) mice treated with bovicin HC5; (PC) mice treated with ovalbumin). Data were shown as average + SD. Different letters mean significant difference among the groups, according to Dunn’s test (p <
xv
Figure 4. Photomicrographs of histological sections of small intestine of the animal groups studied ((NC), negative control, figures A and D; (Bov) mice treated with bovicin HC5, figures B and E; (PC) positive control, figures C and F). Jejunum segments were collected and processed for optical microscopy analysis at the end of the experiment. The sections were stained with hematoxylin and eosin (HE; right panel) or PAS/Alcian Blue (left panel). Abbreviations: L: lumen; EP: simple cuboidal epithelium; BB: brush border; V: villum; LP: lamina propria; LC: Lieberkühn crypt; Sm: submucosa; IC: inner circular muscle layer; OL: outer longitudinal muscle layer. The asterisks indicate intraepithelial lymphocytes; simple arrow indicates Paneth cells. Black arrow head indicates goblet cells PAS/AB+; red arrow head indicates PAS+ cells.
Right panel – Scale bar: 100 µm; Left panel – Scale bar: 50
µm. 95
Figure 5. Comparison of the number of total goblet cells and mucopolysaccharides secretion among the experimental groups. (A) total number of cells; (B) PAS/AB+ cells; (C) PAS+ cells. Data were shown as average + SD. Different letters mean significant difference among groups, according to
Dunn’s test (p < 0.05). (NC) negative control; (Bov) mice
treated with bovicin HC5; (PC) mice treated with ovalbumin. 97
Figure 6. Size of Paneth cells (A) and number of cells in mitosis (B) at the small intestinal crypts of the experimental groups. Data were shown as average + SD. Different letters mean significant difference among groups, according to Dunn’s test (p < 0.05). (NC) negative control; (Bov) mice treated with bovicin HC5;
xvi
Figure 7. Counts of mast cells in small intestine of the experimental groups. Sections from jejunum segments were stained with toluidine blue/sodium borate (1 %), and the mast cells were counted in the mucosa and submucosa. Data were shown as average + SD. Different letters mean significant difference among groups, according to Dunn’s test (p < 0.05). (NC) negative control; (Bov) mice treated with bovicin HC5; (PC)
mice treated with ovalbumin. 99
Figure 8. Diameter and height of the small intestinal villi at the experimental groups. Data were shown as average + SD. Different letters mean significant difference among groups, according to Dunn’s test (p < 0.05). (NC) negative control; (Bov) mice treated with bovicin HC5; (PC) mice treated with
ovalbumin. 100
Figure 9. Photomicrograph of histological sections of large intestine of the experimental groups ((NC), negative control group, figures A and B; (Bov) Bovicin HC5 group, figure C; (PC) positive control group, figure D). Jejunum segments were collected and processed for optical microscopy analysis at the end of the experiment. The sections were stained with hematoxylin and eosin (HE; figure A) or PAS/Alcian Blue (figures B-D). Abbreviations: EP: simple cuboidal epithelium; LP: lamina propria; MT: mucosal thickness; E: edema; MC: muscle layer. Red arrow head indicates goblet cells.
xvii
Figure 10. Mucosal thickness of the large intestine of the mice at the experimental groups. Data were shown as average + SD. Different letters mean significant difference among groups, according to Dunn’s test (p < 0.05). (NC) negative control; (Bov) mice treated with bovicin HC5; (PC) mice treated with
ovalbumin. 102
Figure 11. Relative cytokine expression in spleen of five-weeks old female BALB/c mice treated with bovicin HC5 and ovalbumin. IL-4 (A), IL-5 (B), IL-13 (C), TNF-α (D), IL-12 (E), IFN- (F), TGF- (G), IL-10 (H) and IL-17 (I) mRNA was quantified by real time-PCR in spleen collected at the end of
the experiment, and calculated by reference to the -actin in each sample, using the threshold cycle (Ct) method. Results represent the mean value ± SD of data from three mice (values
in duplicate), relative to a negative control group. 104
Figure 12. Relative cytokine expression in intestine of five-week old female BALB/c mice treated with bovicin HC5 and ovalbumin. IL-4 (A), IL-5 (B), IL-13 (C), TNF-α (D), IL-12 (E), IFN- (F), TGF- (G), IL-10 (H) and IL-17 (I) mRNA was quantified by real time-PCR in jejunum segments collected at the end of the experiment, and calculated by reference to the -actin in each sample, using the threshold cycle (Ct) method. Results are demonstrated as the mean value ± SD of data from three mice (values in duplicate), relative to a negative control group. *Significant differences between the relative expression in intestine of mice treated with bovicin HC5 (Bov) and
xviii CHAPTER 5
Figure 1. Effect of the oral administration of S. bovis HC5 on percent weight gain of BALB/c mice. The weight of the animals is visualized as percentage of the animals’ weight, which was calculated comparing the weight at the end of the experiment (day 58) to the weight at the day of the first immunization (day 0). Each bar represents the mean value from six determinations with the standard deviation (SD). Different letters mean significant difference among treatments (p < 0.05). (NC) negative control group; (V) mice treated with viable S. bovis HC5 cells; (HK) mice treated with heat-killed S. bovis HC5
cells. 130
Figure 2. -lactoglobulin levels in animal sera from the treatment groups. An intragastrically dose of -LG (20 mg) was administered as a bystander protein to the negative control group and the groups that received S. bovis HC5 (viable and heat-killed cells). At the indicated time points following -LG administration, the levels of -LG in mice sera were determined by FPLC. The results show an average of the -LG level detected in four animals of each group.-LG was not detected in all serum samples from negative control group. (NC) negative control group; (V) mice treated with viable S.
bovis HC5 cells; (HK) mice treated with heat-killed S. bovis
HC5 cells (HK). 131
Figure 3. Number of spleen cells among the experimental groups. Data were shown as average + SD. Different letters mean significance difference among the groups, according to Dunn’s test (p < 0.05). (NC) negative control group; (V) mice treated with viable S. bovis HC5 cells; (HK) mice treated with
xix
Figure 4. Photomicrographs of histological sections of small intestine of the animal groups studied ((NC), negative control group, figures A and D; (V) mice treated with viable S. bovis HC5 cells, figures B and E; (HK) mice treated with heat-killed S.
bovis HC5 cells, figures C and F). Jejunum segments were
collected and processed for optical microscopy analysis at the end of the experiment. The sections were stained with hematoxylin and eosin (HE; right panel) or PAS/Alcian Blue (left panel). Abbreviations: L: lumen; EP: simple cuboidal epithelium; BB: brush border; V: villum; LP: lamina propria; LC: Lieberkühn crypt; E: edema; V: blood vessel; Sm: submucosa; IC: inner circular muscle layer; OL: outer longitudinal muscle layer. The asterisks indicate intraepithelial lymphocytes; simple arrow indicates Paneth cells. Black arrow head indicates goblet cells PAS/AB+; red arrow head indicates PAS+ cells.
Right panel – Scale bar: 100 µm; Left panel – Scale bar: 50
µm. 133
Figure 5. Comparison of the number of total goblet cells and mucin production among the experimental groups. (A) total number of cells; (B) PAS/AB+ cells; (C) PAS+ cells. Data were shown as average + SD. Different letters mean significance difference among groups, according to Dunn’s test (p<0.05). (NC) negative control; (V) mice treated with viable S. bovis HC5 cells; (HK) mice treated with heat-killed S. bovis HC5 cells
xx
Figure 6. Size of Paneth cells (A) and number of cells in mitosis (B) at the small intestinal crypts of the experimental groups. Data were shown as average + SD. Different letters mean significant difference among groups, according to Dunn’s test (p < 0.05). (NC) negative control group; (V) mice treated with viable S.
bovis HC5 cells; (HK) mice treated with heat-killed S. bovis
HC5 cells (HK). 136
Figure 7. Diameter and height of the small intestinal villi at the experimental groups. Data were shown as average + SD. Different letters mean significant difference among groups, according to Dunn’s test (p < 0.05). (NC) negative control group; (V) mice treated with viable S. bovis HC5 cells; (HK)
mice treated with heat-killed S. bovis HC5 cells (HK). 137
Figure 8. Photomicrograph of histological sections of large intestine of the experimental groups studied ((NC), negative control group, figures A and B; (V) mice treated with viable S. bovis HC5 cells, figure C; (HK) mice treated with heat-killed S. bovis HC5 cells, figure D). Jejunum segments were collected and processed for optical microscopy analysis at the end of the experiment. The sections were stained with hematoxylin and eosin (HE; figure A) or PAS/Alcian Blue (figures B-D). Abbreviations: EP: simple cuboidal epithelium; LP: lamina propria; MT: mucosal thickness; E: edema; MC: muscle layer. Red arrow head indicates goblet cells. Scale bar = 200 (figure
A) or 100 µm (figures B, C and D). 139
Figure 9. Mucosal thickness of the large intestine of the mice at the experimental groups. Data were shown as average + SD. Different letters mean significant difference among groups, according to Dunn’s test (p < 0.05). (NC) negative control group; (V) mice treated with viable S. bovis HC5 cells; (HK)
xxi
Figure 10. Cytokine production (IL-4, IL-5, IL-13, TNF-α, IL-12, IFN- , TGF- , IL-10, IL-17) in small intestine of five-weeks old female BALB/c mice that received S. bovis HC5 cells. Segments of jejunum were collected on day 58 of the experiment and mRNA was extracted. The relative expression of the interleukin genes determined by real time-PCR was
calculated in reference to the -actin in each sample. Results are shown as the mean value ± SD of data from three mice (values in duplicate), relative to a negative control group. *Significant differences between the relative expression on spleen from mice treated with viable S. bovis HC5 cells (V) and treated with heat-killed S. bovis HC5 cells (HK), at p <
0.05. 142
Figure 11. Cytokine production (IL-4, IL-5, IL-13, TNF-α, IL-12, IFN- , TGF- , IL-10, IL-17) in spleen of five-weeks old female BALB/c mice that received S. bovis HC5 cells. Spleen was collected on day 58 of the experiment and mRNA was extracted. The relative expression of the interleukin genes determined by real time-PCR was calculated in reference to
the -actin in each sample. Results are shown as the mean value ± SD of data from three mice (values in duplicate), relative to a negative control group. *Significant differences between the relative expression on spleen from mice treated with viable S. bovis HC5 cells (V) and treated with heat-killed
xxii
LIST OF TABLES
CHAPTER 4
Table 1. Sequences of sense (S) and antisense (AS) primers used for
real time-PCR analysis. 90
CHAPTER 5
Table 2. Sequences of sense (S) and antisense (AS) primers used for real time-PCR analysis.
xxiii
LIST OF ABBREVIATIONS
NRP = nonribosomal-synthesized peptide AMP = ribosomal-synthesized peptide LPS = lipopolysaccharide
PG = phosphatidylglycerol PS = phosphatidylserine CL = cardiolipin
BLIS = bacteriocin-like inhibitory substance
VRE = vancomycin resistant enterococci
MRSA = methicillin-resistant Staphylococcus aureus Ser = serine
Thr = threonines Trp = tryptophan Dha = dehydroalanine Dhb = dehydrobutyrine LAB = lactic acid bacteria
GRAS = generally recognized as safe GlcNAc = N-acetylglucosamine acid MurNAc = N-acetylmuramic acid IL = interleukin
DOPC = 1,2-dioleoyl-sn-glycero-3-phosphocoline DOPG = 1,2-dioleoyl-sn-glycero-3-phosphoglycerol DMoPC = 1,2-dimyristoleoyl-sn-glycero-3-phosphocoline DLPC = 1,2-dilauroyl-sn-glycero-3-phosphocoline
xxiv
HPTS = 8-hydroxypyrene-1,3,6-trisulfonic acid trisodium salt TFA = trifluoroacetic acid
RP-HPLC = reverse-phase high-performance liquid chromatography MIC = minimum inhibitory concentrations
Mg = magnesium OD= optical density
HEPES = 4-(2-hydroxyethyl)-1-piperazineethanesulfonic acid DiSC2(5) = 3,3'-diethylthiadicarbocyanine iodide
LUVs = large unilamellar vesicles
MES = 2-(N-morpholino)ethanesulfonic acid ITC = isothermal titration calorimetry
Ka = apparent binding constant GUVs = giant unilamellar vesicles NBD = nitrobenzoxadiazole
E/M = monomer and excimer signal ratio
TEMPO-PC = 1,2-dioleoyl-sn-glycero-3-TEMPO-phosphocoline
5DOX-PC = 1-palmitoyl-2-stearoyl(5-DOXYL)-sn-glycero-3-phosphocoline 12DOX-PC = 1-palmitoyl-2-stearoyl(12-DOXYL)-sn-glycero-3-phosphocoline 3-LII = water-soluble Lipid II
CD = circular dichroism
KSV = Stern-Volmer quenching constant
Qef = quenching efficiency
A.U. = arbitrary units.
-LG = -lactoglobulin
FPLC = fast protein liquid chromatography HE = hematoxylin and eosin
AB = Alcian Blue
PAS = periodic acid-Schiff
real-time PCR = real-time polymerase chain reaction cDNA = complementary DNA
mRNA = messenger RNA Ct = cycle threshold method S = sense primer
AS = antisense primer
xxv NC = negative control group
Bov = bovicin HC5 group PC = positive control group. OVA = ovalbumin
SD = standard deviation L = lumen
EP = simple cuboidal epithelium BB = brush border
V = villum
LP = lamina propria LC = Lieberkühn crypt E = edema
V = blood vessel Sm = submucosa MC = muscle layer
IC = inner circular muscle layer OL = outer longitudinal muscle layer MT = mucosal thickness
TH1 = helper T lymphocytes subgroup 1
TH2 = helper T lymphocytes subgroup 2
Treg = regulator T lymphocytes IgA = immunoglobulin A IgE = immunoglobulin A CFU = colony-forming units
V = mice treated with viable S. bovis HC5 cells HK = mice treated with heat-killed S. bovis HC5 cells. PAMP = pathogen-associated molecular pattern PRR = pattern-recognition receptor
TLR = toll-like receptor
GALT = gut associated lymphoid tissue APC = antigen-presenting cell
xxvi RESUMO
PAIVA, Aline Dias, D.Sc. Universidade Federal de Viçosa, julho de 2011. Mecanismo de ação e efeitos imunoestimulatórios de bovicina HC5, uma bacteriocina produzida por Streptococcus bovis HC5. Orientador: Hilário Cuquetto Mantovani. Coorientadores: Sérgio Oliveira de Paula e Maria Cristina Baracat Pereira.
xxvii
Lipídeo II, um importante precursor da síntese da parede celular em bactérias, é utilizado como alvo específico de bovicina HC5 em células bacterianas sensíveis. A atividade de formação de poros de bovicina HC5 foi claramente dependente da espessura da membrana e pode ser detectada somente em membranas finas. Bovicina HC5 foi capaz de recrutar moléculas de Lipídeo II em estruturas semelhantes a poros, e de sequestrar moléculas de Lipídeo II em domínios, inibindo a síntese da parede celular bacteriana. Em seguida, a interação entre bovicina HC5 e Lipídeo II foi examinada utilizando espectroscopia de fluorescência do triptofano e dicroísmo circular. A presença de Lipídeo II alterou a orientação de bovicina HC5 em membranas lipídicas, de paralelo para perpendicular em relação à superfície da membrana, e a estrutura secundária de bovicina HC5 foi também significativamente alterada após interação com Lipídeo II. A interação de bovicina HC5 com Lipídeo II foi altamente estável, ocorrendo mesmo em pH 2,0. De acordo com esses resultados, bovicina HC5 possui mecanismo de ação semelhante ao da nisina, embora algumas diferenças em relação à capacidade de formação de poros e interação com Lipídeo II tenham sido demonstradas. Os efeitos da administração oral de bovicina HC5 e S. bovis HC5 (células viáveis e mortas após tratamento térmico) a sistemas modelos animais foram também avaliados. A administração oral de bovicina HC5 por 58 dias a camundongos BALB/c resultou em reduzido ganho de peso e alterações no intestino delgado, embora nenhuma mudança fisiológica tenha sido detectada no intestino. Um aumento da expressão relativa de TGF- , INF- e IL-12 no intestino delgado foi observado após administração de bovicina HC5. Importantes alterações histológicas e morfométricas foram detectadas no intestino dos animais tratados com S. bovis HC5. A produção de citocinas no intestino também foi alterada após administração oral de S. bovis HC5, e o padrão de expressão de citocinas diferiu entre células vivas e mortas após tratamento térmico. Um aumento na expressão relativa de IL-12 e INF- foi observado em animais que receberam células viáveis de S. bovis HC5, enquanto um aumento na expressão relativa de IL-5, IL-13 e TNF-α foi detectado em animais tratados com células de S. bovis HC5 mortas após tratamento térmico. Esses resultados indicam que a administração oral de bovicina HC5 causou alterações morfológicas no intestino delgado de camundongos BALB/c, sendo capaz de estimular o sistema imune em nível local. A administração oral de S. bovis HC5 resultou em alterações histológicas e morfométricas no intestino, havendo diferenças distintas na atividade imunoestimulatória de células vivas e mortas de S.
xxviii ABSTRACT
PAIVA, Aline Dias, D.Sc. Universidade Federal de Viçosa, July, 2011. Mode of action and immunostimulatory effects of bovicin HC5, a bacteriocin produced by Streptococcus bovis HC5. Advisor: Hilário Cuquetto Mantovani. Co-Advisors: Sérgio Oliveira de Paula and Maria Cristina Baracat-Pereira.
Bovicin HC5 is a Type A lantibiotic produced by Streptococcus bovis HC5, an anaerobic gram-positive bacterium isolated from the bovine rumen. Bovicin HC5 is a positively charged amphiphilic peptide of 2449 Da, with a broad spectrum of activity, and contains a similar pattern of lanthionine rings found in nisin, the most well known bacteriocin. Previous results indicated that bovicin HC5 promotes the release of intracellular potassium and the depletion of intracellular ATP from target cells, and this activity is enhanced in acidic pH. However, the antimicrobial activity of bovicin HC5 persists even at more alkaline pH values, which suggests that bovicin HC5 could have another mechanism of action besides the depletion of potassium and ATP. Even though bovicin HC5 has been characterized as an effective and broad-spectrum bacteriocin, the safety for application in vivo is still limited by the lack of information regarding the mechanism of action and immunostimulatory effects of bovicin HC5. Moreover, although bovine S. bovis strains are genetically and physiologically distinct from pathogenic isolates implicated in human infections, the effects of the administration of
S. bovis HC5 to animal models are yet to be studied. In this work, we elucidated the
xxix
membrane thickness, and could be detected only in thin membranes. Bovicin HC5 was able to recruit Lipid II molecules as a pore-like structure and sequestered Lipid II into domains, inhibiting the bacterial cell wall biosynthesis. The interaction between bovicin HC5 and Lipid II was further examined using tryptophan fluorescence and circular dichroism spectroscopy. The presence of Lipid II changed the orientation of bovicin HC5 in lipid membranes from parallel to perpendicular with respect to the membrane surface, and the secondary structure of bovicin HC5 was significantly changed upon binding to Lipid II. The interaction of bovicin HC5 with Lipid II was highly stable, occurring even at pH 2.0. According to these results, bovicin HC5 has a primary mode of action similar to nisin, although some differences regarding the pore formation and interaction with Lipid II were demonstrated. The effects of the oral administration of bovicin HC5 and S. bovis HC5 (viable and heat-killed cells) to an animal model system were also evaluated. The oral administration of bovicin HC5 for 58 days to BALB/c mice resulted in low weight gain and some impairment of small intestine, although no physiological changes have been detected in small intestine. An increase of TGF- , INF- and IL-12 relative expression in the small intestine occurred upon administration of bovicin HC5. Regarding the effects caused by S. bovis HC5, important histological and morphometric alterations were observed in the intestine of the treated animals. The cytokine production was altered in the intestine after oral administration of S. bovis HC5 and differed between live and heat-killed cells. An increase in the relative expression of IL-12 and INF- was observed in animals that received viable S. bovis
1 CHAPTER 1
Literature Review
1.1. Introduction
Small biological molecules (<10 kDa), including nonribosomal-synthesized peptides (NRPs) and ribosomal-synthesized peptides (AMPs), play an important role in the innate immune response against microbial infections, thus ensuring first-line defenses to many species, from plants to animals. AMPs are a diverse group of molecules and include plant thionins and defensins, insect defensins and cecropins, amphibian magainins and temporins, defensins and cathelicidins from higher vertebrates, as well as fungal defensin-like peptides, cyanobactins and bacteriocins (Hancock and Sahl, 2006). Most of the AMPs share common biophysical properties that appear to be important to antimicrobial activity, such as cationicity, amphipathicity and hydrophobicity (Yount et al., 2006; Sang and Blecha, 2008).
2
greater) membrane potential (Δψ) across the bacterial membranes compared to most
eukaryotic cells (Hancock and Rozek, 2002).
The amphipatic structure, with clusters of hydrophobic and hydrophilic residues within the tertiary structure of the peptide, correlates with antimicrobial efficacy and peptide toxicity, and most antimicrobial peptides are inherently amphipathic or become amphipathic in anisotropic environments (Yount et al., 2006). The proportion of hydrophobic residues in antimicrobial peptides is around 50 %, a feature that is important for antimicrobial activity as it governs the extent to which the peptide may partition into lipid bilayers. Although hydrophobicity and amphipathicity are required for effective permeabilization of the bacterial membrane, optimal balance between these two characteristics is essential to peptide activity, since highly amphipathic or hydrophobic molecules also tend to disrupt mammalian cells (Zelezetsky et al., 2005).
Antimicrobial peptides produced by micro-organisms have been a popular topic of research and many ribosomal- and nonribosomal-synthesized peptides have been reported over the years (Pavlova and Severinov, 2006; Sang and Blecha, 2008). The peptides ribosomally synthesized by species of Bacteria and certain strains of the Archaea domain are named bacteriocins. Bacteriocins are active even in small concentrations, exhibit bactericidal or bacteriostatic activity, and are active against both human and veterinary pathogens, being potentially useful for the food industry and for medical and veterinary applications (Cleveland et al., 2001; Drosinos et al., 2006).
Bacteriocins differ in size, microbial target, mode of action, secretion and
immunity mechanisms. Several uncharacterized substances produced by bacteria and
with bacteriocin-like activity have also been identified and are referred to as
bacteriocin-like inhibitory substances (BLIS) (Tagg and Ragland, 1991).
Bacteriocins serve to effectively inhibit competing micro-organisms in natural habitats, conferring ecological advantages in complex bacterial communities (Balakrishnan et al., 2002). Alternatively, bacteriocins are used to influence the dynamics of bacterial populations, to inhibit the invasion of other strains or to cause the death of neighboring cells, ensuring the survival and perpetuation of the bacteriocin producing cells (Burkard et al., 2007). Additional roles have been proposed for gram-positive bacteriocins, mediating quorum sensing (Gobbetti et al., 2007) and acting as communication signals in bacterial consortia, such as biofilms (Gillor, 2007).
micro-3
organisms, such as Listeria monocytogenes, Bacillus cereus, Staphylococcus aureus and
Clostridium tyrobutyricum (Cotter et al., 2005; Gálvez et al., 2008). In general, the
main mechanisms of action for bacteriocins are pore formation in the target cell membrane, inhibition of cell wall synthesis and inhibition of enzyme activities (RNAse or DNAse) (Cleveland et al., 2001).
Bacteriocins produced by gram-positive bacteria differ from those synthesized by gram-negative bacteria in ecological and evolutionary aspects. In gram-positive bacteria, the biosynthesis of bacteriocins is self-regulated and it is not a lethal event. The spectrum of antimicrobial activity is broader, the release of the peptide is controlled by specific regulatory mechanisms and the clusters of genes are generally in the chromosome, encoding proteins with structural roles and proteins involved in post-translational modifications, regulation, immunity and transport through the membrane. In gram-negative bacteria, the production of bacteriocins is a lethal event that involves cell lysis and the release of the peptide is controlled by common regulatory mechanisms, such as the SOS regulon (Riley and Wertz, 2002).
1.2. Bacteriocins produced by gram-positive bacteria
Gram-positive bacteria produce bacteriocins that are as abundant as and even
more diverse than those produced by gram-negative bacteria. It has been reported that bacteriocins from gram-positive bacteria only kill other gram-positive bacteria (with varied spectrum of activity) and have little inhibitory activity toward gram-negative bacteria, fungi or virus (Klaenhammer, 1993; Riley and Wertz, 2002).
However, some bacteriocins also inhibit certain gram-negative bacteria, including Klebsiella pneumoniae, Pseudomonas spp., and Campylobacter jejuni (Todorov and Dicks, 2006). These bacteriocins include bifidin I, produced by
Bifidobacterium infantis BCRC 14602; thermophilin 81, produced by Streptococcus
thermophilus; plantaricin 35 d, produced by Lactobacillus plantarum; lacticin NK24,
produced by Lactococcus lactis NK24; and bacteriocin AMA-K, produced by
Lactobacillus plantarum AMA-K (Ivanova et al., 1998; Messi et al., 2001; Todorov,
2009; Cheikhyoussef et al., 2009).
Bacteriocins with potent activity against antibiotic-resistant bacterial strains, such as vancomycin resistant enterococci (VRE) and methicillin-resistant
Staphylococcus aureus (MRSA) have also been reported (Sit and Vederas, 2008).
4
Absidia spp., Aspergillus niger, Epicoccum nigrum and Penicillium sp. (Todorov,
2010). Studies about the bioactivity of bacteriocins against virus are still scarce, but some of them have been recently characterized as potent antiviral peptides, such as bacteriocin ST5Ha, a pediocin-like bacteriocin produced by Enterococcus faecium, that is active against herpes simplex virus type 1 strain F, an important human pathogen (Todorov et al., 2010).
Some species of bacteriocin-producing gram-positive bacteria are pathogenic, including Listeria monocytogenes, Enterococcus sp. and Clostridium perfringens (Rood and Cole, 1991). For these bacteria, bacteriocin loci are found in association with IS sequences or near cell wall-associated serine protease genes. According to Dupuy et al. (2006), it is possible that some common molecular mechanism is involved in the regulation of synthesis of toxins and bacteriocins, such as sigma factors in Clostridium (sigma factors are sequence-specific, DNA-binding subunits of RNA polymerase, that ensure the recognition of appropriate promoter sites (Helmann and Moran, 2002)).
The genes coding for bacteriocin production are mostly organized in operon clusters, which can be localized in the chromosome or in mobile elements (e.g. plasmids and transposable elements). Gene expression is often coordinated, and the operons harbor genes for biosynthesis, regulation, self-immunity, and secretion (Klaenhammer, 1993; Rossi et al., 2008).
Like other ribosomally derived antibiotic scaffolds, the bacteriocins produced by gram-positive bacteria are initially synthesized as biologically inactive precursor peptides; the N-terminal leader sequences are cleaved by proteases to yield the active peptide. The leader peptide is an essential recognition element for the post-translational tailoring enzymes and is also necessary for immunity and export signaling (Nolan and Walsh, 2009). Additionally, gram-positive bacteria have protective mechanisms against self-produced bacteriocins. Immunity is achieved by specific immunity proteins and/or by regulatory proteins that control bacteriocin synthesis or transport (Willey and van der Donk, 2007; Draper et al., 2008).
5
Usually, the production of bacteriocins by gram-positive bacteria shows secondary metabolite kinetics and its activity is detected at the end of exponential phase and early stationary phase of growth (Todorov, 2010). Normally, the bacteriocin title decreases at the stationary phase and continues to decrease with prolonged incubation, probably due to proteolytic degradation, protein aggregation, adsorption to the cell-surface or feedback regulation (Ondaa et al., 2003; Todorov, 2010). For some strains, bacteriocin production appears to be temperature dependent, and according to Dufour et al. (2007), the regulation of bacteriocin expression is not cell cycle dependent, per se, but is influenced by the density of the cell culture.
Some bacteriocins are stable in the range of pH 2.0 to 8.0, suggesting that activity might not be affected by changes in pH during growth. However, constant changes in medium pH and composition may lead to changes in activity levels of bacteriocins. Not all bacteriocins are heat-stable, but thermostability at 100 ºC has been reported for some peptides and may be explained by their low molecular mass or by differences in peptide structure (Todorov, 2010).
Many factors influence the efficacy of bacteriocins towards target cell. Such factors include the 1) structure and concentration of bacteriocins; 2) the physiological status and cell wall structure of the target cells; 3) the composition and membrane potential of the target cell; 4) the presence of specific proteases at or nearby the target cells envelope; 5) the chemical composition of the environment; 6) the amount of target cells and/or planktonic cells able to adsorb the bacteriocin and 7) the absence or the presence of mutations in some cellular components, as the specific receptors for bacteriocins (Eijsink et al., 2002).
Based on their primary structure, molecular mass, heat stability and functional similarity, bacteriocins produced by gram-positive bacteria can be classified in four major groups (Cotter et al., 2005):
6
which lantibiotics derive their name (Pag and Sahl, 2002). In some cases, one enzyme (bi-functional LanM modifying enzymes) carries out both dehydration and cyclization steps (Xie et al., 2004). The thioether linkages are stable to hydrolysis and are also critical for lantibiotic physiological function (van Kraaij
et al., 2000).
- Class II, or non-lanthionine-containing bacteriocins, or non-lantibiotics: includes small (< 10 kDa) membrane-active peptides, with limited or no extensive post-translational modifications. Non-lantibiotics are still divided into three subgroups: Class IIa is composed by pediocin-like anti-Listeria peptides, with their conserved disulfide bond and N-terminus characterized by a consensus YGNGVXC motif (this consensus region may cause the bactericidal effect directly, and is considered to be involved in the action against Listeria strains; however, many other bacteriocins that lack this structural homology with class IIa peptides are still active against Listeria monocytogenes); Class IIb bacteriocins require a combination of two polypeptides for full antimicrobial activity (e.g. enterocin L50), while class IIc are other bacteriocins (e.g. acidocin B); Class IId has been proposed by Gray et al. (2006a) and consists of bacteriocins that are sec-dependent, such as thuricin 17 (Gray et al., 2006b) and bacthuricin F4 (Kamoun et al., 2005).
- Class III, or bacteriolysins: comprises large, heat-labile proteins (> 30 kDa) that catalyze the hydrolysis of bacterial cell walls resulting in autolysis of targeted bacteria (e.g. helveticin J and lactacin B) (Drider et al., 2006; Dobson et
al, 2007).
- Class IV: an additional proposed class, which comprises complex bacteriocins that requires lipid or carbohydrate moieties for activity. Little is known about the
structure and function of this class (e.g. leuconocin S and lactocin 27)
(Vermeiren et al., 2006).
7
while type B lantibiotics includes the rigid and globular peptides, that act by inhibition of enzymes (e.g. mersacidin and actagardine, duramycin and its analogues, cinnamycin and ancovenin).
As already mentioned, the gene clusters possess either two (LanB, LanC) or one (LanM) modification enzyme, and this difference on biosynthetic pathway was used to propose a new classification scheme: class I lantibiotics, which are modified by LanB and LanC (nisin and epidermin); class II lantibiotics, bacteriocins with a GG cleavage site in their leader peptide and that are modified by LanM enzymes (lacticin and its analogous, several two-peptide lantibiotics); class III lantibiotics, peptides that have no or little antibacterial action and perform other functions, often related to morphogenesis (SapT, SapB and their orthologues) (Willey and van der Donk, 2007).
Recently, Goto et al. (2010) reported the discovery of a new family of lanthionine synthetases, termed LanL, in the mycelial soil bacterium Streptomyces
venezuelae. Moreover, they have shown that putative lantibiotic biosynthetic gene
clusters are widespread in nature and not restricted to gram-positive bacteria, as long believed, being found in gram-negative bacteria, such as the proteobacterium
Myxococcus xanthus, and in cyanobacteria, such as Nostoc punctiforme and
Prochlorococcus.
Nevertheless, many lantibiotic-like gene clusters direct the production of peptides that do not have antibiotic activity, but that may have other, often unknown, functions as signaling molecules or morphogenetic peptides (Lia et al., 2010). Goto and co-workers (2010) suggested the name lanthipeptides for lanthionine-containing peptides that are related to lantibiotics by structure and biosynthetic routes, but that do not have any antimicrobial activity.
Among the bacteriocins produced by gram-positive bacteria, the most promising for practical applications are those produced by lactic acid bacteria (LAB). Several genera of LAB have been described as bacteriocin producing bacteria, including
Lactobacillus, Lactococcus, Enterococcus, Streptococcus, Pediococcus, Leuconostoc
and Bifidobacterium. Strains showing antimicrobial activity against different target bacteria have been isolated from different food matrices such as fermented dairy products, vegetables, fruits, meat and fish and also from the human and animal gastrointestinal tract (Todorov et al., 2010).
8
is a small (3.5 kDa), 34 amino acid, cationic, hydrophobic peptide with five characteristic (beta-methyl) lanthionine rings. It affects primarily vegetative cells and prevents the outgrowth of spores of gram-positive bacteria. Until now, five natural nisin variants (A, Z, Q, U, and F) have been identified (de Kwaadsteniet et al., 2008) and nisin provides a paradigm for studies of lantibiotic structure, biosynthesis and mode of action of antimicrobial peptides (Nolan and Walsh, 2009).
Micro-organisms susceptible to nisin include strains of lactic acid bacteria,
Bacillus, Clostridium, Staphylococcus, Listeria and Streptococcus genera (Cleveland et
al., 2001), Actinomyces, Corynebacterium, Gardnerella, Mycobacterium,
Campylobacter, Haemophilus, Helicobacter, and Neisseria. In order to increase the antimicrobial activity against gram-negative bacteria, yeasts, or moulds, nisin is often used in combination with other synergistic preservation methods, including pH reduction and addition of salt in high concentration (Rayman et al., 1983), preheating of the product (Boziaris et al., 1998), addition of chelating agents (e.g. EDTA) (Branen and Davidson, 2004) and detergents (e.g. Tween 80) (Joerger, 2003).
In 1969, nisin received international acceptance as food additive by the Codex Alimentarius Commision (JECFA, 1969). In 1988, the US Food and Drug Administration conferred GRAS (Generally Recognized As Safe) status to nisin for use in certain food applications (FDA, 1988). The Science Committee on Food evaluated the safety of nisin in 1990 and allocated its safety intake in 0.13 mg/kg body weight/day (SCF, 1992). In 1995, nisin (code E234) was authorized for food preservation in the European Union by Directive 95/2/EC on food additives other than colours and sweeteners. In 2001, FDA affirmed nisin as GRAS for use as an anti-microbial agent on cooked meat and poultry products when used at a maximum level of 250 ppm of nisin in the finished products (FDA, 2001).
So far, nisin is the only bacteriocin approved for use in over 50 countries as food preservative, including USA, European Union, Australia and New Zealand (Delves-Broughton, 2005). Nisin has been used in dairy products, canned foods (vegetables, soups), hot baked products (crumpets) and pasteurized liquid eggs (Delves-Broughton et
al., 1996). The approval of nisin for food usage is a logical consequence of the fact that
nisin is produced by L. lactis, a food grade lactic acid bacterium that has a long history of use as a component of starter cultures in dairy industry.
9
of human flora-associated rats is not affected after consumption of nisin (Bernbom et
al., 2006), suggesting that ingested nisin is completely digested to amino acids prior to
absorption. According to Reddy et al. (2004), nisin does not possess any subchronic or chronic toxicity, reproductive/developmental toxicity, genotoxicity and carcinogenicity, and can be safely used.
Nisin is not the only bacteriocin produced by L. lactis. Other lantibiotics produced by the same genera include the single peptide lacticin 481 and the two-component system lacticin 3147 (de Vuyst and Leroy, 2007). Non-lantibiotic bacteriocins from L. lactis include: pediocin-like bacteriocins (class IIa) such as lactococcin MMFII; two-peptide component bacteriocins (class IIb) such as lactococcin G and M; thiol-activated bacteriocins (class IIc) such as lactococcin B; and heat-labile, lactococcus-specific bacteriocins (class IId) such as lactococcin A (diplococcin) and lactococcin 972 (Oppegard et al., 2007).
1.3. Mode of action of bacteriocins produced by gram-positive bacteria
In general, type A lantibiotics are active in the nanomolar concentration range and kill bacteria by permeabilizing the plasma membrane, leading to the collapse of ion gradients across the cell membrane. Efficient permeabilization is the result of pore formation, using a specific receptor. The pore formation process of type A lantibiotics has been studied in detail using various physiological and artificial membrane system.
The bacteriocin nisin has at least five different antimicrobial activities based on both high-affinity targets and low-affinity membrane interactions. These multiple activities result in the high potential of nisin towards sensitive cells. In model membranes systems, micromolar concentrations of nisin are usually required to cause perturbation effects. In contrast, many gram-positive bacteria have MIC values in the nanomolar concentration range (Pag and Sahl, 2002).
An explanation for this discrepancy was provided when Lipid II, a hydrophobic carrier for peptidoglycan monomers, was identified as a high-affinity receptor that enabled pore formation at nanomolar concentrations of nisin (Brötz et al. 1998; Breukink et al., 1999). The binding to Lipid II promotes two bactericidal activities, pore formation and inhibition of peptidoglycan biosynthesis (Breukink et al., 1999).
10
disaccharide N-acetylglucosamine (GlcNAc) and N-acetylmuramic acid (MurNAc) to which a pentapeptide is attached. This unit is assembled on the cytosolic side of the membrane on a very long bactoprenol hydrocarbon chain via a pyrophosphate linker. The enzymes MraY and MurG catalyze the final assembly steps, resulting in the formation of Lipid II.
11
Figure 1: Cell wall assembly. (A) The cell wall biosynthesis starts on the cytosolic side of the bacterial plasma membrane. UDP-activated precursor sugars are assembled on a polyisoprenoid carrier and the coupling of which molecule produces Lipid II; Lipid II is transported across the membrane and peptidoglycan subunits are transferred to the growing peptidoglycan chain; the polyisoprenoid carrier is recycled back to the cytoplasmic side and the cycle is completed. (B) Lipid II structure, showing the polyisoprenoid anchor (eight cis-conformation isoprene units, two units in the trans-conformation and the terminal isoprene unit) and the pentapeptide. Red bars indicate the minimal binding sites in Lipid II of glycopeptide antibiotics (1), nisin (2), ramoplanin (3) and mersacidin (4). GlcNAc, N-acetylglucosamine; MurNAc, N-acetylmuramic acid (Breukink and de Kruijff, 2006).
Lipid II moderates insertion of nisin into the bacterial membrane, which is followed by pore formation (van Heusden et al., 2002). Structure-function studies identified that the interaction between nisin and Lipid II starts specifically with the high affinity binding of the N-terminal double-ring system of nisin to the hydrophilic headgroup (pyrophosphate) of the cell wall precursor, via direct hydrogen bonding with the polypeptide backbone. The N-terminus of nisin interacts with Lipid II and its C-terminus inserts into the membrane (Hsu et al., 2002). The interaction between initially formed nisin-Lipid II complexes in the membrane results in the formation of complexes that consist of several nisin and Lipid II molecules, which assemble further into larger
A B
12
complexes; the conversion of the large complexes into a pore requires the cooperative insertion of the nisin molecules into the lipid bilayer. The resulting nisin-Lipid II pore was supposed to contain eight nisin and four Lipid II molecules (Hasper et al., 2004) (Figure 2).
The solution structure of the Lipid II-nisin complex was found to form a binding cage for the pyrophosphate linkage group of Lipid II; obviously, undecaprenylpyrophosphate, when released after transglycosylation, can also be bound (Hsu et al., 2004).
Figure 2: Nisin-Lipid II interaction. (A) Nisin reaches the bacterial membrane; (B)
Nisin’s N-terminal binds to the hydrophilic headgroup of Lipid II, with high affinity; (C) The pore formation starts, and nisin adopts a transmembrane orientation; (D) During or after assembly of four 1:1 (nisin:Lipid II) complexes, four additional nisin molecules are recruited and the final pore complex is formed (Breukink and de Kruijff, 2006).
Non-pore forming variants of nisin and other lantibiotics, such as mutacin 1140, bind with high affinity to Lipid II, but they kill bacteria without permeabilizing the membrane. This activity demonstrates that the lantibiotics have another Lipid II-mediated mechanism of cell killing. This mechanism was uncovered via fluorescence microscopy techniques, which revealed that lantibiotics that bind to Lipid II cluster the target molecules into patches when added to phospholipid bilayers, containing small amounts of Lipid II (Hasper et al., 2006; de Kruijff et al., 2008).
Since Lipid II is predominantly located into regions of the plasma membrane related to cell elongation and division, this mechanism of Lipid II abduction out of its
A B C
D
A B C
13
functional location leads to the inhibition of the bacterial cell wall synthesis, blocking the incorporation of murein precursor units into the cell wall (Hasper et al., 2006). The Lipid II binding and sequestration can be considered the primary mode of action for type A lantibiotics (Hasper et al., 2006;).
Furthermore, Lipid II-independent mechanisms of action have been described. Nisin can impair the integrity of microbial membranes at micromolar concentrations (Breukink et al., 1999) or displace cationic autolytic enzymes from their anionic binding sites in the gram-positive cell wall, resulting in premature lysis of nascent cell-wall septa (Bierbaum and Sahl, 1985). Nisin can also promote the release of enzymes, such as N-acetylmuramoyl-L-alanin amidase and N-acetyilglucosaminidase (Héchard and Sahl, 2002). Nisin also inhibits the outgrowth of bacterial spores without specific molecular target: in the presence of nisin, the spores lose their heat resistance and become hydrated, but nisin does not inhibit germination initiation, acting immediately after the initiation of germinating process by preventing the establishment of oxidative metabolism or membrane potential in germinating spores (Gut et al., 2008).
Type B lantibiotics can increase membrane permeability on target cells, cause protein translocation and ATP-dependent calcium uptake (as described to cinnamycin (Chen and Tai, 1987)), inhibit peptidoglycan synthesis at the transglycosylation level by forming a complex with the membrane-bound lipid II (mersacidin and actagardin (Brötz
et al., 1998)), and also inhibit the bacterial phospholipase A2 (duramycin-C (Héchard
and Sahl, 2002)). Lacticin 3147, a two-component type B lantibiotic, requires the presence of both components to exert its maximal antimicrobial activity: one of the peptides, that resembles type B lantibiotic mersacidin, acts by inhibiting cell wall synthesis, while the other peptide, more similar to the type A lantibiotic, is responsible for pore formation via interaction with Lipid II molecule (Wiedemann et al., 2001; Wiedemann et al., 2006).