FUNDAÇÃO GETULIO VARGAS ESCOLA DE ECONOMIA DE SÃO PAULO
THIAGO DE LUCENA COELHO
A NEW PLAYING FIELD: RETROSPECTIVE VOTING AND
SOCCER IN BRAZIL
THIAGO DE LUCENA COELHO
A NEW PLAYING FIELD: RETROSPECTIVE VOTING AND
SOCCER IN BRAZIL
Dissertação apresentada à Escola de Economia de São Paulo da Fundação Getulio Vargas como requisito para obtenção do título de Mestre em Economia
Campo de Conhecimento: Econometria Aplicada
Orientador: Prof. PhD. Sergio Pi-nheiro Firpo
THIAGO DE LUCENA COELHO
RETROSPECTIVE VOTING AND SOCCER IN BRAZIL
Dissertação apresentada à Escola de Economia de São Paulo da Fundação Getulio Vargas como requisito para obtenção do título de Mestre em Economia
Campo de Conhecimento: Econometria Aplicada
Orientador: Prof. PhD. Sergio Pi-nheiro Firpo
Data de Aprovação:
/ /
Banca examinadora:
Prof. PhD. Sergio Pinheiro Firpo (Orientador)
FGV-EESP
Prof. PhD. Vladimir Ponczek FGV-EESP
"Valeu a pena? Tudo vale a pena Se a alma não é pequena.
Quem quer passar além do Bojador Tem que passar além da dor."
Agradecimentos
Gostaria de agradecer primeiramente a minha mãe e ao meu pai por todo amor, carinho e por muitas vezes renunciarem seus desejos pessoais para que eu pudesse obter todo o suporte necessário. Sem eles esse trabalho não seria possível. Gostaria de agradecer também ao meu irmão, Fabio, à minha namorada, Gaia, e minha Dinda, Eliane, por todo o carinho e ajuda. Gostaria de agradecer ao meu orientador, Sergio Firpo, não só pela orientação, mas pela inspiração nos momentos difíceis e por ser um exemplo de pessoa dentro e fora de sala de aula. Gostaria de agradecer também ao Sergio Silva por toda confiança depositada em mim e em minha família. Como já havia mencionado, "O carater de um homem pode ser facilmente julgado pelo o que ele faz aos que não podem fazer nada por ele."
Por fim, gostaria de agradecer meus amigos. Em especial, ao Ricardo Buscariolli e ao Bernardo Dutra pela imensa ajuda quando precisei, à Lycia Lima, por sempre se impor-tar e me ajudar nos momentos dificeis, a Juliana Camargo, por ser portadora das mesmas incapacidades mentais que eu e ao Rafael Mouallem pelos inúmeros cigarros que nunca fumei.
-ABSTRACT
This paper purpose is to study the possible impact that emotional biases might have on voters’ judgements when we use a retrospective voting framework. In order to do so we use soccer as the instrument that may influence mood and emotions. Our fixed effect models show that wins on the election weekend are associated with a increase in incumbent voting, indicating that emotional biases (and soccer) may, in fact, influence voters.
RESUMO
O propósito deste estudo é analisar o possível impacto que um viés emocional pode ter nos julgamentos dos eleitores. Nesse sentido utilizamos o futebol como fonte exógena de um choque. O nosso modelo de efeitos fixos nos leva a concluir que vitórias de equipes no final de semana da eleição estão associadas a maior votação no incumbente indicando que um viés emocional pode influenciar o eleitor.
Contents
1 INTRODUCTION . . . . 10
2 LITERATURE . . . . 12
2.1 Retrospective Voting . . . 12
2.2 Mood and Judgment . . . 13
2.3 Sports and Mood . . . 14
3 DATA . . . . 16
3.1 TSE voting by zone and municipality . . . 16
3.2 Teams’ Fan bases. . . 17
3.3 Matches . . . 17
4 EMPIRICAL STRATEGY . . . . 19
5 RESULTS . . . . 22
6 CONCLUSIONS . . . . 25
7 REFERENCES . . . . 26
10
1 Introduction
Much has been theorized about how voters form their vote. The most common approach is related to the famous Downsian spatial model (Downs 1957) where voters are perfectly rational, informed and choose the platform that best matches their own preferences. If we, however, assume that voters are poorly informed about candidates’ positions and party platforms the classic Downsian model may not be a credible model. In that context the model proposed by Kramer (1971) may seem more plausible.
In Kramer’s model voter does not need to be totally informed about their candidates’ policies positions. Instead voters form their vote based on incumbents’ performance, voting for the reelection if the performance of the incumbent politician was considered "satisfactory". One interesting consequence of this framework is the possibility of voters being affected by biases. One type of bias according to Healy and Malhotra (2012) are emotional biases, in which case voters are affected by mood variations leading them to make decision differently hadn’t they not be affect by this bias. This mood swing, in turn, may lead to a different conception of what is considered "satisfactory". For example, voters in a better mood may build a more favorable opinion of the incumbents’ performance hence lowering the bar of what is considered satisfactory.
Particularly, this type of bias also finds support on psychological literature. Forgas and Bower (1988) show that people are more likely to remember positive aspects of subjects when in a good mood. Isen et al. (1978) also show that when in a good, mood participants of an experiment tended to be less demanding in terms of quality and need of services. Finally, relating it to the political economy literature, Anchen and Bartels (2004) show how politicians are punished and held accountable for negative events that go beyond their control such as shark attacks, flu and catastrophes.
Nevertheless, as Healy and Malhotra (2010) notice, the channel in which voters held politicians accountable for apparently exogenous action might be more rational than that Anchen and Bartels (2004) suppose. This is, voters punish incumbent politician for the lack of preventive or supportive actions, not for the event itself. One of the first works that credibly isolates an emotional bias was Healy and Malhotra (2012)1. In this paper, authors
use College football matches as a mood swinger, showing that the performance of college teams on weeks prior to the election have a significant correlation with incumbent voting in each respective town.
1
Chapter 1. Introduction 11
This work seeks to answer a similar question. In order to do so we use fixed effects model with data from the Brazilian National Championship matches and voting data of Brazilian general elections from 1998 to 2010. To try to control for possible omitted variable bias we use a panel data approach. We regress incumbent voting shares on municipalities teams’ performance outcome on the week prior to the election. This approach however does not account for unobservable variables that change over time and are correlated to the regressor. To try to increase the robustness of our results then, we also run a placebo regression with results from a week later.
12
2 Literature
2.1
Retrospective Voting
The incumbent voting literature was mainly influenced by three works; Key (1966), Kramer (1971), and Fiorina (1981). Key (1966) proposes an alternative to the bleak portrait of voting at Campbell et al. (1960). Kramer (1971) goes further and proposes a new framework for electoral behavior. Different from other models in literature, in Kramer’s model the voter does not compare every platform or dimension choosing the one that fits the best his own preferences. In this model, either because information on all platforms is costly or it is simply not available the voter decision rule is based only on the incumbent retrospective performance.
Hence according to Kramer (1971) voter decision making can be described as the following: Voter sets a bench mark for the performance of the incumbent politician, if the incumbent’s performance is above this benchmark, i.e., considered satisfactory, the voter votes for the incumbent politician. If the voter judges that incumbents performance is bellow this bench-mark, i.e., incumbent’s performance was not satisfactory, voter votes against the incumbent giving the opposition a chance. Kramer then proceeds to analyze the testable consequences of his model, showing robust evidence of correlation between economic performance and voting. Fiorina in Retrospective Voting in American National Elections (1981) also follows the same line: Voters do not need to have complete information on the political environment around them, they simply made a decision comparing their actual situation to their past situation and voting for incumbent if they feel they are better off in the present.
Furthermore, Healy and Malhotra (2012) that argue this framework is subjective to bias. The first type of bias is a cognitive bias. In this case voters may have trouble dealing with large amounts of information and may use cognitive shortcuts when faced with hard problems. For example there is compelling (Kramer 1971, Fair 1978, Tufte 1978, Achen and Bartels 2004, Bartels 2008) evidence that economic performance is more relevant on the electoral year than in any other. One possible explanation for that is that voters are not processing all information and are using the most recent information to form their vote implying a bias.
Chapter 2. Literature 13
because they feel happy or sad. Achen and Bartels (2002) provide evidence on this type of bias. Motivated by how Woodrow Wilson lost votes in coastal New Jersey on the 1916 election due to shark attacks, they seek to investigate if politicians can be punished by disasters that go beyond their control. Using data from the American National Climatic Data Center they show how incumbent voting is correlated to natural conditions in a certain county (floods and droughts) and interpret that as being evidence of voter irrationality.
Healy and Malhotra (2010) propose a alternative theory to the one in Achen and Bartels (2002). On this alternative theory, voters do not punish politicians for natural disasters or actions that go beyond their control but for their response to it. Far more rational then initially supposed, authors show that voters do not hold politicians accountable for natural disasters but do punish (or reward) politicians for their efforts after catastrophes (relief measures). For example authors show that politicians are punished by monetary damage, which can be considered preventable, but are not punished by deaths, which are considered more stochastic.
Hence if we want to analyze the impact of mood on voters a retrospective voting framework we have to look somehwere else. Healy, Malhotra and Mo (2012) analyze voters response to College Football wins on weeks prior to the elections. The main hypothesis here is that voters swing to a happy mood with a win and to a sad mood with a loss. They find that voters indeed reward incumbent politicians for a college win, with a win by the local college football team in the week before Election Day increasing the incumbent vote share by about 1.6 percentage points.
In this paper we seek to contribute to the literature providing additional evidence on the same question.
2.2
Mood and Judgment
The literature on mood and judgment is also vast. More specifically psychological literature provides us several studies on this topic. One of the first works to provide evidence on the relation of mood and judgment is Isen et al. (1978). On this work authors manipulate the humor of subjects on two different experiments. On the first experiment subjects on the treatment group had their mood positively manipulated by receiving a gift. Then, both control e treatment group were asked to rate their automobiles and refrigerators by an inde-pendent interviewer. Authors show that the control group rate their autos and refrigerators better in statistical terms.
Chapter 2. Literature 14
computer games. Subjects who had their mood positively manipulated were able to recall positive words more effectively while subjects on a negatively manipulated mood were able to recall negative words. Finally, the authors also propose a theory for the observed behavior in which subjects subconsciously use their words to continue on the same mood.
Forgas and Bower (1988) analyzes, in a controlled experiment, the influence of mood in people’s person-perception judgments. In this experiment subjects had their mood manip-ulated and were presented with descriptions of fictional characters. Then, they were asked to describe the fictional characters that they were just presented to. Results show that sub-jects that had their mood positively manipulated were able to recall more positive aspects while participants that had their mood negatively manipulated recalled more negative as-pects. Forgas and Bower (1988) conclude that emotions "may play a significant role in how person-perception judgments are commonly made". Several other studies addressing the role of emotions on personal judgments followed; Bower (1991), Clore, Schwarz, and Conway (1994); Fiedler (1991); Forgas (1992, 1993); but none of these became as influential as Forgas (1995).
On Forgas (1995) the author sews together all pieces of information from previous liter-ature in what is known as the Affect Infusion Model (AIM). According to this model, there are four different judgement strategies: Direct access, motivated, heuristic, and substantive processing. The model predicts that the level of affect influence on judgment will vary among these four strategies with the last two being much more subject to emotional biases. Fur-thermore, the author also lists six other variables that might lead to higher or lower affect influence; familiarity, personal relevance, complexity, specific motivation and cognitive ca-pacity. Hence, for Forgas (1995) it is not a matter of "if" moods and emotions can affect judgments but in which circumstances that is more likely to happen.
2.3
Sports and Mood
Several works address the impact of sports and on our mood. The literature that addresses the relation of soccer and heart attacks throught stress is particularly vast; Wilbert-Lampen et al (2008) find a significant increase of heart attacks during the World Cup periods’ in Munich, Kirkup and Merrick (2003) report a similar correlation for domestic matches in England. Witte, Bots, Hoes and Grobbee (2000) also report a similar effect for the Ducth national team during the 1996 European Cup. In all of these studies, stress is listed as the main factor driving the increase in heart attacks evidencing how it can deeply influence our emotions.
Chapter 2. Literature 15
Quebec and the performance of the local Hockey team. Although dealing exclusively with hockey this is an empirical evidence of what journalist Simon Kuper noticed for Brazilian soccer in his 1994 bookFootball against the Enemy; "[after a loss] the mood suddenly changes, and people who suffer the most are the nation’s manic depressives. Carried along by the euphoria they cannot bear its end. Their ’high’ becomes a ’low’, and they commit suicide". Hence we interpret that as another piece of evidence that shows the impact of sports in our emotions, more precisely how a loss can be a negative mood swinger.
16
3 Data
To be able to match the empirical strategy that will be described bellow we used three different data bases;
3.1
TSE voting by zone and municipality
The first database used to achieve the goals of our study was TSE voting by municipality zone. TSE, Superior Electoral Court (Tribunal Superior Eleitoral) is the highest body of the Brazilian Electoral Court. To increase transparency, after every election, TSE releases a series of databases with information on candidates, electoral outcomes and electoral reports. One of these databases is TSE voting bu municipality zone (Votação nominal por município e zona) which reports the voting by candidates by electoral zones inside a municipality. We then aggregated the voting by municipality for the general elections of 1998, 2002, 2006 and 2010.
The Brazilian voting system is composed by two different types of elections; General and Local. On local elections voters vote for local positions such as mayor and local chambers members. On general elections voters vote for President, Senator and Governor. Presidents and Governors are elected for a four year term while senators are elected for a eight year term. Furthermore the system only allows one reelection, meaning that after the second term either the politician runs for another position or he/she must wait four more years (eight years if senator) to run again.
Another characteristic of the Brazilian voting system is that elections for President and Governor are held in two stages. The first stage voters are allowed to choose from all candi-dates. The two candidates with the highest number of nominal votes advance to the second stage. If one candidate receives more than 50% of the votes on in the first stage he is de-clared winner and no second stage for that position is held. We also take advantage of that characteristic of the brazilian voting system including the second stage on our database.
Chapter 3. Data 17
3.2
Teams’ Fan bases
Another concern in our study is that differently from Healy and Malhotra (2010) we do not assume that the fan base of a municipality is entirely composed of fans of one single team. In fact, this assumption on the Brazilian case would be simply incorrect. Brazil’s soccer environment is known for its diversity and competitiveness. Even big cities, where fan bases tend to be more concentrated than in smaller cities usually have at least two traditional clubs. Hence, in order to account for that we need a way to "weight" the results. For example, it is unfair to assume that the impact on electoral outcomes in Rio of a win by a team such as Botafogo whose fan base is around 9% is similar to the impact of a win by América, whose fan base is smaller than 1%.
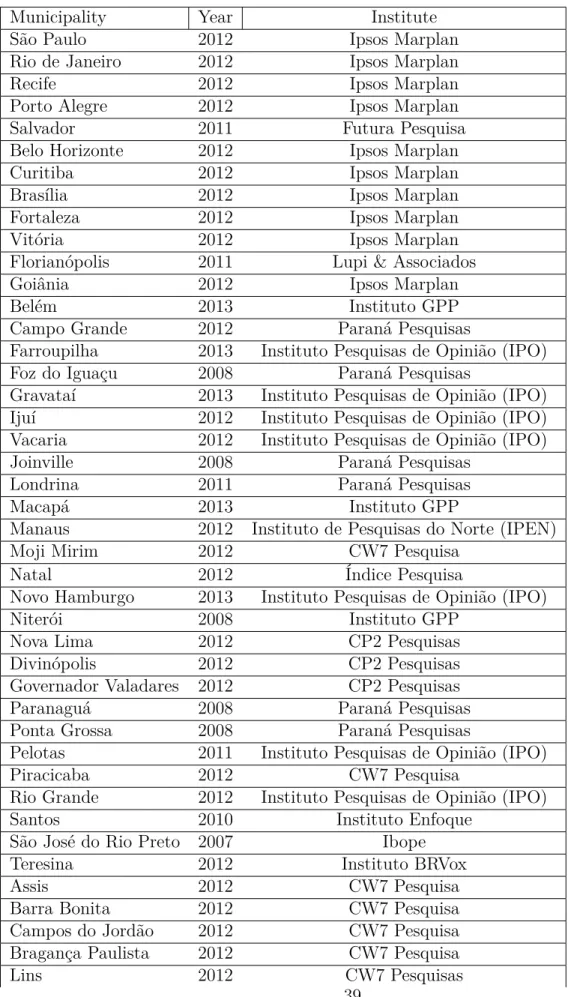
Our approach to this topic was to weigh teams by their respective fan bases in each municipality. Nevertheless, in order to do so we need fan databases for each municipality. Since there is no survey that provides this sort of information on an unified source we gathered recent surveys on soccer fan bases in 69 different municipalities. These studies were mostly made by marketing or business consulting firms and were released on the press or made public through each company’s website. The complete list of surveyed municipalities, year, and company used can be found on appendix.
One particular concern, of course, was to only use comparable surveys. In other words, we only used studies in which the methodologies were similar one to another. We set standards for several survey characteristics and would only use the surveys if these characteristics were met. For example, we only used surveys where answers were exclusive and spontaneous. This means that we only used surveys where surveyed individuals could declare that they support at most one team. Another required characteristic of these surveys was that the universe was the entire population and not only soccer fans. We do that in order to evaluate the impact taking into consideration municipalities where the number of soccer fans is smaller.
3.3
Matches
Finally, the last database used was the one related to the matches. We gathered results for matches from the first and second national division, for three different weeks in each electoral year and stage. The first, of course, is the week1 prior to the election. In Brazil, since 1996,
this round is held exclusively on a Saturday in such a way that on the election day, Sunday, there are no matches. We also gathered results for the rounds that happened one full week
1
Chapter 3. Data 18
prior to the elections, these matches also took place on a weekend but on a Saturday and Sunday. Finally, we compiled results of matches that happened one week after the election Sunday to run our placebo regressions.
19
4 Empirical Strategy
Our main goal is to analyze if a emotional shock generated by a club win on the week prior to the election may boost voters’ positive mood, leading them to evaluate the past policies more positively and hence voting for the incumbent. In section 2.2 we have shown how mood may affect judgments. In section 2.3 we have shown how sports may affect mood.
Our approach to solve to the problem was a fixed effects model. Different from cross sec-tion data this methodology controls for possible endogeneity that might arise from unobserved characteristics that are constant over time. We use two different fixed effects; municipalities and election (year and stage) fixed effects. Our dependent variable is the share of votes on the incumbent politician. Our independent variable of interest is the performance of a soccer clubs on the week prior to the election. As stated before however, we need to weight this performance by the respective fan base.
Using fan base surveys for each municipality we multiplied the performance of each team by its respective fan base and sum. Furthermore, we considered three different measure of a team’s performance. The first one is points, as established by International Federation of Association Football, this is, a win counts three points, a draw awards one point and a loss zero points.
Note, however, that one consequence of building our performance index like that is that we are somehow imposing a structure on how voters are affected by performance, in other words, a loss has no impact and a win counts for welfare three times more than a draw. Since there is no particular reason to make this assumption we also built two alternative performance indexes. The second one is a dummy that assumes a value of one if a team wins and zero if a team loses or draws. This means that voters only care about winning. Finally we construct a variable that weighs symmetrically wins and losses, this is, this variable takes value one if a team wins, zero if a team draws and negative one if a team loses. On a mathematical form;
W eighedP ointsi =
X
c
share of fans
z}|{
fci ∗
points
z}|{
Pci
W eighedW ini =
X
c
share of fans
z}|{
fci ∗
Win Dummy
z}|{
Wci
W eighedSymmetrici =
X
c
share of fans
z}|{
fci ∗
Symmetric =
z}|{
Chapter 4. Empirical Strategy 20
We regress the incumbent share of votes in each of these independent variables separately. Using double fixed effects our estimated model is the following:
V_shareit =αi+θt+β1W eighedV arsit+εit
Here, due to the overwhelming evidence linking soccer to emotions and emotions to judg-ments we expect to see a positive correlation betwen our weighed variables and the incumbent share of votes. To check the robustness of our results we also estimated a model with economic variables as independent variables:
V_shareit =αi+θt+β1W eighedV arsit+β2∗X′+εit
If the main driver of our results is actually mood then we expect our results to remain significant after the introduction of these economic variables. A similar argument can be used for our placebos; if a mood swing is the main driver of our results we expect that matches that happened after the election date to have no impact on the incumbent voting shares.
Next, we divided our database in three smaller sets based on fixture dates. Those matches that happened on the election weekend; those matches that happened on the week before the election and finaly those which took place on the weekend prior to the election. We regress share of votes on each set separetely. Basing our analysis on the AIM model, we expect that matches that happened on the election weekend to have a much higher impact on the incumbent voting. The reasoning behind this argument is that those matches deal more directly with emotions while others may impact only mood. 1 We then proceed estimated a
model with interactions between position dummies and performance, in this case:
V_shareit =αi+θt+β1W eighedV arit+β2P ositionit+β3P ositionpW eighedV arit+εit
The hypothesis tested here can also find its foundations in Forgas (1995). According to the AIM, familiarity to the question is an important aspect of the relationship between emotions and judgements. The more familiar subjects are to an question the more likely they are to access cognitive shortcuts and hence the less likely are emotions to affect their
1
Chapter 4. Empirical Strategy 21
judgment 2 3. Therefore, if we assume that voters are more familiar with the evaluation of
the president performance on the the office and less familiar with senators performance we would expect the later to experience a larger voting impact of a win.
Finally, we perform two heterogeneidity analysis. Both are done on a similar way; we use the sample median to divide our data in two, then we proceed to run separate regressions in each of the sets. The first heterogeneidity analysis is related to educational outcome: According to the psycological literature complexity is another aspect that may lead emotions to have a larger impact on our judgements. The more complex a subject the more likely we are subject to be influenced by emotions. Here we assume that for uneducated people the task to analyze a term is more complex, hence we expect to see a stronger correlation for less educated municipalities. The second heterogeneidity analysis is related to population composition. There is no psychological evidence that lead us to believe that men or women are more vulnerable to the influence of emotions. Nevertheless, the medical literature reports
4 larger impacts on men since the number of soccer fans is higher among men. Therefore we
also expect to see a larger impact for men.
Our models rely on three main hypothesis; The first is strong endogeneity this is;
E[εitp|Xi, αi, θt] = 0
Intuitively, this condition tells us that conditional on observable characteristics, the ex-pectancy of the error term is zero for every period t. Nevertheless, this hypothesis might be too strong. To increase the robustness of our estimation and provide some evidence that this hypothesis is being respect we run a placebo regression with results that happened a week later.
The second hypothesis is homocedasticity. In other words we assume that variance is constant and that:
E[εipεip|Xi, αi, θt] =σ2εIT
Finally, we are also assuming that the rank condition holds. This implies that the lines and columns of this matrix are linearly independent and thus the matrix is invertible
2
According to Forgas (1995) model direct access processing should be used whenever the target is highly familiar with the subject. This is processing strategy is, in turn, less likely to be affected by moods and emotions "because it involves little or no constructive elaboration, and the strongly cued retrieval of an existing crystallized judgment is likely to be quite robust and resistant to affective distortions."
3
Futhermore. Srull (1983, 1984) provides evidence supporting this theory. He founds that mood and emotions had little impact on judgments about familiar consumer products, whereas judgments about highly unfamiliar items had larger impact
4
22
5 Results
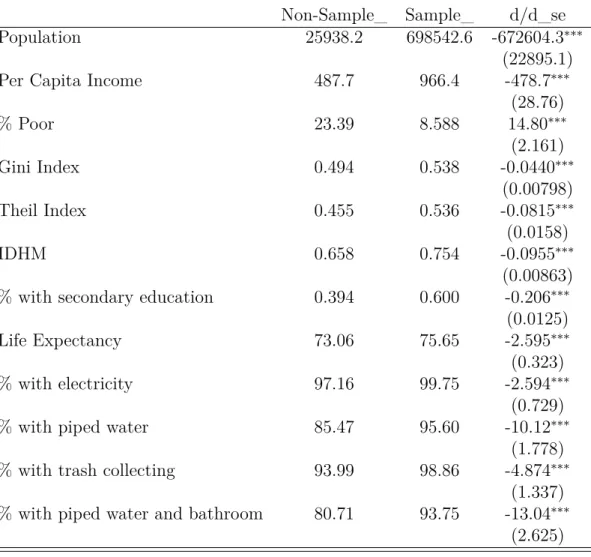
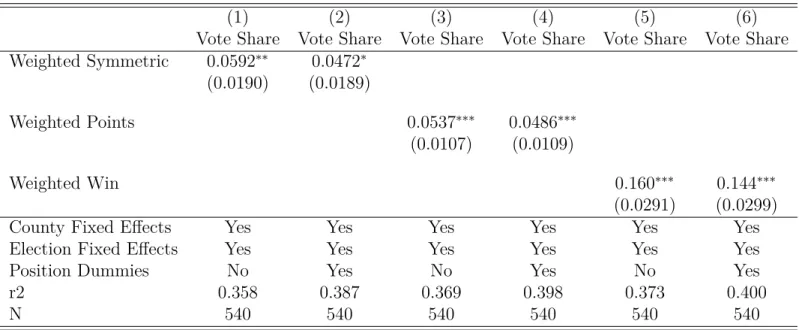
Before interpreting results of the of the panel analyses it is important to analyze how so-cioeconomic characteristics of our sample of 69 municipalities compares to the rest of the country. Using data of the 2010 census we ran a series of ttests that can be found on table 1. As we can see, municipalities in our sample are higher populated, richer, and more educated than the rest of the country. This is not surprising considering that the municipalities used in our sample are those in which we have data on clubs’ fan bases. This data is collected by consulting and marketing firms whose interest is likely to be stronger on richer municipalities. Table 2 show the results of our panel regressions. Each line represent a different indepen-dent variable of interest. Odd columns models have no position dummies while we included these dummies on even columns. All models reported have municipality and year-stage fixed effects. Finally, we allow standard errors to be correlated among municipalities by cluster-ing these errors on a municipality level. As our results indicate the weighed performance of soccer teams o the weekend prior to the election do correlate with the share of votes that the incumbent receives, an increase in one weighed symmetric point increases the incumbent voting share in 4.72 percentage points (significant at 5% level). This correlation seems robust to the different welfare structures that we impose to the team’s win.
The magnitude of the effect, however, it is not trivial. The coefficient can be interpreted as if in a hypothetical municipality where the entire fan base supports same team a win of that team would increase incumbent voting share in 4.72 percentage. Nevertheless, this municipality does not exist. First because there is no municipality in our database where the number of soccer fans is 100%. Second because even if 100% declared preference for a soccer team it is hard to imagine that this preference would be for a single team. Hence, we think about this coefficient as a upper bound of the impact in a municipality. In a more realistic view we can seize the impact of a win of a major club in its major fan base area. A win by a team such as Corinthians, whose fan base is around 0.36 of the population, in a city like São Paulo would have to be rescaled by a factor of 0.36 meaning that the total effect would of 1.69 percentage points.
Chapter 5. Results 23
state. One possible way to rule out this theory is to use placebo regressions, if this type of bias was the main driver of results we would expect to see this relation on our placebo results. As table 3 indicates this does not seem to be the case, none of our results show a correlation between performance a week later and voting on the incumbent politician.
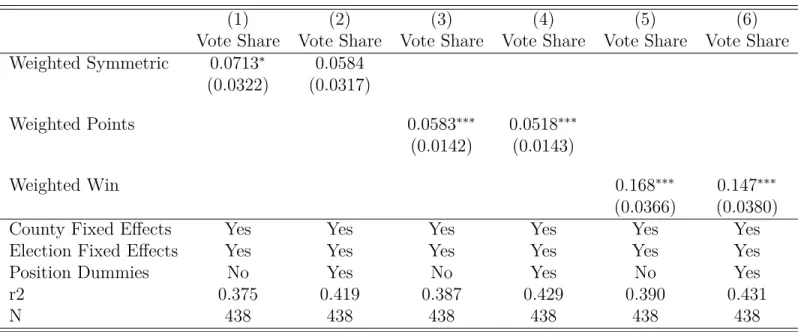
Furthermore, another way to control for this possible bias is to include economic indicators as dependent variables in our model. We do so by including the GDP by municipality for each electoral year as a independent variable. Table 4 shows our results for this model; the coefficient associated with our weighed number ponits, wins and symmetric index remains significant and only varies slightly. We interpret these results as being additional evidence that what it is driving our results is not an economic shock.
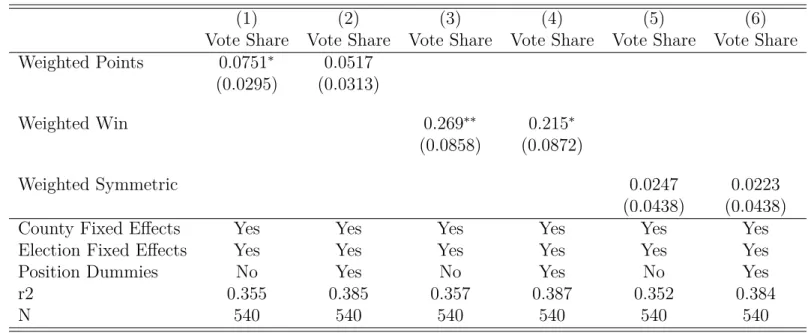
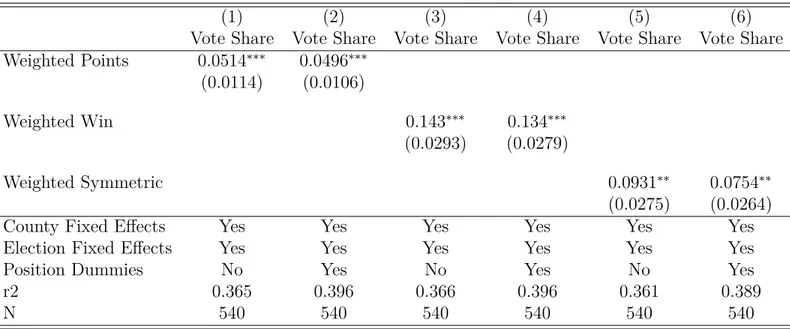
According to Forgas (1995) the short term emotions are a more powerful source of judg-mental bias than mood. Hence, if emotions are actually the main driver of our results we expect to see a stronger impact of a win on the days prior to the election. To test this impli-cation we divide the matches in our sample into four different periods of time; One sample with the results that happened one week prior to the election, one with the matches that happened mid-week prior to the election, one sample with the matches that happened on the elections week, and finally one placebo sample with all matches that happened after the elections. Our results for this hypothesis are shown in table 5, 6, 7 and graph 1. Confirming our hypothesis, results of matches that happen on the election weekend have a larger impact on voting than results for matches that take place one week before. Results of matches that take place on the Wednesday have no impact on incumbent voting. One possible explanation for these results is that matches that take place on Wednesday do not draw as much attention from the public as weekend matches.
Chapter 5. Results 24
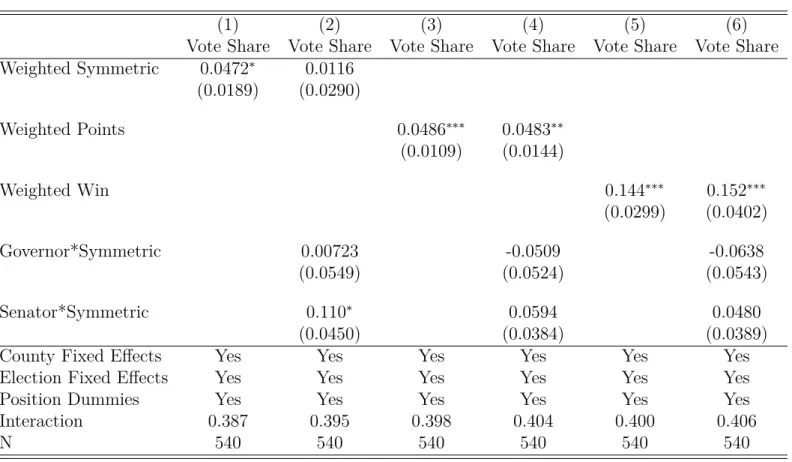
more likely our emotions may impact our mood. Therefore if we assume that senator is the position in which voters judge to be the least influential and hence the least relevant, then our results can be explained by psychological literature.
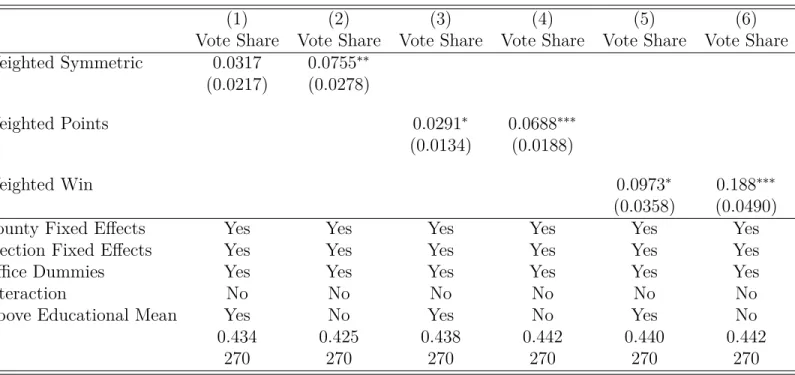
Additionally, using the 2010 census, we divided our sample in two parts; municipalities above the sample educational mean and municipalities under the sample mean. We found that the effect is mainly driven by municipalities under the educational mean for all of our three different independent variables (table 9). This is an indicator that less educated voters are more likely to vote for incumbent politician if their team wins. Again, psychological literature may give us a hint on the interpretation of these results. According to the Affect Infusion Model (Forgas (1995)), another key determinant of the impact of emotions on judgments is complexity. The more complex a matter is the more emotions may affect our judgements. If we assume that voting for less educated people is a more complex process because they lack knowledge then again our results match Forgas’ model.
25
6 Conclusions
After analyzing evidence on retrospective voting literature we found scarce evidence of the irrationality of voters. One possible source if irrationality is mood. This paper tries to isolate this channel by using soccer as a exogenous mood shock on voters.
We used data from the Brazilian national championship and from Brazilian general elec-tions to conclude that a win by a soccer team on the election weekend is associated on an increase in incumbent voting of up to 4.92 percentage points. We also show that results from a week before and for half week before the elections have no impact on voting. Our non significant placebo results and our model with economic variables add robustness to the estimation.
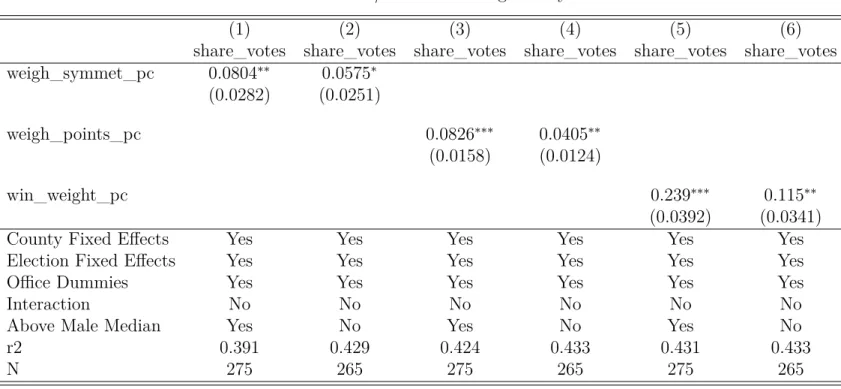
We also showed that statistically speaking all positions seem experience almost the same effect with senator votes being slightly more likely to be affect my mood. The effect, however, is heterogenous in terms of education and population composition. The effect seems to be much stronger on less educated municipalities for all of our three different indexes. In terms of population composition our effects seem to be stronger on municipalities with a higher rate of men to women, a conclusion supported by two of our three indexes.
26
7 References
Achen, Christopher H., and Larry M. Bartels. "Blind retrospection. Electoral responses to drought, flu, and shark attacks." Estudios/Working Papers (Centro de Estudios Avanzados en Ciencias Sociales) 199 (2004): 1.
Ashton, John K., Bill Gerrard, and Robert Hudson. "Economic impact of national sport-ing success: evidence from the London stock exchange." Applied Economics Letters 10.12 (2003): 783-785.
Bassi, Anna. "Voting systems and strategic manipulation: An experimental study." Jour-nal of Theoretical Politics (2014).
Berument, Hakan, Nildag Basak Ceylan, and Esin Gozpinar. "Performance of soccer on the stock market: Evidence from Turkey." The Social Science Journal 43.4 (2006): 695-699.
Bower, Gordon H. "Mood congruity of social judgments." Emotion and social judgments (1991): 31-53.
Isen, A. M., Shalker, T. E., Clark, M., and Karp, L. (1978). Affect, accessibility of material in memory, and behavior: A cognitive loop?. Journal of personality and social psy-chology, 36(1), 1. Chicago
Clark, Margaret S., and Alice M. Isen. "Toward understanding the relationship between feeling states and social behavior." Cognitive social psychology 73 (1982): 108.
Campbell A, Converse PE, Miller WE, Stokes DE. 1960. The American Voter. Chicago: Univ. Chicago Press
Clore, Gerald L., Norbert Schwarz, and Michael Conway. "Affective causes and conse-quences of social information processing." Handbook of social cognition 1 (1994): 323-417.
Chapter 7. References 27
Edmans, Alex, Diego Garcia, and Oyvind Norli. "Sports sentiment and stock returns." The Journal of Finance 62.4 (2007): 1967-1998.
Ferejohn J. 1986. Incumbent performance and electoral control. Public Choice 50(1–3):5–25
Fiedler, Klaus. "On the task, the measures and the mood in research on affect and social cognition." Emotion and social judgments (1991): 83-104.
Fiorina, Morris P. Retrospective voting in American national elections. Vol. 5. No. 6. New Haven: Yale University Press, 1981.
Forgas, Joseph P. (1992). "Affect in social judgments and decisions: A multi- process model." In M. Zanna (Ed.), Advances in experimental social psychology (Vol. 25, pp. 227-275). San Diego, CA: Academic Press.
Forgas, Joseph P. "Affect, appraisal and action: Towards a multiprocess framework." Per-spectives on anger and emotion. Advances in social cognition 6 (1993): 89-107.
Forgas, Joseph P., and Gordon H. Bower. "Mood effects on person-perception judgments." Journal of personality and social psychology 53.1 (1987): 53.
Forgas, Joseph P. "Mood and judgment: the affect infusion model (AIM)." Psychological bulletin 117.1 (1995): 39.
Healy, Andrew, and Neil Malhotra. "Myopic voters and natural disaster policy." Ameri-can Political Science Review 103.03 (2009): 387-406.
Healy, Andrew J., Neil Malhotra, and Cecilia Hyunjung Mo. "Irrelevant events affect voters’ evaluations of government performance." Proceedings of the National Academy of Sciences 107.29 (2010): 12804-12809.
Healy, Andrew, and Neil Malhotra. "Retrospective Voting Reconsidered." Annual Review of Political Science 16 (2013): 285-306.
Chapter 7. References 28
Paper, Department of Economics, Loyola Marymount University, 2008.
Isen, Alice M., Kimberly A. Daubman, and Gary P. Nowicki. "Positive affect facilitates creative problem solving." Journal of personality and social psychology 52.6 (1987): 1122.
Isen, A. M., Shalker, T. E., Clark, M., and Karp, L. (1978). Affect, accessibility of mate-rial in memory, and behavior: A cognitive loop? Journal of personality and social psychology, 36(1), 1.
Key, Valdimer Orlando, and Milton C. Cummings. The responsible electorate. Belknap Press of Harvard University Press, 1966.
Kirkup, W., and D. W. Merrick. "A matter of life and death: population mortality and football results." Journal of epidemiology and community health 57.6 (2003): 429-432.
Kramer, Gerald H. "Short-term fluctuations in US voting behavior, 1896–1964." American Political Science Review 65.01 (1971): 131-143.
Kuper, Simon. Football against the enemy. Hachette UK, 2011.
Srull, Thomas K. "Affect and memory: The impact of affective reactions in advertising on the representation of product information in memory." Advances in consumer research 10.1 (1983): 520-525.
Srull, Thomas K. "The effects of subjective affective states on memory and judgment." Advances in consumer research 11.1 (1984): 530-533.
Trovato, Frank. "The Stanley Cup of hockey and suicide in Quebec, 1951–1992." Social Forces 77.1 (1998): 105-126.
Tufte, Edward R. "Political Control of the Economy." Princeton, NJ: Princeton University Press (1978).
Chapter 7. References 29
30
8 Tables
Table 1 – Sample Vs Rest
Non-Sample_ Sample_ d/d_se
Population 25938.2 698542.6 -672604.3∗∗∗
(22895.1)
Per Capita Income 487.7 966.4 -478.7∗∗∗
(28.76)
% Poor 23.39 8.588 14.80∗∗∗
(2.161)
Gini Index 0.494 0.538 -0.0440∗∗∗
(0.00798)
Theil Index 0.455 0.536 -0.0815∗∗∗
(0.0158)
IDHM 0.658 0.754 -0.0955∗∗∗
(0.00863) % with secondary education 0.394 0.600 -0.206∗∗∗
(0.0125)
Life Expectancy 73.06 75.65 -2.595∗∗∗
(0.323)
% with electricity 97.16 99.75 -2.594∗∗∗
(0.729)
% with piped water 85.47 95.60 -10.12∗∗∗
(1.778)
% with trash collecting 93.99 98.86 -4.874∗∗∗
(1.337) % with piped water and bathroom 80.71 93.75 -13.04∗∗∗
Table 2 – Effects on Voting Share
(1) (2) (3) (4) (5) (6)
Vote Share Vote Share Vote Share Vote Share Vote Share Vote Share Weighted Symmetric 0.0592∗∗ 0.0472∗
(0.0190) (0.0189)
Weighted Points 0.0537∗∗∗ 0.0486∗∗∗
(0.0107) (0.0109)
Weighted Win 0.160∗∗∗ 0.144∗∗∗
(0.0291) (0.0299)
County Fixed Effects Yes Yes Yes Yes Yes Yes
Election Fixed Effects Yes Yes Yes Yes Yes Yes
Position Dummies No Yes No Yes No Yes
r2 0.358 0.387 0.369 0.398 0.373 0.400
N 540 540 540 540 540 540
Standard errors in parentheses
∗ p <0.05,∗∗ p <0.01,∗∗∗ p <0.001
Table 3 – Placebo Regressions
(1) (2) (3) (4) (5) (6)
Vote Share Vote Share Vote Share Vote Share Vote Share Vote Share Weighted Symmetric 0.0255 0.0103
(0.0314) (0.0302)
Weighted Points 0.0387∗ 0.0303
(0.0190) (0.0185)
Weighted Win 0.0645 0.0455
(0.0577) (0.0541)
County Fixed Effects Yes Yes Yes Yes Yes Yes
Election Fixed Effects Yes Yes Yes Yes Yes Yes
Position Dummies No Yes No Yes No Yes
r2 0.352 0.384 0.356 0.386 0.353 0.384
N 540 540 540 540 540 540
Standard errors in parentheses
∗ p <0.05,∗∗ p <0.01,∗∗∗ p <0.001
Table 4 – Effects on Voting Share with GDP covariate
(1) (2) (3) (4) (5) (6)
Vote Share Vote Share Vote Share Vote Share Vote Share Vote Share Weighted Symmetric 0.0713∗ 0.0584
(0.0322) (0.0317)
Weighted Points 0.0583∗∗∗ 0.0518∗∗∗
(0.0142) (0.0143)
Weighted Win 0.168∗∗∗ 0.147∗∗∗
(0.0366) (0.0380)
County Fixed Effects Yes Yes Yes Yes Yes Yes
Election Fixed Effects Yes Yes Yes Yes Yes Yes
Position Dummies No Yes No Yes No Yes
r2 0.375 0.419 0.387 0.429 0.390 0.431
N 438 438 438 438 438 438
Standard errors in parentheses
∗ p <0.05,∗∗ p <0.01,∗∗∗ p <0.001
Table 5 – Effects on Voting Share (Weekend Prior to Election)
(1) (2) (3) (4) (5) (6)
Vote Share Vote Share Vote Share Vote Share Vote Share Vote Share Weighted Points 0.0751∗ 0.0517
(0.0295) (0.0313)
Weighted Win 0.269∗∗ 0.215∗
(0.0858) (0.0872)
Weighted Symmetric 0.0247 0.0223
(0.0438) (0.0438)
County Fixed Effects Yes Yes Yes Yes Yes Yes
Election Fixed Effects Yes Yes Yes Yes Yes Yes
Position Dummies No Yes No Yes No Yes
r2 0.355 0.385 0.357 0.387 0.352 0.384
N 540 540 540 540 540 540
Standard errors in parentheses
∗ p <0.05,∗∗ p <0.01,∗∗∗ p <0.001
Table 6 – Effects on Voting Share (Weekdays Prior to Election)
(1) (2) (3) (4) (5) (6)
Vote Share Vote Share Vote Share Vote Share Vote Share Vote Share Weighted Points -0.00579 -0.00543
(0.0150) (0.0156)
Weighted Win -0.0174 -0.0163
(0.0450) (0.0469)
Weighted Symmetric -0.0474 -0.0441
(0.0359) (0.0372)
County Fixed Effects Yes Yes Yes Yes Yes Yes
Election Fixed Effects Yes Yes Yes Yes Yes Yes
Position Dummies No Yes No Yes No Yes
r2 0.352 0.384 0.352 0.384 0.353 0.385
N 540 540 540 540 540 540
Standard errors in parentheses
∗ p <0.05,∗∗ p <0.01,∗∗∗ p <0.001
Table 7 – Effects on Voting Share (Election Weekend)
(1) (2) (3) (4) (5) (6)
Vote Share Vote Share Vote Share Vote Share Vote Share Vote Share Weighted Points 0.0514∗∗∗ 0.0496∗∗∗
(0.0114) (0.0106)
Weighted Win 0.143∗∗∗ 0.134∗∗∗
(0.0293) (0.0279)
Weighted Symmetric 0.0931∗∗ 0.0754∗∗
(0.0275) (0.0264)
County Fixed Effects Yes Yes Yes Yes Yes Yes
Election Fixed Effects Yes Yes Yes Yes Yes Yes
Position Dummies No Yes No Yes No Yes
r2 0.365 0.396 0.366 0.396 0.361 0.389
N 540 540 540 540 540 540
Standard errors in parentheses
∗ p <0.05,∗∗ p <0.01,∗∗∗ p <0.001
Table 8 – Position Heterogeneidity
(1) (2) (3) (4) (5) (6)
Vote Share Vote Share Vote Share Vote Share Vote Share Vote Share Weighted Symmetric 0.0472∗ 0.0116
(0.0189) (0.0290)
Weighted Points 0.0486∗∗∗ 0.0483∗∗
(0.0109) (0.0144)
Weighted Win 0.144∗∗∗ 0.152∗∗∗
(0.0299) (0.0402)
Governor*Symmetric 0.00723 -0.0509 -0.0638
(0.0549) (0.0524) (0.0543)
Senator*Symmetric 0.110∗ 0.0594 0.0480
(0.0450) (0.0384) (0.0389)
County Fixed Effects Yes Yes Yes Yes Yes Yes
Election Fixed Effects Yes Yes Yes Yes Yes Yes
Position Dummies Yes Yes Yes Yes Yes Yes
Interaction 0.387 0.395 0.398 0.404 0.400 0.406
N 540 540 540 540 540 540
Standard errors in parentheses
∗ p <0.05,∗∗ p <0.01,∗∗∗ p <0.001
Table 9 – Educational Heterogeneidity
(1) (2) (3) (4) (5) (6)
Vote Share Vote Share Vote Share Vote Share Vote Share Vote Share Weighted Symmetric 0.0317 0.0755∗∗
(0.0217) (0.0278)
Weighted Points 0.0291∗ 0.0688∗∗∗
(0.0134) (0.0188)
Weighted Win 0.0973∗ 0.188∗∗∗
(0.0358) (0.0490)
County Fixed Effects Yes Yes Yes Yes Yes Yes
Election Fixed Effects Yes Yes Yes Yes Yes Yes
Office Dummies Yes Yes Yes Yes Yes Yes
Interaction No No No No No No
Above Educational Mean Yes No Yes No Yes No
r2 0.434 0.425 0.438 0.442 0.440 0.442
N 270 270 270 270 270 270
Standard errors in parentheses
∗ p <0.05,∗∗ p <0.01,∗∗∗ p <0.001
Table 10 – Men/Women Heterogeneidity
(1) (2) (3) (4) (5) (6)
share_votes share_votes share_votes share_votes share_votes share_votes weigh_symmet_pc 0.0804∗∗ 0.0575∗
(0.0282) (0.0251)
weigh_points_pc 0.0826∗∗∗ 0.0405∗∗
(0.0158) (0.0124)
win_weight_pc 0.239∗∗∗ 0.115∗∗
(0.0392) (0.0341)
County Fixed Effects Yes Yes Yes Yes Yes Yes
Election Fixed Effects Yes Yes Yes Yes Yes Yes
Office Dummies Yes Yes Yes Yes Yes Yes
Interaction No No No No No No
Above Male Median Yes No Yes No Yes No
r2 0.391 0.429 0.424 0.433 0.431 0.433
N 275 265 275 265 275 265
Standard errors in parentheses
∗ p <0.05,∗∗ p <0.01,∗∗∗ p <0.001
Table 11 – Sample Municipalities
Municipality Year Institute
São Paulo 2012 Ipsos Marplan
Rio de Janeiro 2012 Ipsos Marplan
Recife 2012 Ipsos Marplan
Porto Alegre 2012 Ipsos Marplan
Salvador 2011 Futura Pesquisa
Belo Horizonte 2012 Ipsos Marplan
Curitiba 2012 Ipsos Marplan
Brasília 2012 Ipsos Marplan
Fortaleza 2012 Ipsos Marplan
Vitória 2012 Ipsos Marplan
Florianópolis 2011 Lupi & Associados
Goiânia 2012 Ipsos Marplan
Belém 2013 Instituto GPP
Campo Grande 2012 Paraná Pesquisas
Farroupilha 2013 Instituto Pesquisas de Opinião (IPO)
Foz do Iguaçu 2008 Paraná Pesquisas
Gravataí 2013 Instituto Pesquisas de Opinião (IPO) Ijuí 2012 Instituto Pesquisas de Opinião (IPO) Vacaria 2012 Instituto Pesquisas de Opinião (IPO)
Joinville 2008 Paraná Pesquisas
Londrina 2011 Paraná Pesquisas
Macapá 2013 Instituto GPP
Manaus 2012 Instituto de Pesquisas do Norte (IPEN)
Moji Mirim 2012 CW7 Pesquisa
Natal 2012 Índice Pesquisa
Novo Hamburgo 2013 Instituto Pesquisas de Opinião (IPO)
Niterói 2008 Instituto GPP
Nova Lima 2012 CP2 Pesquisas
Divinópolis 2012 CP2 Pesquisas
Governador Valadares 2012 CP2 Pesquisas
Paranaguá 2008 Paraná Pesquisas
Ponta Grossa 2008 Paraná Pesquisas
Pelotas 2011 Instituto Pesquisas de Opinião (IPO)
Piracicaba 2012 CW7 Pesquisa
Rio Grande 2012 Instituto Pesquisas de Opinião (IPO)
Santos 2010 Instituto Enfoque
São José do Rio Preto 2007 Ibope
Teresina 2012 Instituto BRVox
Assis 2012 CW7 Pesquisa
Barra Bonita 2012 CW7 Pesquisa
Campos do Jordão 2012 CW7 Pesquisa
Bragança Paulista 2012 CW7 Pesquisa
Lins 2012 CW7 Pesquisas
Araguari 2012 CP2 Pesquisas
Campestre 2012 CP2 Pesquisas
Capelinha 2012 CP2 Pesquisas
Iguaba Grande 2012 Instituto GPP
São Pedro da Aldeia 2012 Instituto GPP
Araruama 2012 Instituto GPP
Candiota 2011 Instituto Pesquisas de Opinião (IPO) Canguçu 2011 Instituto Pesquisas de Opinião (IPO) Santa Vitória do Palmar 2011 Instituto Pesquisas de Opinião (IPO) Esteio 2011 Instituto Pesquisas de Opinião (IPO) Taquari 2011 Instituto Pesquisas de Opinião (IPO) Uruguaiana 2011 Instituto Pesquisas de Opinião (IPO) Palmares do Sul 2011 Instituto Pesquisas de Opinião (IPO)
Gaspar 2012 Paraná Pesquisas
Garopaba 2012 Paraná Pesquisas
Governador Celso Ramos 2012 Paraná Pesquisas
Braço do Norte 2012 Paraná Pesquisas
Mafra 2012 Paraná Pesquisas
Campo Alegre 2012 Paraná Pesquisas
Caxias do Sul 2011 Instituto Pesquisas de Opinião (IPO)
Palmas 2013 Instituto GPP
Porto Velho 2013 Instituto GPP
Rio Branco 2013 Instituto GPP
Garanhuns 2010 Plural Pesquisas
Caruaru 2010 Plural Pesquisas
Vitória de Santo Antão 2010 Plural Pesquisas
Arcoverde 2010 Plural Pesquisas