Toward Understanding Prevalence of Airborne Microorganisms
in a Hot-Arid Environment
Abdel Hameed A.A.a, Mashat B.b , Elmorsy T.H.c
a
Air Pollution Department, National Research Centre, Dokki, Giza, Egypt b
Department of Environmental and Health Research, The Custodian of the Two Holy Mosques Institute for Hajj and Umrah Research, Umm Al Qura University, Makkah, Saudi Arabia
c
Department of Microbiology, National Organization for Drug Control and Research, Dokki, Giza, Egypt
Abstract
This study aims to determine prevalence of microorganisms in the air state and those associated particulate matter (PM) in a hot arid environment (Makkah city, Saudi Arabia) in relation to time of the day, PM concentration and meteorological conditions during the period between July and September 2014. PM and black smoke samples were collected on cellulose nitrate membrane ilters during the daytime (8.00 am - 20.00 pm) and the nighttime (20.00 pm - 8.00 am). PMs, ilters were eluted in buffer phosphate and aliquots were spread plated onto the surfaces of trypticase soya agar, malt extract agar, and starch casein agar media for counting bacteria, fungi and actinomycetes associated PM, respectively. Airborne microorganisms were collected using an Andersen two stage impactor sampler equipped with Petri plates containing the previously mentioned agar media. The Andersen two-stage viable cascade impactor sampler separates particles into coarse (≥8 μm) and ine (≤8 μm) size fractions. Airborne microorganisms were taken at three day time-scales: in the morning (8 am - 10 am), at the afternoon (13.00 pm - 16.00 pm) and in the evening (22.00 pm - 1.00 am). The average concentrations of PM (149.5 μg/m3) and smoke (57.03 μg/m3
) were higher in the daytime and nighttime, respectively. The greatest concentrations of microorganisms associated PM were found in the daytime, however the peak concentration of airborne microorganisms was found in the evening time. Fine microbial fraction constituted ~60% - 75.9% of the total microbial concentrations. Positive correlations were found between bacteria with PM concentration in the daytime and meteorological conditions at the nighttime. Temperature and relative humidity positively affected survivability of microorganisms associated PM at the nighttime and airborne fungi as well. This study helps understand distribution pattern of microorganisms in the atmosphere of a hot-arid environment.
Keywords: microorganisms; air; size fraction; PM; time of the day; arid environment; meteorological conditions
1. Introduction
Arid regions/deserts are major source of PM
(Meola et al., 2015). PM varies in its composition
(biological or mineral), size and shape (Kulkarni
et al., 2011). Particles originate from various natural and
anthropogenic sources (Fang et al., 2007). Biological particles are particles of biological origin suspended in
the air such as: bacteria, fungi, viruses, microbial toxins, plant debris, pollen grains and enzymes (ACGIH, 1999). Biological particles estimated at ~ 25% of the total PM
over the land surface (Jaenicke, 2005). Microorganisms
are independently (freely) or not-independently
(attached PM) suspended in the atmosphere (Shaffer and Lighthart, 1997; Burrows et al., 2009), and in turn their biological and physiological characters and prevalence pattern may be changed (Alghamdi et al., 2014).
Biological particles (mainly microorganisms)
affect air quality, ecosystem and human health (Lin
and Li, 2000; Huffman et al., 2013; Tao et al., 2014).
Biological particles are eficient cloud condensation
nuclei (Morris et al., 2013) and inluence weather
and climate system (Chen et al., 2012). Biological particles including “fungi and pollen grains” are potential aeroallergens (Sindt et al., 2016); and enhance
asthma and other respiratory conditions (Dales et al.,
2003). Particles with both biological and non-biological
origins can be linked and transported together in the atmosphere (Alghamdi et al., 2014), enhancing human health responses (Ryan et al., 2009). The effect of dust
storms on atmospheric microbiology (Grifin et al.,
2003; Garrison et al., 2003) and their impact on human
health were studied in the arid environment (Grifin and Kellogg, 2004).
82
Abdel Hameed A.A. et al. / EnvironmentAsia 10(1) (2017) 81-91
Microbial concentrations vary over various
time-scales (Lighthart, 1994) and microbial particle size determines its behavior (deposition/dispersion) in the atmosphere (Nicholson, 1988). Anthropogenic
activities, environmental conditions and periodicity
of sources may inluence composition, abundance,
behavior, and survivability of microorganisms in the atmosphere (Sippula et al., 2013). Many studies
have been carried-out on concentrations and types
of air pollutants inside and outside environments of
the holy mosques, Saudi Arabia (Abdel Hameed and Habeeballah, 2013; Mashat, 2015). However less
information is available on the prevalence of culturable microorganisms in relation to time of the day, particle
size, PM concentration and meteorological conditions in
the atmosphere of Makkah city, although many studies have been conducted worldwide (Levetin and Dorsey,
2006; Sadyś et al., 2016; Vélez-Pereira et al., 2016;
Gao et al., 2016). The present study aims to understand
the prevalence of culturable microorganisms suspended in the air either as individual organisms or attached to
dust particles through: 1) evaluating airborne bacteria,
fungi, and actinomycetes regarding their concentrations,
size fractions, and temporal variations, 2) determining
microbial community associated PM in the daytime
and the nighttime, and 3) understanding the effects of
meteorological conditions and PM concentration on microbial survivability.
2. Materials and Methods
2.1 Sampling site and strategy
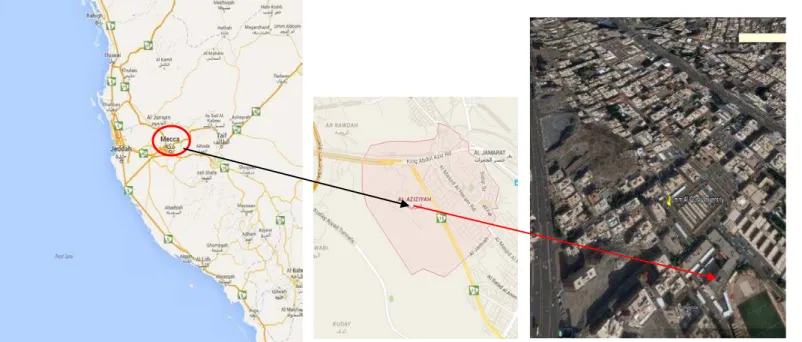
Makkah (the holly) city (21o 29 N, 39o 45 E),
Saudi Arabia, is located at an altitude of 277-m above the sea level and ~ 80 km inland, east of the red sea (Fig. 1). Makkah is an arid region characterized by
severe geographical and environmental conditions. Mountains disperse along over the city, representing
~ 90% of the city area with no permanent plant cover, hot weather, frequent dust storms and rare rain events.
Makkah city is always busy by people along over the year due to its religious importance for Muslim world.
The sampling site was chosen to be away from any direct anthropogenic activities. Sampling was taken at
the roof of a ~ 13 m high building of the Custodian of the Two Holy Mosques Institute for Hajj and Umrah Research, located inside the main campus of Umm Al-Qura University, Aziziyah region (Fig. 1). Aziziyah region is a commercial-residential area (Auer, 1978), characterized by heavy trafic, parking, shops, hotels,
and limited plant cover.
PM and black smoke samples were conducted
during the daytime (8.00 am - 20.00 pm) and the nighttime (20.00 pm - 8.00 am). Airborne microorganisms were conducted at three time-scales: in the morning
(8.00 am - 10 am), at the afternoon (13.00 pm - 16.00 pm), and in the evening (22.00 pm - 1.00 am) to
determine their variations along over the daytime. The samples were monthly collected on 20th - 30th days, between July and November 2014, where weather is
extremely hot and millions of people arrive Makkah to perform Umrah (Ramadan month) and Hajj (Hajj season).
2.2 Sampling of PM and black smoke
PM and black smoke samples were collected on
pre-weighted sterilized cellulose nitrate membrane ilters (0.45 μm pore size, 25 μm diameter) using open
face holders and vacuum pumps calibrated to draw 12.5 L/min and 1 L/min, respectively. The ilters of PM
were weighted and along with sampling time and low
rate, the concentrations were calculated. The amount
of light relected from black stain was measured using a relectometer (EEl-Model 43-Digital, UK), smoke
concentration was determined from look up tables (available from AEA Technology Environment), and
the equivalent smoke concentration was calculated
using the volume of air sampled and the reading of
the relectometer. PM and smoke concentrations were calculated and expressed as microgram per cubic meter of air (μg/m3).
2.3 Microorganisms associated PM
The ilters of PM were eluted in 10 ml sterilized distilled water containing 0.01% Tween 80 (Sigma-Aldrich, USA), and shaken well for 30-60 min. Aliquots
(0.5 ml) of the original sample were spread plated, in duplicate, onto the surface of Petri plates containing trypticase soya agar supplemented with 50 ppm
cyclohexamide, malt extract agar supplemented with 50
ppm chloramephenicol, and starch casein agar media
(BD, Sparks, USA) for counting of bacteria, fungi and
actinomycetes associated PM, respectively.
2.4 Airborne microorganisms
Airborne microorganisms were collected by using an Andersen two stage viable cascade impactor
sampler (TE-10-160, Tisch Environmental, OH, USA). It separates particles into two size ranges, ine (<8 μm) and coarse (>8 μm). The sampler was operated at a manufacturer recommended low rate 28.3 L/min for 5
min. Petri plates containing the previously mentioned agar media were used to count bacteria, fungi and actinomycetes, respectively. Two consecutive air samples were taken during each sampling event
(a total of 12 plates/event, 36 plates/day). The sampler was sterilized by using isopropyl alcohol between each
2.5 Microbiological analysis
Bacterial plates were incubated at 28oC for 2 days, while fungal and actinomycetes plates were incubated
at 28o
C for 5 - 7 and 7 - 15 days, respectively. In the case of using Andersen cascade sampler, the
positive-hole correction was applied to the raw colony forming
unit (CFU) recovered on each plate (Andersen, 1958). The resulting colonies were counted and the concentrations were calculated and expressed as CFU/m3. Fungal colonies were identiied to the genus
level, except Aspergillus to the species level.
Fungal isolates were identiied using macroscopic and
microscopic features according to literature (Raper and Fennel, 1977; Ellis, 1971; Barnett and Hunter, 1999).
2.6 Meteorological conditions
The hourly data of meteorological conditions were obtained from the Presidency of Meteorology and Environment (PME) Saudi Arabia. Meteorological
conditions signiicantly differed during the times of
the day. Table 1 shows the meteorological data of temperature (ToC), relative humidity (RH%), wind
speed (WS) and wind direction (WD). Temperature, relative humidity, and wind speed ranged within
30 - 39oC, 17.6 - 67.3% and 0 - 10 mph, respectively. Temperature and wind speed achieved the greatest records at the afternoon time while relative humidity in the evening time. The daily prevailing wind directions
were west-south-west (W-SW) and west-North West (W-NW) during the period of study.
2.7 Statistical analysis
The results were analyzed using descriptive
statics, range, mean, standard deviation and percentiles. Spearman’s rank correlation test was used to determine the relationships between PM and black smoke concentrations and meteorological conditions with
airborne microorganisms. Mann Whitney U test was used to ascertain the signiicance of differences between
PM, smoke, and airborne microbial concentrations
in different time scales. A probability of ≤ 0.05 was
considered significant. Non parametric static was used because environmental data were not normally distributed.
fine (<8 μm) and coarse (>8 μm Figure 1. Map of Makkah city showing the sampling site
ent time scales. A probability of ≤ 0.05 was
Time ToC RH% WS/ mph Prevailing WD
Morning (26-39)
[34±2.87])
(10-78) [30.3±18.2]
(0-8) [3.2±2.6]
N-NW/S-SW
Afternoon (35-46)
[40.9±2.45]
(9-56) [18.7±11.4]
(0-20) [11.1±5.7]
W-NW/W
Evening (29-37)
[33.2±2.1]
(18-79) [47.9±14]
(0-5) [2.6±1.2]
N-NW/NW
Daily (30-39)
[35.9±2.1]
(17.6-67.3) [32±13.3]
(0-10.3) [5.6±2.6]
W-SW/ W-NW.
(Range), [mean±SD]
84
Abdel Hameed A.A. et al. / EnvironmentAsia 10(1) (2017) 81-91
3. Results and Discussion
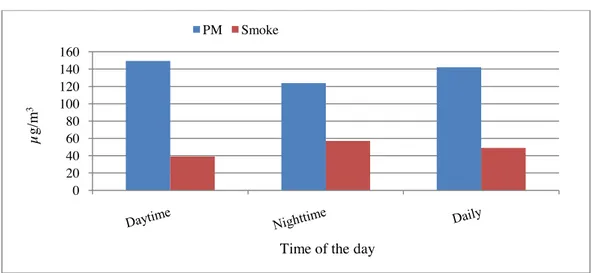
3.1 PM and smoke
PM and black smoke concentrations ranged
between 62.2 - 298.4 μg/m3 and 13.5 - 103 μg/m3, respectively. The average concentration of PM was
higher in the daytime (149.5 μg/m3
) while smoke in
the nighttime (57.03 μg/m3), (Fig. 2). Non-signiicant differences were found between concentrations of PM registered in the daytime and nighttime, however
signiicant difference was found between black smoke
concentrations (P = 0.036), higher concentration shifted toward the nighttime.
In the present study PM concentrations exceeded the World Health Organization limit value of 120 μg/m3 (WHO, 2000), as no-limit value is available for
Saudi Arabia. Generally Saudi Arabia has experienced
large amount of suspended dust (AlHarbi et al., 2014)
due to the nature of desert environment and frequent windblown dust storms (Grifin and Kellogg, 2004). Anthropogenic activities (traffic/ construction) signiicantly increase PM concentration in the daytime
but in the nighttime weather stability conditions and relatively higher relative humidity accelerate settlement of coarse particles, leaving smoke particles airborne a
longer period of time. Particle’s size determines whether
particle remains airborne or settles down (Fernstrom
and Goldblatt, 2013).
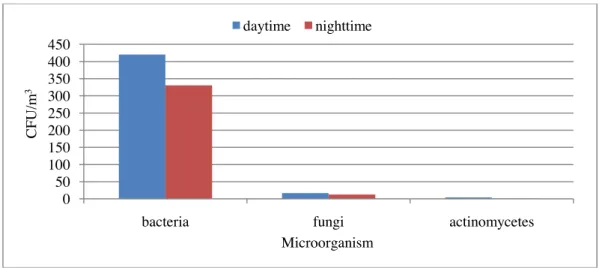
3.2 Microorganisms associated PM
PM provides nutrition and protection to the attached microorganisms; however composition of
PM may have toxic effects to microorganisms. Fig. 3
shows the mean concentrations of microorganisms associated PM in the daytime and nighttime. Microbial concentrations were higher in the daytime, with
bacteria-associated PM were the common parameters in the daytime (420.2 CFU/m3) and nighttime (330.7
CFU/m3). Actinomycetes were found in very low
concentrations, and fungi averaged 16.8 CFU/m3 and
12.9 CFU/m3
in the daytime and nighttime, respectively.
In the present study, microbial community associated
PM was low, achieving higher concentration in the
daytime. In general PM is considered a poor medium
for survival of the attached microorganisms in the arid environment, because PM is a poor nutrient medium; PM is mainly sand that may keep temperature high l o n g e r p e r i o d o f t i m e . H i g h e r m i c r o b i a l concentrations during the daytime may be attributed to higher PM concentrations due to high turbulences,
re-suspension of street dust and human activities (Abdel
Hameed et al., 2016). Bacteria are mainly correlated
to anthropogenic activities and fungi to biotic sources (Bowers et al., 2011). Moreover fungi and actinomycetes are typically autochthonous organisms (Alghamdi
et al., 2014), and ubiquitous in biosolid and organic
soil; and such conditions are less present in Makkah’s environment.
Figure 2. The mean concentrations of PM and black smoke during the period of study
0 20 40 60 80 100 120 140 160
µ
g/
m
3
Time of the day
Table 2. Spearman’s rank correlations between microorganisms-associated-PM with PM, smoke and meteorological conditions
Variable Daytime Nighttime
Bacteria Fungi Actinomycetes Bacteria Fungi Actinomycetes
PM 0.390* 0.104 -0.290 0.143 0.164 0.222
Smoke 0.017 0.154 -0.133 0.123 0.156 0.340
ToC 0.180 0.080 -0.200 0.580* 0.470* 0.146
RH% -0.070 0.056 -0.133 0.540* -0.050 -0.150
WS -0.020 -0.450* -0.006 -0.759* -0.210 0.130
*P ≤0.05
Table 2 shows Spearman’s rank correlations between microorganisms associated PM with variables including PM, black smoke and meteorological conditions. Positive correlations were found between bacteria and PM concentration as well as fungi and smoke concentration. Actinomycetes showed positive correlation with smoke at the nighttime and negative correlations with PM, black smoke and
meteorological conditions in the daytime. It is suggested
that the dominant actinomycete sources may be changed between the daytime and nighttime according to the prevailing wind directions. The nature and composition
of PM effectively inluence microbial survivability
than PM mass concentration.
PM, meteorological conditions, depth of the
mixing layer, particle size and time of the day may
synergistically affect microbial survivability in the atmosphere. Bacteria showed positive correlation with PM in the daytime, and with meteorological conditions
in the nighttime (Table 2). In general hot weather
conditions detrimentally affect microbial survivability.
Signiicant differences were found between fungal
concentrations registered in the daytime and nighttime
in Taiwan (Lin and Li, 1996). Hot weather increases
mycelia growth and reduces spore production (Damialis
et al., 2015). Fungi were found in low concentrations
in summer months (Sindt et al., 2016).
3.3 Airborne microorganisms
3.3.1 Overall culturable microbial concentrations
Airborne microorganisms varied over various
time of the day (Fig.4). The maximum microbial
concentration was found in the evening time and the
minimum at the afternoon time. Signiicant differences
(p ≤ 0.032) were found between total airborne microbial concentrations recovered in the evening
time and afternoon time. Breza-Boruta and Paluszak (2007) classiied the daily bacterial concentrations as moderately contaminated (>1000-3000 CFU/m3)
and uncontaminated (<1000 CFU/m3).The WHO
suggested 500 CFU/m3
as an acceptable limit
value of airborne fungal concentration (WHO, 1990). In the present study airborne microbial
concentrations were considered low, bacteria and
fungi did not exceed 3000 CFU/m3 and 500 CFU/m3, respectively.
Figure 3. Concentrations of microorganisms associated PM during the daytime and nighttime
a gi s gi s
* 164
156
0*
0 0 P ≤0.05
0 50 100 150 200 250 300 350 400 450
bacteria fungi actinomycetes
CF
U
/m
3
Microorganism
86
Abdel Hameed A.A. et al. / EnvironmentAsia 10(1) (2017) 81-91
Temporal variation of airborne microorganisms is important to understand their prevalence and
distribution pattern. In the present study airborne
microbial concentrations were relatively higher in the morning time compared to the afternoon time,
and achieved their maximum peak in the evening
time. Worldwide, the distribution patterns of airborne microorganisms are similar, showing two main peaks, one in the morning and the other in the evening (Burch and Levetin, 2002; Abdel Hameed et al., 2009; Fang
et al., 2007). Generally microorganisms are released
into the air under the effects of electrostatic and surface tension forces; human activities and environmental conditions (Jones and Harrison, 2004; Rossi et al., 2005). Turbulences help release of fungal spores in
the morning time and vertical mixing reduces their
concentrations at the afternoon time, while stability conditions in the nighttime allow spores to settle down, achieving a peak concentration in the evening time
(Rich and Waggoner, 1962). Solar radiation and lower
relative humidity may have detrimental effects on microbial survivability, particularly at noon time
(Royes, 1987). Desiccation (loss of water) of
microorganisms is found to be the greatest during the midday (Levetin, 1995), and in desert location the minimum bacterial concentrations were found at noon time (Tong and Lighthart, 1997).
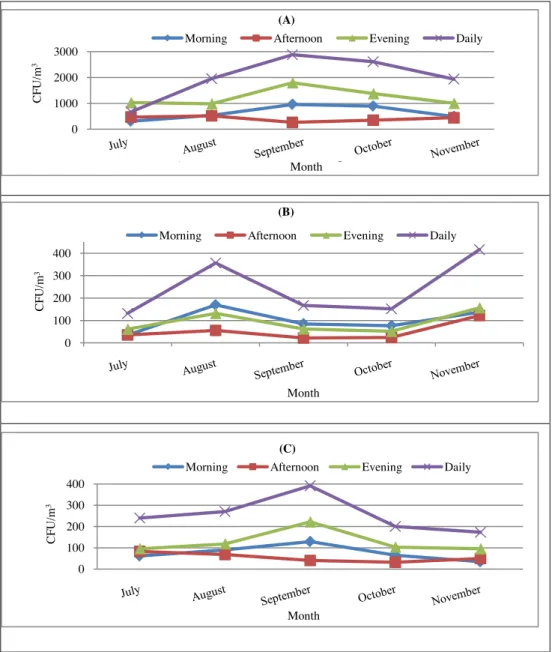
Fig. 5 shows the monthly variations of airborne microorganisms. The greatest concentrations of
airborne bacteria (1797.9 CFU/m3
) and actinomycetes
(222.2 CFU/m3) were found in month of September
(Hajj season) and in the evening daytime. This is due to large numbers of people visit Makkah to perform Hajj “Hajj is an annual Islamic pilgrimage to Makkah and
a mandatory religious duty for Muslims that must be carried out at least once in their lifetime” (Matthew,
2011). On the other hand airborne fungi achieved another trend, the maximum concentration (169.2
CFU/m3
) was found in the month of August and in the morning daytime. The morning peak of fungi
conirms that fungal spores are actively released due
to changes of bonding and surface tension forces, under the effects of sun heat and loss of water in the morning time.
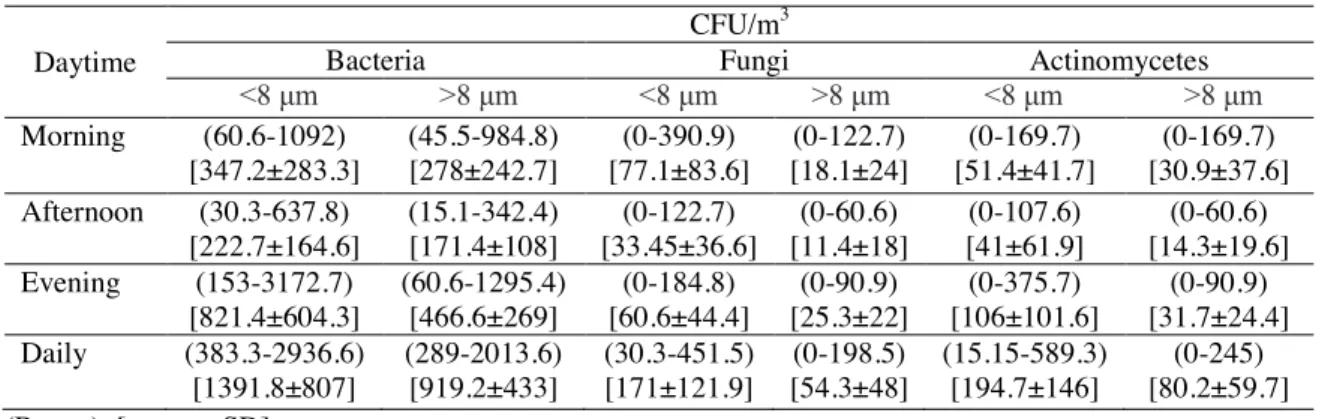
Table 3. Concentrations of ine and coarse size fractions of airborne microorganisms p ≤
Figure 4. Variations of total culturable airborne microorganism regarding time of the day
0 500 1000 1500 2000 2500
CF
U
/m
3
Time of the day
Bacteria Fungi Actinomycetes
Daytime
CFU/m3
Bacteria Fungi Actinomycetes
˂8µm ˃8 µm ˂8µm ˃8 µm ˂8µm ˃8 µm
Morning (60.6-1092)
[347.2±283.3]
(45.5-984.8) [278±242.7]
(0-390.9) [77.1±83.6]
(0-122.7) [18.1±24]
(0-169.7) [51.4±41.7]
(0-169.7) [30.9±37.6]
Afternoon (30.3-637.8)
[222.7±164.6]
(15.1-342.4) [171.4±108]
(0-122.7) [33.45±36.6]
(0-60.6) [11.4±18]
(0-107.6) [41±61.9]
(0-60.6) [14.3±19.6]
Evening (153-3172.7)
[821.4±604.3]
(60.6-1295.4) [466.6±269]
(0-184.8) [60.6±44.4]
(0-90.9) [25.3±22]
(0-375.7) [106±101.6]
(0-90.9) [31.7±24.4]
Daily (383.3-2936.6)
[1391.8±807]
(289-2013.6) [919.2±433]
(30.3-451.5) [171±121.9]
(0-198.5) [54.3±48]
(15.15-589.3) [194.7±146]
(0-245) [80.2±59.7] (Range), [mean ± SD]
ine size fraction (≤ 8 µm) was higher than coarse fraction (≥ 8 µm).
≤ 8 µm has a sedimentation velocity in still air ~
≥ 3.1 µm (Jon
Sadyś articles ≥ 6 µm tend to deposit in the
upper respiratory tract and particles ≤ 2 µm deposit in alveoli (Darquenne, 2012). Particles ≤10 be penetrated deeper into the respiratory tract and particles ≥ 10 µm deposited on upper
μm <8 μm <8 μm
Figure 5. Monthly mean-concentrations of airborne bacteria (A), fungi (B) and actinomycetes (C)
0 1000 2000 3000
C
FU
/m
3
Month (A)
Morning Afternoon Evening Daily
0 100 200 300 400
C
FU
/m
3
Month (B)
Morning Afternoon Evening Daily
0 100 200 300 400
C
FU
/m
3
Month (C)
Morning Afternoon Evening Daily
3.3.2 Microbial size fraction
Airborne microorganisms were detected in two
size fractions (Table 3). The percentage of ine size fraction (≤ 8 μm) was higher than the coarse fraction (≥ 8 μm). The ine fractions represented ~60%, 75.9% and 70.8% of the total bacteria, fungi and actinomycetes
concentrations, respectively. The greatest percentages
of ine fraction of bacteria (63%) and actinomtycets (77%) were found in the evening time, while fungi (80%) in the morning time. Coarse particles are settled down faster than ine particles, and long range transport of microorganisms increases ine particle fraction. In the present study sampling point was located at ~ 13 m height building in the main campus of the University, the height of building inluences particle size distribution due to sedimentation effect (Clauß, 2015). Moreover
larger particles are mainly of local origin, because
particle ≤ 8 μm has a sedimentation velocity in still air
~ 0.2 cms-1 and a 3.3 μm particle has a sedimentation velocity of 0.002 cms-1 (Lighthart and Stetzenbach,
1994), indicating that sources of bacteria and fungi are far away from the sampling site.
Fine particles are linked to microorganisms (Huffman et al., 2013; Saari et al., 2015), and up to
80% of bacteria are particles ≥ 3.1 μm (Jones and Harrison, 2004). In addition high temperature reduces microbial sizes (Kauserud et al., 2012) due to loss
of cell wall water (Cole and Cook, 1998), but loss of
water may detrimentally affect microbial survivability.
Particle size determines deposition and dispersion of
microbial particle in the atmosphere and human
respiratory system (Chen et al., 2012; Sadyś et al.,
2016). Particles ≥ 6 μm tend to deposit in the upper respiratory tract and particles ≤ 2 μm deposit in alveoli (Darquenne, 2012). Particles ≤10 μm can be penetrated deeper into the respiratory tract and particles ≥ 10 μm deposited on upper respiratory tract (Nicas
et al., 2005). In the present study the presence of ine
fraction in higher percentages raises a question about
its health effects.
88
Abdel Hameed A.A. et al. / EnvironmentAsia 10(1) (2017) 81-91
3.3.3 Correlations between airborne microorganisms and meteorological conditions
Table 4 shows Spearman’s rank correlations between airborne microbial parameters and meteorological conditions. The correlations varied depending on microbial type and sampling time. A
moderate signiicant correlations were found between
fungi and relative humidity (r = 0.48), and actinomycetes and temperature (r = 0.47). Wind direction moderately
inluenced actinomycetes concentrations in the daytime
(r = 0.31) and in the evening time (r = 0.47). No
signiicant correlations were found between airborne
bacteria and meteorological conditions; however
wind speed showed a signiicant negative correlation
(r = -0.41) with bacteria in the morning time, as bacteria
may be released into the atmosphere under convection
effect (effect of heat) in the morning time. In general,
wind speed is a dilution factor and helps transport
of microorganisms (Smith, 1966). In the present study wind speed ranged between 0 - 20 mph, hence
microorganisms may take longer time to transfer from
their sources to sampling point, and consequently the
age and decay rate of microorganisms may be increased. Lin and Li (2000) concluded that wind velocity was
a dilution factor of bioaerosols at ≤ 5 m/s and was a release factor at ≥ 5 m/s.
It is suggested that meteorological conditions
synergistically affected microbial survivability, moreover human activities, geographical factors and timing of microbial growth may mask the effects of meteorological conditions on microbial survivability (Adams et al., 1986); and the extremes of these factors
differ from place to place. Interactions of these factors/variables may interpret the complex (unclear)
correlations between microorganisms and meteorological conditions in the present study.
≤ ≥
Mo: morning; Aft: afternoon; Ev: evening, *P≤0.05
ng oon ng y e e
45 11 23 23 01 23 64
84 915
86 54 05 53 79 79 32 84
26 75 32
Variable Bacteria Fungi Actinomycetes Mo Aft Ev Daily Mo Af Ev Daily Mo Af Ev Daily ToC 0.016 0.24 0.27 0.17 -0.08 0.01 -0.06 -0.03 0.025 0.33 0.47* 0.36 RH% 0.131 -0.04 -0.014 0.17 0.45* 0.39* 0.32 0.48* -0.08 0.14 0.123 -0.08 WS/mph -0.41* -0.01 -0.03 -0.20 -0.4* -0.1 0.02 -0.39* -0.11 0.06 -0.07 0.04 WD -0.03 -0.11 0.20 0.123 0.147 -0.21 -0.14 -0.13 0.06 0.13 0.47* 0.31
Table 4. Spearman’s rank correlations between airborne microorganisms and meteorological conditions
≤ ≥
P≤0.05
Fungus
%
Airborne fungi Fungi associated-PM
Morning Afternoon Evening Daily Daytime Nighttime
Aspergillus 68.28 55.3 57.04 61.45 73.64 67.87
Asp. fumigatus 1.83 2.12 2.48 2.11 7.11 1.08
Asp. versicolor 9.75 13.83 4.96 9.23 -
-Asp. flavus 16.46 2.12 4.96 9.23 8.37 7.94
Asp. niger 23.78 27.66 37.2 29.01 30.96 32.5
Asp. nidulanus 12.2 6.38 7.44 9.23 -
-Other Asp. species 4.26 3.19 - 2.64 27.2 26.35
Alternaria 1.83 3.19 4.13 2.9 0.42
-Aureobasidium 1.83 4.25 - 1.84 1.67 3.97
Cladosporium 6.1 10.63 8.26 7.915 -
-Curvularia - 1.06 1.65 0.8 -
-Emericella 6.7 7.44 6.61 6.86 10.04 10.47
Eurotium 5.49 5.32 5.78 5.54 3.76 2.12
Fusarium 1.22 1.06 0.82 1.05 2.93 0.36
Geotrichum 0.6 - 0.82 0.53 -
-Paecilomyces - - 2.48 0.79 -
-Penicillium 1.83 - - 0.79 - 0.72
Phoma 0.6 2.12 1.65 1.32 1.67 0.72
Rhizomucor 2.44 2.12 0.82 1.84 -
-Rhizopus - - - - 0.42 1.81
Scopularopsis - - 0.82 0.26 -
-Sterile hyphae 3.05 6.38 5.78 4.75 5.44 11.91
Unkown - 1.06 3.3 1.32 -
-Total isolates 164 94 121 379 239 277
- Not detected
3.3.4 Identiication of fungi
Fungi are common biological particles and their concentrations and types varied from place to place, depending on microenvironment conditions. Fungal types are used as indicator of microenvironment characters. Fungi cause allergic symptoms even if their
counts are low (Grinn-Gofroń and Bosiacka, 2015). In the present study fungal biodiversity was low with
Aspergillus and its telemorphs (Emericella and
Eurotium) were the common genera (Table 5).
Asp. fumigatus, A. lavus, Asp. niger and sterile hyphae
were frequently found in the collected samples.
Penicillium was detected in the morning time while
Paecilomyces and Scopularopsis at the nighttime and
Rhizopus was exclusively found associated PM.
The worldwide abundance fungi e.g., Alternaria,
Cladosporium, Fusarium and Penicillium were found
in low incidence. Hot weather and barren region are not
suitable environments for fungal growth (Cventić and Pepeljnjak, 1997). Penicillium and Cladosporium are
sensitive to temperature (Pyrri and Kapsanaki-Gotsi,
2007). A negative trend was found between increase air temperature and Cladosporium counts in Greece
(Damialis et al., 2015). Alternaria proliferates in
the presence of suitable humidity (80 - 90%) and
temperature, and presence of vegetation debris
(Humpherson-Jones and Phelps, 1989), these conditions
are less present in Makkah city. The results in the present study agree with those have been reported in Makkah
city (Abdel Hameed and Habeeballah, 2013) and
Jeddah city (Alghamdi et al., 2014) who found fungi in low biodiversity with Aspergillus was the common genus.
4. Conclusion
Concentrations of microorganisms in the air state and/or associated PM were low. Airborne
microorganisms showed different prevalence patterns
achieving a signiicant peak concentration in the evening
time. Microorganisms associated PM achieved higher concentrations in the daytime than the nighttime. The greatest concentrations of airborne bacteria and actinomycetes were found in the evening time while fungi in the morning time, they had different mode
of release. Fine particles constituted ~ 60 - 75.9% of
total microbial concentrations. Bacteria positively correlated with PM in the daytime and meteorological conditions in the nighttime. Temperature was the crucial factor affecting survivability of microorganisms associated PM; and relative humidity was the main factor affecting survivability of airborne fungi. Low microbial community in Makkah’s atmosphere is due
to harsh environmental conditions that preselected
microbial taxa to survive. Long term study on
distribution patterns of airborne microorganisms in relation to geographical location, human activity and dominant sources should be studied in the future.
Acknowledgement
This study was funded by the National Research Centre, Dokki, Giza, Egypt and the Custodian of the Two Holly Mosques Institute for Hajj and Umrah Research, Umm Al Qura University, Saudi Arabia
Conlict of interest: The author declares that they have noconlict of interest.
References
Abdel Hameed AA, Habeeballah T. Air microbial contamination at the holy mosque, Makkah, Saudi Arabia. Current World Environment 2013; 8 (2): 179-87. Abdel Hameed AA, Ibrahim YH, Said Mounir, Habeeballah
T, Elmorsy TH. Characterization of street dust nearby the holy mosques in Ramadan and Hajj seasons, Saudi Arabia. EnvironmentAsia 2016; 9 (2): 1-9.
Abdel Hameed AA, Khoder MI, Yuosra S, Osman AM, Ghanem S. Diurnal distribution of airborne bacteria and fungi in the atmosphere of Helwan area, Egypt. Science of the Total Environment 2009; 407(24): 6217-22. ACGIH, American Conference of Governmental Industrial
Hygienists. Guidelines for the assessment of bioaerosols in the indoor environment. ACGIH, Ohio, Cincinnati. 1999.
Adams GC, Gottwald TR, Leach CM. Environmental factors initiating liberation of conidia of powdery mildews. Phytopathology 1986; 76(11): 1239-45.
Alghamdi MA, Shamy M, Redal MA, Khoder M, Hameed Awad A, Elserougy S. Microorganisms associated particulate matter: a preliminary study. Science of the Total Environment 2014; 479-480: 109-16.
Alharbi BH, Pasha MJ, Tapper N. Assessment of ambient air quality in Riyadh City, Saudi Arabia. Current World Environment 2014; 9(2): 227-36.
Andersen AA. New sampler for the collection, sizing and enumeration of viable airborne particles. Journal of Bacteriology 1958; 76(5): 471-84.
Auer AH. Correlations of land use and cover with meteorological anomalies. Journal of Applied Meteorology 1978; 17: 636-43.
Barnett HL, Hunter BB. Illustrated genera of imperfect fungi. 4th ed. St. Paul, MN: the American Phytopathological Society (APS). 1999; 218.
Bowers RM, Sullivan AP, Costello EK, Collett JL, Knight R, Fierer N. Sources of bacteria in outdoor air across cities in the Midwestern United States. Applied and Environmental Microbiology 2011; 77(18): 6350-56. Breza-Boruta B, Paluszak Z. Inluence of water treatment
90
Abdel Hameed A.A. et al. / EnvironmentAsia 10(1) (2017) 81-91
Burch M, Levetin E. Effects of meteorological conditions on spore plumes. International Journal of Biometeorology 2002; 46(3): 107-17.
Burrows SM, Elbert W, Lawrence MG, Pöschl U. Bacteria in the global atmosphere-Part 1: Review and synthesis of literature data for different ecosystems. Atmospheric Chemistry and Physics 2009; 9(3): 10777-827. Chen X, Ran P, Ho K, Lu W, Li B, Gu Z, Song C, Wang, J.
Concentrations and size distributions of airborne microorganisms in Guangzhou during summer. Aerosol and Air Quality Research 2012; 12(6): 1336-44. Clauß M. Particle size distribution of airborne micro-organisms
in the environment - a review. Applied Agriculture Forestry Research 2015. doi: 10.3220/LBF1444216736000 Cole EC, Cook CE. Characterization of infectious aerosols in
health care facilities: an aid to effective engineering controls and preventive strategies. American Journal of Infection Control 1998; 26(4): 453-64.
Cventić Z, Pepeljnjak S. Distribution and mycotoxin-producing ability of some fungal isolates from the air. Atmospheric Environment 1997; 31(3): 491-95.
Dales RE, Cakmak S, Judek S, Dann T, Coates F, Brook JR, Burnett RT. The role of fungal spores in thunderstorm asthma. Chest 2003; 123(3): 745-50.
Damialis A, Mohammad AB, Halley JM, Gange AC. Fungi in a changing world: growth rates will be elevated, but spore production may decrease in future climates. International Journal of Biometeorology 2015; 59(9): 1157-67.
Darquenne C. Aerosol deposition in health and disease. Journal of Aerosol Medicine and Pulmonary Drug Delivery 2012; 25(3): 140-47.
Ellis M. Dematiaceous hyphomycetes. The Western Press Ltd: London and Reading Commonwealth Mycological Institute Kew, Surrey, UK. 1971; 608.
Fang Z, Ouyang Z, Zheng H, Wang X, Hu L. Culturable airborne bacteria in outdoor environments in Beijing, China. Microbial Ecology 2007; 54(3): 487-96. Fernstrom A, Goldblatt M. Aerobiology and its role in the
transmission of infectious diseases. Journal of Pathogens 2013; Article ID 493960: 1-13.
Gao M, Yan X, Qiu T, Han M, Wang, X. Variation of correlations between factors and culturable airborne bacteria and fungi. Atmospheric Environment 2016; 128: 10-19.
Garrison VH, Shinn EA, Foreman WT, Grifin DW, Holmes CW, Kellogg CA, Majewski MS, Richardson LL, Ritchie KB, Smith GW. African and Asian dust: from desert soils to coral reefs. BioScience 2003; 53(5): 469-80. Grifin DW, Kellogg CA. Dust storms and their impact on
ocean and human health: dust in earth’s atmosphere. EcoHealth 2004; 1(3): 284-95
Grifin DW, Kellogg CA, Garrison VH, Lisle JT, Borden TC, Shinn EA. Atmospheric microbiology in the northern Caribbean during African dust events. Aero biologia 2003; 19(3): 143-57
Grinn-Gofroń A, Bosiacka B. Effects of meteorological factors on the composition of selected fungal spores in the air. Aerobiologia 2015; 31(1): 63-72.
Huffman JA, Prenni AJ, DeMott PJ, Pöhlker C, Mason RH, Robinson NH, Fröhlich-Nowoisky J, Tobo Y, Després VR, Garcia E, Gochis DJ, Harris E, Müller-Germann I, Ruzene C, Schmer B, Sinha B, Day DA, Andreae MO, Jimenez JL, Gallagher M, Kreidenweis SM, Bertram AK, Pöschl U. High concentrations of biological aerosol particles and ice nuclei during and after rain. Atmospheric Chemistry and Physics 2013; 13: 6151-64.
Humpherson-Jones FM, Phelps K. Climatic factors inluencing spore production in Alternaria brassicae and Alternaria brassicicola. Annals of Applied Biology 1989; 114(3): 449-58.
Jaenicke R. Abundance of cellular material and proteins in the atmosphere. Science 2005; 308(5718): 73.
Jones AM, Harrison RM. The effects of meteorological factors on atmospheric bioaerosol concentrations-a review. Science of the Totconcentrations-al Environment 2004; 326 (1-3): 151-80.
Kauserud H, Heegaard E, Büntgen U, Halvorsen R, Egli S, Senn-Irlet B, Krisai-Greihuber I, Dämon W, Sparks T, Nordén J, Høiland K, Kirk P, Semenov M, Boddy L, Stenseth NC. Warming-induced shift in European mushroom fruiting phenology. Proceedings of the National Academy of Sciences of the United States of America 2012; 109(36): 14488-93.
Kulkarni P, Baron PA, Willeke K. Introduction to aerosol characterization. In: Aerosol measurement: principles, techniques, and applications (Ed: Hoboken NJ). 3rd ed. John Wiley & Sons, Inc., 2011.
Levetin E. Fungi. In: Bioaerosols (Ed: Burge HA). Boca Raton, Fla: CRC. 1995; 87-120.
Levetin E, Dorsey K. Contribution of leaf surface fungi to the air spora. Aerobiologia 2006; 22(1): 3-12.
Lighthart B. Physics of microbial bioaerosols. In: Atmospheric microbial aerosols: theory and applications (Eds: Lighthart B, Mohr AJ). Chapman and Hall,
New York, USA. 1994; 5-27.
Lighthart B, Stetzenbach LD. Distribution of microbial bioaerosol. In: Atmospheric microbial aerosols: theory and application (Eds: Lighhart B, Mohr AJ). 1st ed. Chapman and Hall, New York 10119, USA. 1994. Lin WH, Li CS. Size characteristics of fungus allergens in
the subtropical climate. Aerosol Science and Technology 1996; 25(2): 93-100.
Lin WH, Li CS. Associations of fungal aerosols, air pollutants, and meteorological factors. Aerosol Science and Technology 2000; 32(4): 359-68.
Mashat B. Indoor and outdoor microbial aerosols at the holy mosque: a case study. Atmospheric Pollution Research 2015; 6(6): 990-96.
Matthew L. Islamic beliefs, practices, and cultures. Marshall Cavendish Corporation. 2011; 86.
Morris CE, Sands DC, Glaux C, Samsatly J, Asaad S, Moukahel AR, Gonçalves FLT, Bigg EK. Urediospores of rust fungi are ice nucleation active at >-10 o
C and harbor ice nucleation active bacteria. Atmospheric Chemistry and Physics 2013; 13: 4223-33.
Nicas M, Nazaroff WW, Hubbard A. Toward understanding the risk of secondary airborne infection: emission of respirable pathogens. Journal of Occupational and Environmental Hygiene 2005; 2(3): 143-54.
Nicholson KW. A review of particle resuspension. Atmospheric Environment 1988; 22(12): 2639-51. Pyrri I, Kapsanaki-Gotsi E. A comparative study on the
airborne fungi in Athens, Greece, by viable and non-viable sampling methods. Aerobiologia 2007; 23(1): 3-15.
Raper KP, Fennel DIRE. The genus Aspergillus. Krieger Publishing Company; Huntington, New York, USA. 1977.
Rich S, Waggoner PE. Atmospheric concentration of Cladosporium spores. Science 1962; 137(3534): 962-65. Rossi V, Bugiani R, Giosué S, Natali P. Patterns of airborne
conidia of Stemphylium vesicarium, the causal agent of brown spot disease of pears, in relation to weather conditions. Aerobiologia 2005; 21(3): 203-16.
Royes VIJ. Some components of the air spora in Jamaica and their possible medical application. Grana 1987; 26(2): 151-57.
Ryan PH, Bernstein DI, Lockey J, Reponen T, Levin L, Grinshpun S, Villareal M, Hershey GK, Burkle J, LeMasters G. (2009). Exposure to traffic-related particles and endotoxin during infancy is associated with wheezing at age 3 Years. American Journal of Respiratory and Critical Care Medicine 2009; 180(11): 1068-75.
Saari S, Niemi JV, Rönkkö T, Kuuluvainen H, Järvinen A, Pirjola L, Aurela M, Hillamo R, Keskinen J. Seasonal and diurnal variations of fluorescent bioaerosol concentration and size distribution in the urban environment. Aerosol and Air Quality Research 2015; 15(2): 572-81.
Sadyś M, Kennedy R, West JS. Potential impact of climate change on fungal distributions: analysis of 2 years of contrasting weather in the UK. Aerobiologia 2016; 32(1): 127-37
Shaffer BT, Lighthart B. Survey of culturable airborne bacteria at four diverse locations in Oregon: urban, rural, forest, and coastal. Microbial Ecology 1997; 34(3): 167-77.
Sindt C, Besancenot JP, Thibaudon M. Airborne Cladosporium fungal spores and climate change in France. Aerobiologia 2016; 32(1): 53-68.
Sippula O, Rintala H, Happo M, Jalava P, Kuuspalo K, Virén A, Leskinen A, Markkanen A, Komppula M, Markkanen P, Lehtinen K, Jokiniemi J, Hirvonen MR. Characterization of chemical and microbial species from size-segregated indoor and outdoor particulate samples. Aerosol and Air Quality Research 2013; 13(4): 1212-30.
Smith RS. The liberation of cereal stem rust uredospores under various environmental conditions in a wind tunnel. Transactions of the British Mycological Society 1966; 49(1): 33-41.
Tao Y, Mi S, Zhou S, Wang S, Xie X. Air pollution and hospital admissions for respiratory diseases in Lanzhou, China. Environmental Pollution 2014; 185: 196-201. Tong Y, Lighthart B. Solar radiation has a lethal effect on
natural populations of culturable outdoor atmospheric bacteria. Atmospheric Environment 1997; 31(6): 900.
Vélez-Pereira AM, De Linares C, Delgado R, Belmonte J. Temporal trends of the airborne fungal spores in Catalonia (NE Spain), 1995-2013. Aerobiologia 2016; 32(1): 23-37.
WHO. Indoor air quality: biological contaminants. European Series No. 31. Copenhagen: World Health Organization, Regional Publications. 1990.
WHO. Guidelines for air quality. Geneva: World Health Organization. 2000.
Received 5 September 2016 Accepted 7 October 2016
Correspondence to
Dr. Abdel Hameed A.A. Air Pollution Department, National Research Centre, Dokki, Giza,
Egypt