Submitted7 April 2016 Accepted 17 August 2016 Published8 September 2016 Corresponding author Ana E. Escalante,
Academic editor Budiman Minasny
Additional Information and Declarations can be found on page 14
DOI10.7717/peerj.2459
Copyright 2016 Pajares et al.
Distributed under
Creative Commons CC-BY 4.0 OPEN ACCESS
Spatial heterogeneity of physicochemical
properties explains differences in
microbial composition in arid soils from
Cuatro Cienegas, Mexico
Silvia Pajares1,2, Ana E. Escalante3, Ana M. Noguez4, Felipe García-Oliva5,
Celeste Martínez-Piedragil5, Silke S. Cram6, Luis Enrique Eguiarte4and
Valeria Souza4
1Instituto de Ciencias del Mar y Limnología, Unidad Académica de Ecología y Biodiversidad Acuática, Universidad Nacional Autónoma de México, Mexico City, Mexico
2Departamento de Procesos y Tecnología, Universidad Autónoma Metropolitana, Unidad Cuajimalpa, Mexico City, Mexico
3Instituto de Ecología, Laboratorio Nacional de Ciencias de la Sostenibilidad, Universidad Nacional Autónoma de México, Mexico City, Mexico
4Instituto de Ecología, Departamento de Ecología Evolutiva, Universidad Nacional Autónoma de México, Mexico City, Mexico
5Instituto de Investigaciones en Ecosistemas y Sustentabilidad, Universidad Nacional Autónoma de México, Morelia, Michoacán, Mexico
6Instituto de Geografía, Universidad Nacional Autónoma de México, Mexico City, Mexico
ABSTRACT
Arid ecosystems are characterized by high spatial heterogeneity, and the variation among vegetation patches is a clear example. Soil biotic and abiotic factors associated with these patches have also been well documented as highly heterogeneous in space. Given the low vegetation cover and little precipitation in arid ecosystems, soil microorganisms are the main drivers of nutrient cycling. Nonetheless, little is known about the spatial distribution of microorganisms and the relationship that their diversity holds with nutrients and other physicochemical gradients in arid soils. In this study, we evaluated the spatial variability of soil microbial diversity and chemical parameters (nutrients and ion content) at local scale (meters) occurring in a gypsum-based desert soil, to gain knowledge on what soil abiotic factors control the distribution
of microbes in arid ecosystems. We analyzed 32 soil samples within a 64 m2plot and:
(a) characterized microbial diversity using T-RFLPs of the bacterial 16S rRNA gene, (b) determined soil chemical parameters, and (c) identified relationships between microbial diversity and chemical properties. Overall, we found a strong correlation
between microbial composition heterogeneity and spatial variation of cations (Ca2,
K+) and anions (HCO−3, Cl−, SO24−) content in this small plot. Our results could be attributable to spatial differences of soil saline content, favoring the patchy emergence of salt and soil microbial communities.
SubjectsBiodiversity, Ecology, Microbiology, Soil Science
INTRODUCTION
Spatial heterogeneity is an inherent feature of soils and has significant functional implications, including the fact that different soil patches and aggregates can present variation in nutrient transformation rates (e.g., respiration, mineralization, nitrogen fixation) (Noguez et al., 2008;Strickland et al., 2009;Zeglin et al., 2009), particularly when the activities and distribution of microorganisms are considered. The scale at which environmental variation is considered in association with microbial diversity varies greatly,
from tens to thousands of kilometers, to meters and even at the microscale (Vos et al.,
2013). Depending on the spatial scale at which microbial diversity is studied, different envi-ronmental parameters and ecological processes may be associated to the observed diversity distribution (Martiny et al., 2011). At large spatial scales (tens to thousands of kilometers), soil microbial community structure is correlated to edaphic variables, such as soil pH (Fierer & Jackson, 2006), temperature (Garcia-Pichel et al., 2013), and moisture content (Angel et al., 2010). At smaller scales (tens of meters), plant communities have been shown to have a strong influence on soil microbial diversity through interactions within the rhizosphere (Berg & Smalla, 2009;Hartmann et al., 2009;Ben-David et al., 2011). However, little is known about the effects of small-scale habitat variation on the spatial patterns of microbial diversity and its interactions with soil abiotic properties (Maestre et al., 2005).
Arid soils have a particularly heterogeneous spatial distribution of abiotic properties (Schlesinger et al., 1996), particularly in nutrient content. Vegetation patches, deemed ‘‘fertility or resource islands,’’ are also scarce and sparsely found in arid environments (Cross & Schlesinger, 1999;Hirobe et al., 2001;Schade & Hobbie, 2005). At the same time, there are large areas deprived of vegetation and severely limited in nutrients and water (Evans et al., 2001;Belnap et al., 2005), in which microbial communities, often referred to as ‘‘biological soil crusts’’ or ‘‘biocrusts,’’ are the main drivers of energy input and biogeochemical processes (Titus, Nowak & Smith, 2002;Belnap, 2003;Maestre et al., 2005;
Housman et al., 2007;Castillo-Monroy et al., 2010;Bachar, Soares & Gillor, 2012). Biocrusts contribute actively to natural small-scale soil heterogeneity, not only in terms of biological diversity but also in relation to soil function, including nutrient cycling and physicochemical properties associated with their spatial structure (Maestre et al., 2005).
In the present study, we aim to determine the spatial heterogeneity of microbial diversity and soil chemical parameters occurring in an arid soil of a hot desert ecosystem, in order to contribute with information and gain understanding into the aspects of the soil environment that are more strongly associated with differences in microbial community distribution in these kind of soils. We hypothesize that the spatial heterogeneity in chemical properties, previously reported for desert soils (Schlesinger et al., 1996), will be reflected in microbial diversity distribution at a yet unexplored local scale (order of meters). Thereby, in this study we: (a) characterize microbial community structure, (b) determine soil physicochemical and biochemical parameters and, (c) identify relationships among microbial community structure and chemical soil properties at a local spatial scale.
The study site, Cuatro Cienegas Basin (CCB), is located in a desert ecosystem in the middle of the Chihuahuan desert in Mexico. This is a gypsum-based system and is one of the most oligotrophic environments in the world. In contrast, the microbial diversity is very high in comparison to other arid soils (López-Lozano et al., 2012), providing the opportunity to investigate the spatial relationship between chemical distribution and microbial community structure, as it has been done in other oligotrophic arid ecosystems of Antarctica (Zeglin et al., 2011;Geyer et al., 2013).
MATERIALS AND METHODS
Study areaThe study site is locally known as ‘‘Churince system.’’ It is located in the western part of the CCB (26◦50′N, 102◦08′W;Fig. 1) at 740 m a.s.l. The system consists of a spring, an intermediate lagoon, and a dry desiccation lagoon connected by short shallow creeks. The annual precipitation in the area is less than 250 mm, occurring mainly from May
to October. Temperatures fluctuate from 0 ◦C in January to 45◦C in July, with a mean
annual temperature of 21.4◦C (CCB weather station). The vegetation is mainly halophile
and gypsophile grasslands (Challenger, 1998). The area is also dominated by physical and
biological soil crusts. The soil is predominantly basic, rich in calcium and sulfates, but very
poor in nutrients, and belongs to Gypsisol type (IUSS Working Group WRB, 2015).
Sampling design
The sampling plot was approximately at 50 m from the dry desiccation lagoon. The gypsophile grassDistichlis spicatacovered 10% of the plot (Fig. 1) and it was the only species present in this area. Physical and biological crusts occupied the open areas between plants. In order to explore the spatial relationship between soil chemical distribution and
microbial community structure at local scale, we used a plot of 8 m×8 m that consisted of
a nested system of four quadrats (A–Dquadrats) of 16 m2, which were divided in eight 1 m2 ‘‘replicates,’’ following a checkerboard pattern (Fig. 1). Vegetation cover for each sampling ‘‘replicate’’ or site (1 m2) was registered qualitatively in order to have further ecological context for the results. In August 2007, we collected soil samples (500 g) from the first 10 cm at each site, to a total of 32 samples (eight samples for each 4 m2quadrat), under the SEMARNAT collection permits 06590/06 and 06855/07. Soil samples were homogenized
Figure 1 Sampling scheme.An 8×8 m plot was selected in the Churince System within the Cuatro Cienegas Basin, México. A checkerboard sampling scheme was followed (Noguez et al., 2005) to a total of 32 samples, eight for each of the four quadrats (A,B,C, andD). Soil parameters were determined for the 32 samples. Numbers with asterisks indicate samples that were also analyzed for microbial diversity. Green colored areas indicate presence of vegetation.
analyses) and at 4◦C (for chemical analyses), respectively. Analyses were performed upon
arrival to the laboratory.
Physicochemical and biochemical analyses
Soil samples were air dried and sieved through a 2 mm mesh prior to physicochemical and biochemical determinations, which were performed twice for each sample. Total carbon
(TC) was determined by dry combustion and coulometric detection (Huffman, 1977)
using a Total Carbon Analyzer (TOC, UIC Mod. CM5012; UIC, Inc., Chicago, USA). For total nitrogen (TN) and phosphorus (TP), the samples were acid digested and determined colorimetrically using a Bran-Luebbe Auto-analyzer III (Germany), according to Bremner (Bremmer & Mulvaney, 1982) and Murphy & Riley (Murphy & Riley, 1962), respectively.
Inorganic N forms (NH+4 and NO−3) were extracted with 2 M KCl after shaking for 30 min,
followed by filtration through a Whatman #1 filter, and measured colorimetrically by the phenol–hypochlorite method. Inorganic P (Pi) was extracted with sodium bicarbonate,
and determined colorimetrically by the molybdate-ascorbic acid method (Murphy & Riley,
1962). Dissolved organic C (DOC), N (DON) and P (DOP) were extracted with deionized
water after shaking for 1 h and then filtered through a Whatman #42 filter. DOC was determined with a TOC module for liquids (UIC-Coulometrics), while DON and DOP were acid digested and measured colorimetrically.
(HCO−3, Cl−, SO2−
4 ), soil samples were shaken with deionized water for 19 h, centrifuged
at 2,500 rpm and filtered through a Whatman #42 filter. Ca2+and Mg2+were analyzed by
atomic absorption spectrophotometry with an air/acetylene flame (Varian SpectrAA 110),
while Na+and K+by flamometry (flame photometer Corning PFP7) (Bower, Reitemeier &
Fireman, 1972). Anions were determined by liquid chromatography (Waters Mod. 1525) with a mobile phase of borate sodium glucanate (Bower, Reitemeier & Fireman, 1972).
Molecular analyses
Microbial community structure was characterized using terminal restriction fragment length polymorphisms (T-RFLPs) of bacterial 16S rRNA gene.
Genomic DNA was extracted from the soil samples using the Soil Master DNA Extraction Kit (Epicentre Biotechnology), with an additional previous step based on the fractionation centrifugation technique in order to reduce the high salt concentration (Holben et al., 1988). After extraction, genomic DNA was cleaned with Microcon columns (Fisher Scientific) with the purpose of removing any substance that could inhibit PCR amplification. These protocol modifications gave the best results from various methodologies tested; however, we were only able to amplify the 16S rRNA gene from 21 out of the
32 soil sampling sites (amplicons obtained in each quadrat:A=3;B=3;C=7;D=8).
The low yield in the DNA amplification could be attributed to molecular applications
inhibitors of unknown nature (López-Lozano et al., 2012).
Amplification of the bacterial 16S rRNA genes was carried out in a final volume of 50µL
containing: 0.2µM of each fluorescently labeled domain-specific primers (VIC-27F and
FAM-1492R) (Lane, 1991), 0.2 mM of each dNTP, 1 U of Taq Platinum DNA polymerase
(Invitrogen), 2.5µL DMSO, 2.5µL BSA, 1 mM MgCl2, 1 mM buffer, and 20 ng of DNA.
Five independent PCR reactions were performed for each sample with the following
program: 5 min at 94◦C; 30 cycles at 94 ◦C for 1 min, 52 ◦C for 2 min, 72◦C for 3
min; and 72 ◦C for 10 min. PCR products were pooled and purified from 2% agarose
gel (Gel extraction kit, Qiagen Inc.). The amplicons were restricted with AluI enzyme
(Promega) at 37◦C for 3 h and 65◦C for 20 min. Three independent readings of the
size and abundance of fluorescently labeled terminal restriction fragments (TRFs) were performed for each sample using an ABI 3100-Avant Prism Genetic Analyzer (Applied Biosystems), as described previously (Coolen et al., 2005). For each profile of TRFs, we
established a baseline and only those TRFs with peak heights≥50 fluorescent units were
used in subsequent analyses (Blackwood et al., 2003). Each unique TRF was considered
to be an operational taxonomic unit (OTU). Estimations of diversity were derived from matrices constructed based on the presence and abundance of TRFs using relative peak area as an estimate of abundance calculated as:
Ap=(ni/N)×100
in whichnirepresents the peak area of one distinct TRF andN is the sum of all peak areas
Statistical analyses
Statistical and diversity analyses were performed in R (R Development Core Team, 2011),
mainly with vegan (Oksanen et al., 2012), ggplots (Warnes, 2012) and BiodiversityR (Kindt & Coe, 2005) packages.
All soil properties data were expressed on a dry-weight basis. Non-normal data were log-transformed to normalize the distribution of the residuals. We analyzed the data using both multivariate (MANOVA to detect patterns: whether there were significant effects of the four quadrats on overall soil variables) and univariate (to detect significant differences in individual variables) methods. These analyses were followed by multiple pairwise tests, using Tukey’s honestly significant difference (HSD), at the 5% level of significance, to identify possible differences in the soil variables between quadrats. The correlations between each pair of variables were calculated using Pearson’s correlation coefficient. Soil properties were then standardized and ordered by principal components analysis (PCA), and the sampling points from the four quadrats were visualized with the two first principal components.
Alpha diversity indices (Shannon, Simpson, and Berger-Parker) and richness estimates were calculated for each quadrat using the T-RFLPs profiles. Microbial diversity indices were also analyzed using ANOVA type III for unbalanced data and evaluated using Renyi’s entropy profiles for eight scales (α=0, 0.25, 0.5, 1, 2, 4, 8, infinite) (Rényi, 1961;Chao et
al., 2014) with the BiodiversityR package. These profiles provide a comprehensive analysis of the diversity, giving a parametric measure of the uncertainty of predicting the OTUs richness, as well as the relative abundance of OTUs, at different scales between the four quadrats. To evaluate the sampling effort, rarefaction curves were constructed for each
quadrat using EstimateS v.9.1.0 (Colwell, 2005). Microbial community structure between
quadrats was examined through Venn diagrams (with the matrix of OTUs presence) and ordination analyses (with the matrix of OTUs abundance). To visualize communities’ structure, Bray-Curtis dissimilarity distances were calculated with the relative abundance of T-RFLPs profiles. Similar communities were then clustered using the Ward’s hierarchical clustering algorithm, which tries to minimize variances in agglomeration. A heatmap of the relative abundance of OTUs was constructed with dual hierarchical clustering.
Community structure was also investigated for correlations with chemical parameters following a multivariate analysis. For this, the relative abundance of T-RFLPs profiles were ordered by Detrended Correspondence Analysis (DCA) with Hellinger transformation (Blackwood et al., 2003), and correlations between the ordination axes and soil properties were calculated. This eigenvector-based ordination technique uses a chi-square distance measure and assumes that TRFs have a unimodal distribution along ecological gradients (Legendre & Legendre, 1998), which is a more appropriate assumption than linearity for
ecological analysis of T-RFLPs data (Culman et al., 2008). Permutation tests under reduced
model were used to identify significant explanatory soil variables (p<0.05), which were plotted onto the ordination map as vectors. Only the soil variables corresponding to the same sampling sites as the T-RFLPs data were used for this analysis.
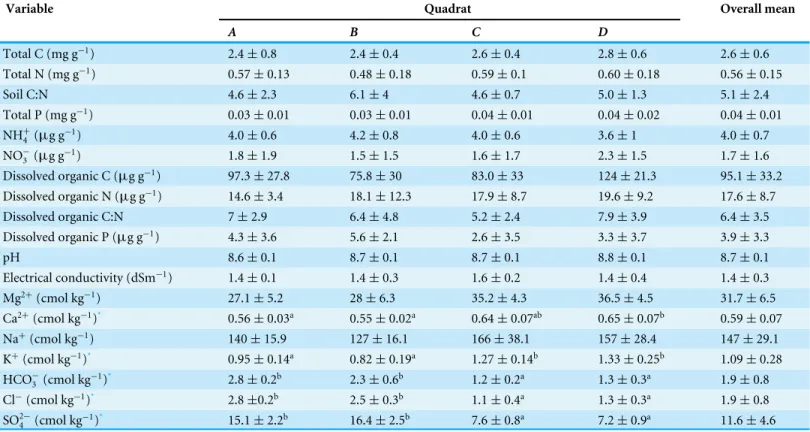
Table 1 Physicochemical parameters.Results from soil physicochemical analyses (mean±standard deviation) of the four studied quadrats within Churince System in the Cuatro Cienegas Basin (Mexico).
Variable Quadrat Overall mean
A B C D
Total C (mg g−1) 2.4±0.8 2.4±0.4 2.6±0.4 2.8±0.6 2.6±0.6
Total N (mg g−1) 0.57±0.13 0.48±0.18 0.59±0.1 0.60±0.18 0.56±0.15
Soil C:N 4.6±2.3 6.1±4 4.6±0.7 5.0±1.3 5.1±2.4
Total P (mg g−1) 0.03±0.01 0.03±0.01 0.04±0.01 0.04±0.02 0.04±0.01
NH+ 4 (µg g
−1) 4.0±0.6 4.2±0.8 4.0±0.6 3.6±1 4.0±0.7
NO−3 (µg g
−1) 1.8±1.9 1.5±1.5 1.6±1.7 2.3±1.5 1.7±1.6
Dissolved organic C (µg g−1) 97.3±27.8 75.8±30 83.0±33 124±21.3 95.1±33.2
Dissolved organic N (µg g−1) 14.6±3.4 18.1±12.3 17.9±8.7 19.6±9.2 17.6±8.7
Dissolved organic C:N 7±2.9 6.4±4.8 5.2±2.4 7.9±3.9 6.4±3.5
Dissolved organic P (µg g−1) 4.3±3.6 5.6±2.1 2.6±3.5 3.3±3.7 3.9±3.3
pH 8.6±0.1 8.7±0.1 8.7±0.1 8.8±0.1 8.7±0.1
Electrical conductivity (dSm−1) 1.4±0.1 1.4±0.3 1.6±0.2 1.4±0.4 1.4±0.3
Mg2+(cmol kg−1) 27.1±5.2 28±6.3 35.2±4.3 36.5±4.5 31.7±6.5
Ca2+(cmol kg−1)* 0.56±0.03a 0.55±0.02a 0.64±0.07ab 0.65±0.07b 0.59±0.07
Na+(cmol kg−1) 140±15.9 127±16.1 166±38.1 157±28.4 147±29.1
K+(cmol kg−1)* 0.95±0.14a 0.82±0.19a 1.27±0.14b 1.33±0.25b 1.09±0.28
HCO−
3 (cmol kg
−1)* 2.8±0.2b 2.3±0.6b 1.2±0.2a 1.3±0.3a 1.9±0.8
Cl−(cmol kg−1)* 2.8±0.2b 2.5±0.3b 1.1±0.4a 1.3±0.3a 1.9±0.8
SO2−
4 (cmol kg−1)* 15.1±2.2b 16.4±2.5b 7.6±0.8a 7.2±0.9a 11.6±4.6
Notes.
Variable acronyms: C, carbon; N, nitrogen; P, phosphorous. *Significant difference among quadrants (p<0.05).
Different letters indicate that means are significantly different among quadrats.
Significant explanatory variables were chosen as the best predictors of OTU abundance by stepwise multiple regressions and by minimizing the Akaike Information Criterion (AIC). Collinearity between explaining variables was also tested using the Variance Inflation Factor (VIF).
RESULTS
Spatial heterogeneity in physicochemical and biochemical parameters
The total plant cover in the experimental plot was only 10%. However, quadratsCandD
were more densely and homogeneously covered thanAandB(Fig. 1). Overall there was a
high presence of soil crusts and biocrusts, particularly in theAquadrat.
Soil chemical properties varied significantly between the four quadrats (Wilks’ lambda = 0.000,F =7.896, p<0.05). Soil samples were alkaline (pH between 8.6–8.8) due to the high presence of salt in this arid ecosystem (Table 1). Cations (Ca2+, K+) and
anions (HCO−3, Cl−, SO2−
4 ) were the most variable parameters in this small plot showing
significant differences between quadrats, which means that ions significantly contribute
to soil heterogeneity in this system.CandDquadrats had the greatest concentration of
for Mg2+and Na+, whileAandBquadrats had the highest concentration of anions (2.8 and 2.3 cmol HCO−3 kg−1, 2.8 and 2.5 cmol Cl− kg−1, 15.6 and 16.4 cmol SO2−
4 kg−1,
respectively). The high concentration of Na+found in these soils (mean value of 147 cmol
kg−1) indicates salinity stress. Total forms and nutrients content were very low in this
arid soil (TC: 2.4–2.8 mg g−1; TN: 0.48–0.6 mg g−1; TP: 0.03–0.04 mg g−1; NH+
4: 3.6–4.2
µg g−1; NO−3: 1.5–2.3µg g−1), as expected, and they did not show significant differences
among quadrats. The total C/N ratio (a quality index for soil organic matter) was also very low (from 4.6 to 6.1) and did not show significant differences between the four quadrats.
On the other hand, C availability (DOC) was higher inDquadrat (124µg g−1), which
means greater substrate availability for microbial metabolism in this quadrat. As expected, the pH was positively correlated with Mg2+and Na+(Table S1). The TC was only positively
correlated with Ca2+, while TP was positively correlated with pH and cations, as well as
negatively with DOP. The TN was positively correlated with DON and negatively with C:N, NH+4, NO−3 and HCO−3. Finally, N inorganic forms were also positively correlated between them and the C:N ratio.
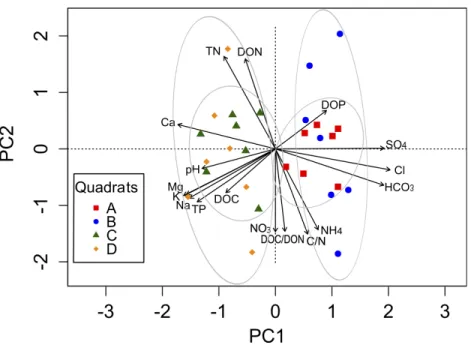
The complex chemical spatial heterogeneity among these four quadrats was explored
using a PCA (Fig. 2). The first component (PC1) explained 54.3%, while the second
component (PC2) explained 34.3% of the total variation in the soil parameters among
quadrats (Table S2). The variables associated with the PC1 were cations and anions, as
well as pH, TP, DOC and DOP. The PC2 was mainly related to soil nutrients (TN, C:N,
NH+4, NO−3, DON, DOC:DON). A clear separation between quadrats was observed along
the PC1 axis, mainly explained by the spatial heterogeneity distribution of ions.
Spatial heterogeneity of microbial diversity
A total of 184 different OTUs were obtained in the four quadrats, of which 121 OTUs had less than 1% of the total maximum relative abundance. Unfortunately, the number of available samples was unbalanced for the microbial diversity study in this plot (amplicons
in each quadrat:A=3;B=3;C=7;D=8) potentially due to the presence of inhibitors
of unknown nature, which hampered the 16S rRNA amplification from all samples sites. Despite this constraint, rarefaction curves showed a good community sampling for quadrats
A,CandD, with evident subsampling for quadratB, which is one of the two quadrats for
which only three out of eight samples could be analyzed in terms of microbial diversity (Fig. S1). Significant variation in alpha diversity indices among quadrats was detected.
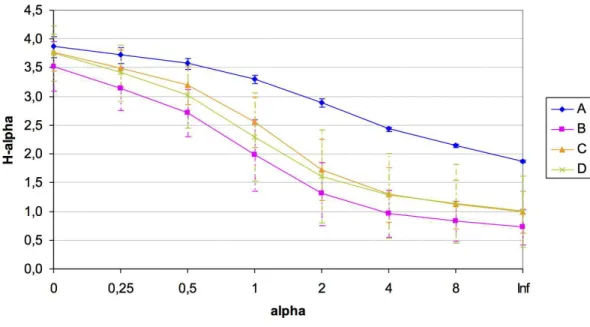
Although theAquadrat was also limited in the number of analyzed samples (3), it was the
most diverse (H: 3.31) and with the highest evenness (1/D: 0.944;BP: 0.153), followed byC,D, andB(Table 2). It was also evident the high variability in microbial diversity among replicates (with the exception ofA), which reflects the spatial heterogeneity at small local scale of this arid soil. A summary of diversity indices was obtained by calculating Renyi’s community profiles. Ranking based on these profiles is preferred to ranking based on single indices because rank order may change when different indices are used (Kindt & Coe, 2005). These profiles showed the same pattern of diversity, both in terms of richness
and evenness, where the highest diversity was found for quadratA and the lowest for
Figure 2 Biplot generated from Principal Component Analysis (PCA) of the standardized soil vari-ables for the four quadrats.Symbols represent the different quadrats. Each vector points to the direction of increase for a given variable and its length indicates the strength of the correlation between the vari-able and the ordination scores. Ellipses show confidence intervals of 95% for each sample type. The first component of the PCA analysis accounted for 54.3% of the total variation, and the second component ac-counted for 34.3% of the variation.
Table 2 Alpha diversity estimates.OTUs diversity indices (mean±standard deviation) from the T-RFLPs data of the four quadrats (A: 3 samples;B: 3 samples;C: 7 samples;D: 8 samples).
Quadrat Richness (S) Shannon (H)* Simpson (1/D)* Berger–Parker*
A 48±9 3.31±0.08a 0.944±0.004a 0.153±0.004b
B 36±15 1.98±0.62b 0.704±0.145b 0.497±0.144a
C 45±13 2.56±0.44ab 0.8±0.105ab 0.393±0.138a
D 47±19 2.3±0.77ab 0.738±0.189b 0.426±0.203a
Notes.
*Significant difference among quadrats (p<0.05).
Different letters indicate that means are significantly different among quadrats.
Despite the high heterogeneity in microbial diversity in such a small plot, Venn diagram revealed a considerable overlap of OTUs among the four quadrats: 18% of OTUs were
shared by all quadrats (Fig. 4), which represent 44.2% of the total abundance of the
microbial community recovered from this plot with the T-RFLP technique. TheCquadrat
had the most ‘‘unique’’ OTUs (12%, representing 0.5% of total abundance), followed by
quadratD(11.4% representing 1.7% of total abundance),B(10.3%, representing 3.9% of
total abundance) andA(5.4%, representing 0.3% of total abundance) in decreasing order.
Interestingly,C andDquadrats shared 84 of the 184 recovered OTUs (46%), suggesting
that both quadrats had more similar community composition thanA andB quadrats.
Moreover, the heatmap (Fig. S2) and the cluster dendrogram (Fig. S3) of OTUs abundance
Figure 3 Renyi’s entropy profiles for the studied quadrats (A: 3 samples;B: 3 samples;C: 7 samples; D: 8 samples).Profiles were calculated with the OTUs abundance matrix. The alpha scale shows the dif-ferent ways of measuring diversity in a community. Alpha=0 is richness, alpha=1 shows Shannon di-versity, alpha=2 is Simpson index (only abundant species are weighted), and alpha=Infinite only dom-inant species are considered (Berger–Parker index). The height ofH-alpha values show diversity (for more information, seeKindt & Coe, 2005).
Figure 4 Venn diagrams.Displaying the degree of overlap of OTUs composition among the four studied quadrats (A: 3 samples; B: 3 samples; C: 7 samples; D: 8 samples).
separating quadrats in two groups: A–B andC–D. As in the PCA analysis, there was a
sample in theCquadrat that clearly deviated from the other samples.
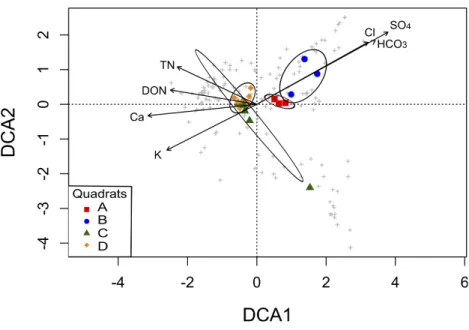
Multivariate analyses of microbial community structure
Figure 5 Detrended Correspondence Analysis (DCA) of the T-RFLPs profiles with respect to the soil properties.Sample sites for the four quadrats are represented by symbols, and OTUs are represented by grey crosses. Ellipses show confidence intervals of 95% for each sample type. Vectors stand for significant soil variables (p<0.1). Each vector points to the direction of increase for a given variable and its length indicates the strength of the correlation with the axes.
explanatory variables (TN, DON, Ca2+, K+, HCO−
3, Cl
−, and SO2−
4 ;Table S3), which were
the factors that contributed significantly to differences in community composition among the four quadrats in the ordination analysis. The DCA showed a clear separation of the quadrats in two groups, mainly explained by soil salinity: anions (HCO−3, Cl−, and SO2−
4 )
significantly correlated with OTUs from the AandBquadrats, while TN, DON, Ca2+
and K+significantly correlated with OTUs from theCandDquadrats (Fig. 5). Thus, the
grouping pattern of these microbial communities showed in the above analyses was also confirmed by the DCA analysis.
To further investigate the relation among OTUs diversity distribution and soil abiotic properties, a full linear model was then tested and reduced for a model where all the coefficients were statistically significant and the best AIC achieved. The best regression model indicated that DON, Ca2+, K+, and SO2−
4 were statistically significant to explain the
distribution of OTUs diversity in this soil (Table S4;R2=0.59,p<0.01).
DISCUSSION
Chemical heterogeneity at local spatial scale is mainly due to ions concentration variability
ratio in this soil was 71:17:1, which suggests that in these quadrats the C is the limiting nutrient in comparison with a general ‘‘average’’ soil C:N:P of 186:13:1 (Cleveland & Liptzin, 2007). On the other hand, this result also differs from the Redfield ratio of 104:5:1 reported for the same soil system (López-Lozano et al., 2012). These differences could be attributable to the great heterogeneity of this arid environment and the different time of soil sampling in both studies: February 2007 (dry cold season with low evapotranspiration) in
López-Lozano et al. (2012)and August 2007 (rainy hot season with high evapotranspiration) in this study.
All soil samples in this study had high alkalinity produced by the elevated concentrations of ions, which is a general pattern in desert soils (Titus, Nowak & Smith, 2002). The high pH decreases P availability, which is very scarce in these soils and it is bonded to Ca2+
and Mg2+(Cross & Schlesinger, 2001;Perroni et al., 2014). It is worth to mention that ions
varied spatially in identity in this small plot: quadratsAandBwere significantly high in
anions, while quadratsCandDwere significantly high in cations. The huge concentration
of Na+in the four quadrats is an indicator of the extremely high salinity in these soils, which negatively affects the soil aggregates stability, as well as nutrients and water availability for plants, favoring the development of soil crusts, which are typical in arid and semiarid soils (Belnap, 2003;Zhang et al., 2007). In particular, salt crusts are abundant in the CCB area. They consist of layers at the soil surface mainly formed by soluble salt crystallizing soil particles at shallow saline groundwater level regions (Zhang et al., 2013).
The high concentration of ions can be attributed to the gypsum-rich nature of the CCB soils, where groundwater rises to the surface by soil capillarity action and water evaporation promotes salt accumulation. This situation results in rivers with a steep salinity gradient (Cerritos et al., 2011) and pools surrounded by saline soils rich in sulfates and extremely poor in nutrients (López-Lozano et al., 2012). Therefore, it is not surprising to find that the soil properties variation in this small plot was mainly explained by ions concentration,
grouping the four quadrats in two broad clusters:A–BandC–D. These clusters had a
qualitative pattern associated with the vegetation cover, being quadrats C andDmore
densely and homogeneously covered by vegetation thanA andB. Although the present
research analyzes soil communities, a previous study of microbial communities of the water system associated with the studied plot showed a correlation of microbial composition and water conductivity gradients (Cerritos et al., 2011). Thus, the spatial variation in these physicochemical properties among the four quadrats may be a consequence of differences in moisture content due to the proximity to a subterranean water flow, indirectly evidenced by the marked patchy distribution of the vegetation cover and the ‘‘open’’ areas occupied by soil crusts (López-Lozano et al., 2012).
Heterogeneity in microbial diversity at local spatial scale is explained by physicochemical factors, not by vegetation cover nor nutrient content
Despite recent important advances in our knowledge of the structure, composition and physiology of biotic components in arid soils (Belnap et al., 2005;Caruso et al., 2011;
of microbial diversity at local scales and its interactions with chemical heterogeneity in these ecosystems (Housman et al., 2007;Castillo-Monroy et al., 2011;Andrew et al., 2012). T-RFLPs fingerprinting was used in this study to assess the relationship between microbial structure and the small-spatial heterogeneity of soil chemical properties. We are aware that this technique cannot recognize taxonomic groups and accounts mainly for relatively abundant microbial groups. Nevertheless, given the aims of this study of characterizing microbial communities structure and its relationship with abiotic or physichochemical parameters, a fingerprint approach such as T-RFLPs is adequate to provide replicable, valid and sufficient data (Angel et al., 2013), as it has done for many other studies looking at patterns of correlation between microbial diversity/composition and environmental factors (Fierer & Jackson, 2006).
The heterogeneity in OTUs diversity among these quadrats is evident, being the A
quadrat the most different with respect to the other quadrats. Despite the fact that the
A quadrat had scarce plant cover and similar nutrients and ions concentrations to the
B quadrat, it showed the greatest microbial diversity, which could be related to the high
presence of biocrusts that may incorporate more resources to the soil, potentially increasing organic C and biomass and, in turn, diversity (Geyer et al., 2013). On the other hand, theB
quadrat had the lowest microbial diversity, which could be related to the lowest values of DOC found in this quadrat. Labile organic matter fractions, such as DOC, are the primary
energy source for soil microorganisms and are characterized by rapid turnover (Bolan
et al., 2011). It has been reported that even in disturbed sites, DOC is the main source
of C influencing the composition of the microbial community (Churchland, Grayston
& Bengtson, 2013). Then, changes of soil microbial community could be regulated by C availability through labile soil organic matter pools, as have recently been shown to happen in McMurdo Dry Valleys arid soils in Antarctica (Geyer et al., 2013).
Regarding similarity in microbial composition among the four quadrats, cluster
dendrogram and multivariate analyses showed two clear groups, which wereA–Band
C–D, corresponding to the same clustering of quadrats based on soil chemical parameters.
A common explanation for the soil microbial composition patterns is related to the presence of plants controlling levels of microbial diversity and driving community assembly (Singh et al., 2007;Berg & Smalla, 2009;Ben-David et al., 2011). However, in our study the observed spatial pattern of microbial diversity distribution at such local scale does not seem to
be associated with vegetation cover. For example, theA quadrat is the most diverse in
microbial community and the less vegetated, suggesting that microbial diversity in this arid soil could be more related to the presence of ‘‘open’’ areas occupied by biocrusts. On the other hand, abiotic factors, such as ionic content, are statistically explanatory variables in the spatial ordering (DCA) of the microbial communities analyzed. In addition, the
multiple regression model selected shows the importance of DON, Ca2+, K+, and SO2−
4 in
and distribution responds to and/or influences local soil physicochemical characteristics at a small spatial scale in this arid ecosystem.
CONCLUSIONS
In desert areas such as CCB, soil moisture is one of main limiting factors affecting vegetation growth and distribution, as well as soil microbiology. The gypsum-based water system controls the soil physicochemical factors and ultimately the microbial community distribution in this arid ecosystem. Thus, the high heterogeneity in the soil properties and microbial community among these small four quadrats seems to be a consequence of differences in the soil saline content. In addition, the high concentration of Na+favors the
emergence of both salt and biological crusts and the irregular plant cover distribution in this system. Local spatial variability of physicochemical properties and microbial diversity observed in this arid ecosystem is likely to exist in most soils ecosystems, and needs to be considered when making ecological inferences and when developing strategies to sample the soil environment. A better understanding of the role of spatial heterogeneity in biotic and abiotic factors will help to determine the relevance of small-scale studies for large-scale patterns and processes.
ACKNOWLEDGEMENTS
We want to thank Dr Laura Espinosa-Asuar and Rodrigo González Chauvet for technical support during the development of this study.
ADDITIONAL INFORMATION AND DECLARATIONS
Funding
This work was supported by the Universidad Nacional Autónoma de México (UNAM-PAPIIT grant IA200814 to AEE) and SEMARNAT-CONACyT (grant 23459 to VS). SP received financial support from a CONACyT research visiting fellowship (186372). The funders had no role in study design, data collection and analysis, decision to publish, or preparation of the manuscript.
Grant Disclosures
The following grant information was disclosed by the authors: Universidad Nacional Autónoma de México: IA200814. SEMARNAT-CONACyT: 23459.
CONACyT research visiting fellowship: 186372.
Competing Interests
Valeria Souza and Luis E. Eguiarte are Academic Editors for PeerJ.
Author Contributions
• Silvia Pajares conceived and designed the experiments, analyzed the data, wrote the
• Ana E. Escalante conceived and designed the experiments, analyzed the data, wrote the
paper, reviewed drafts of the paper, contributed reagents/materials/analysis tools.
• Ana M. Noguez conceived and designed the experiments, performed the experiments,
analyzed the data, wrote the paper, reviewed drafts of the paper.
• Felipe García-Oliva, Luis Enrique Eguiarte and Valeria Souza conceived and designed
the experiments, contributed reagents/materials/analysis tools.
• Celeste Martínez-Piedragil performed the experiments.
• Silke S. Cram performed the experiments, contributed reagents/materials/analysis tools.
Field Study Permissions
The following information was supplied relating to field study approvals (i.e., approving body and any reference numbers):
The field permit for biological sample collection was granted by the Environmental Council in Mexico (SEMARNAT) to Valeria Souza: Permit numbers 06590/06 and 06855/07.
Data Availability
The following information was supplied regarding data availability:
The raw data has been supplied asData S1.
Supplemental Information
Supplemental information for this article can be found online athttp://dx.doi.org/10.7717/
peerj.2459#supplemental-information.
REFERENCES
Andrew DR, Fitak RR, Munguia-Vega A, Racolta A, Martinson VG, Dontsova K.
2012.Abiotic factors shape microbial diversity in Sonoran Desert soils.Applied and
Environmental Microbiology78:7527–7537DOI 10.1128/AEM.01459-12.
Angel R, Pasternak Z, Soares MIM, Conrad R, Gillor O. 2013.Active and total
prokary-otic communities in dryland soils.FEMS Microbiology Ecology86:130–138
DOI 10.1111/1574-6941.12155.
Angel R, Soares MIM, Ungar ED, Gillor O. 2010.Biogeography of soil archaea and
bacteria along a steep precipitation gradient.ISME Journal4:553–563
DOI 10.1038/ismej.2009.136.
Bachar A, Soares MIM, Gillor O. 2012.The effect of resource islands on abundance and
diversity of bacteria in arid soils.Microbial Ecology63:694–700
DOI 10.1007/s00248-011-9957-x.
Barrett JE, Virginia RA, Wall DH, Cary SC, Adams BJ, Hacker AL, Aislabie JM. 2006. Co-variation in soil biodiversity and biogeochemistry in northern and southern
Victoria Land, Antarctica.Antarctic Science18(4):535–548
DOI 10.1017/S0954102006000587.
Belnap J. 2003.The world at your feet: desert biological soil crusts.Frontiers in Ecology
and the Environment 1:181–189
Belnap J, Welter JR, Grimm NB, Barger N, Ludwig JA. 2005.Linkages between
micro-bial and hydrologic processes in arid and semiarid watersheds.Ecology86:298–307
DOI 10.1890/03-0567.
Ben-David EA, Zaady E, Sher Y, Nejidat A. 2011.Assessment of the spatial distribution
of soil microbial communities in patchy arid and semi-arid landscapes of the Negev
Desert using combined PLFA and DGGE analyses.FEMS Microbiology Ecology
76:492–503DOI 10.1111/j.1574-6941.2011.01075.x.
Berg G, Smalla K. 2009.Plant species and soil type cooperatively shape the structure and
function of microbial communities in the rhizosphere.FEMS Microbiology Ecology
68:1–13DOI 10.1111/j.1574-6941.2009.00654.x.
Blackwood CB, Marsh T, Kim S, Paul EA. 2003.Terminal restriction fragment length
polymorphism data analysis for quantitative comparison of microbial communities.
Applied and Environmental Microbiology 69:926–932
DOI 10.1128/AEM.69.2.926-932.2003.
Bolan NS, Adriano DC, Kunhikrishnan A, James T, McDowell R, Senesi N. 2011.
Dis-solved organic matter: biogeochemistry, dynamics, and environmental significance
in Soils.Advances in Agronomy110:1–75DOI 10.1016/B978-0-12-385531-2.00001-3.
Bower CA, Reitemeier RF, Fireman R. 1972.Exchangeable cations of saline and alkaline
soils.Soil Science73:251–257.
Bremmer JM, Mulvaney CS. 1982. Total nitrogen. In: Bremmer JM, Mulvaney CS, eds.
Methods of soil analysis agronomy series no. 2. Part 2. Madison: American Society of Agronomy, 595–624.
Caruso T, Chan Y, Lacap DC, Lau MCY, McKay CP, Pointing SB. 2011.Stochastic and
deterministic processes interact in the assembly of desert microbial communities on
a global scale.The ISME Journal5:1406–1413DOI 10.1038/ismej.2011.21.
Castillo-Monroy AP, Bowker MA, Maestre FT, Rodríguez-Echeverría S, Martinez I,
Barraza-Zepeda CE, Escolar C. 2011.Relationships between biological soil crusts,
bacterial diversity and abundance, and ecosystem functioning: insights from a
semi-arid Mediterranean environment.Journal of Vegetation Science22:165–174
DOI 10.1111/j.1654-1103.2010.01236.x.
Castillo-Monroy AP, Maestre FT, Delgado-Baquerizo M, Gallardo A. 2010.Biological
soil crusts modulate nitrogen availability in semi-arid ecosystems: insights from a
Mediterranean grassland.Plant Soil333(1–2):21–34
DOI 10.1007/s11104-009-0276-7.
Cerritos R, Eguiarte LE, Avitia M, Siefert J, Travisano M, Rodríguez-Verdugo A,
Souza V. 2011.Diversity of culturable thermo-resistant aquatic bacteria along
an environmental gradient in Cuatro Ciénegas, Coahuila, México.Antonie van
Leeuwenhoek99:303–318DOI 10.1007/s10482-010-9490-9.
Challenger A. 1998.Utilización y conservación de los ecosistemas terrestres de México:
Pasado, presente y futuro. Mexico: CONABIO-Instituto de Biología-Agrupación Sierra Madre.
estimation in species diversity studies.Ecological Monographs84:45–67
DOI 10.1890/13-0133.1.
Churchland C, Grayston SJ, Bengtson P. 2013.Spatial variability of soil fungal and
bacterial abundance: consequences for carbon turnover along a transition from a forested to clear-cut site.Soil Biology and Biochemistry63:5–13
DOI 10.1016/j.soilbio.2013.03.015.
Cleveland C, Liptzin D. 2007.C: N: P stoichiometry in soil: is there a ‘‘Redfield ratio’’ for
the microbial biomass?Biogeochemistry 85:235–252
DOI 10.1007/s10533-007-9132-0.
Colwell RK. 2005.EstimateS: statistical estimation of species richness and shared species
from samples. Available athttp:// viceroy.eeb.uconn.edu/ estimates/.
Coolen MJL, Post E, Davis CC, Forney LJ. 2005.Characterization of microbial
com-munities found in the human vagina by analysis of terminal restriction fragment
length polymorphisms of 16S rRNA genes.Applied and Environmental Microbiology
71:8729–8737DOI 10.1128/AEM.71.12.8729-8737.2005.
Cross AF, Schlesinger WH. 1999.Plant regulation of soil nutrient distribution in the
northern Chihuahuan Desert.Plant Ecology 145:11–25
DOI 10.1023/A:1009865020145.
Cross AF, Schlesinger WH. 2001.Biological and geochemical controls on phosphorus
fractions in semiarid soils.Biogeochemistry52:155–172
DOI 10.1023/A:1006437504494.
Culman SW, Gauch HG, Blackwood CB, Thies JE. 2008.Analysis of T-RFLP data
using analysis of variance and ordination methods: a comparative study.Journal of
Microbiological Methods75:55–63DOI 10.1016/j.mimet.2008.04.011.
Evans RD, Rimer R, Sperry L, Belnap J. 2001.Exotic plant invasion alters nitrogen
dynamics in an arid grassland.Ecological Applications11:1301–1310
DOI 10.1890/1051-0761(2001)011[1301:EPIAND]2.0.CO;2.
Fierer N, Jackson RB. 2006.The diversity and biogeography of soil bacterial
communi-ties.Proceedings of the National Academy of Sciences of the United States of America
103:626–631DOI 10.1073/pnas.0507535103.
Garcia-Pichel F, Loza V, Marusenko Y, Mateo P, Potrafka RM. 2013.Temperature
drives the continental-scale distribution of key microbes in topsoil communities.
Science340:1574–1577DOI 10.1126/science.1236404.
Geyer KM, Altrichter AE, Van Horn DJ, Takacs-Vesbach CD, Gooseff MN, Barrett
JE. 2013.Environmental controls over bacterial communities in polar desert soils.
Ecosphere4(10):Article 127.
Hartmann A, Schmidt M, Van Tuinen D, Berg G. 2009.Plant-driven selection of
microbes.Plant Soil321:235–257DOI 10.1007/s11104-008-9814-y.
Hirobe M, Ohte N, Karasawa N, Zhang GS, Wang LH, Yoshikawa K. 2001.Plant species
effect on spatial patterns of soil properties in the Mu-us desert ecosystem, Inner
Holben WE, Jansson JK, Chelm BK, Tiedje JM. 1988.DNA probe method for the
detection of specific microorganisms in the soil bacterial community.Applied and
Environmental Microbiology54:703–711.
Housman DC, Yeager CM, Darby BJ, Sanford RL, Kuske CR, Neher DA, Belnap J. 2007.
Heterogeneity of soil nutrients and subsurface biota in a dryland ecosystem.Soil
Biology and Biochemistry 39:2138–2149DOI 10.1016/j.soilbio.2007.03.015.
Huffman EWD. 1977.Performance of a new carbon dioxide coulometer.Microchemical
Journal 22:567–573DOI 10.1016/0026-265X(77)90128-X.
IUSS Working Group WRB. 2015.World reference base for soil resources 2014, update
2015. International soil classification system for naming soils and creating legends for soil maps. World Soil Resources Reports No. 106. FAO, Rome.
Kindt R, Coe R. 2005.Tree diversity analysis; a manual and software for common statistical
methods for ecological and biodiversity studies. Nairobi: World Agroforestry Centre (ICRAF), 207 p.
Lane DJ. 1991. 16S/23S rDNA sequencing. Nucleic acid techniques. In: Stackebrandt E,
Goodfellow M, eds.Bacterial systematics. New York: John Wiley & Sons, 115–175.
Lee CK, Barbier BA, Bottos EM, McDonald IR, Cary SC. 2012.The inter-valley soil
comparative survey: the ecology of dry valley edaphic microbial communities.The
ISME Journal6:1046–1057DOI 10.1038/ismej.2011.170.
Legendre P, Legendre L. 1998.Numerical ecology. Amsterdam: Elsevier.
López-Lozano NE, Eguiarte LE, Bonilla-Rosso G, García-Oliva F, Martínez-Piedragil
C, Rooks C, Souza V. 2012.Bacterial communities and the nitrogen cycle in the
gypsum soils of Cuatro Ciénegas Basin, Coahuila: a Mars analogue.Astrobiology
12:699–709DOI 10.1089/ast.2012.0840.
Lukow T, Dunfield PF, Liesack W. 2000.Use of the T-RFLP technique to assess spatial
and temporal changes in the bacterial community structure within an agricultural
soil planted with transgenic and non-transgenic potato plants.FEMS Microbiology
Ecology 32:241–247DOI 10.1016/S0168-6496(00)00033-7.
Maestre FT, Delgado-Baquerizo M, Jeffries TC, Eldridge DJ, Ochoa V, Gozalo B, Quero JL, García-Gómez M, Gallardo A, Ulrich W, Bowker MA, Arredondo T, Barraza-Zepeda C, Bran D, Florentino A, Gaitán J, Gutiérrez JR, Huber-Sannwald E, Jankju M, Mau RL, Miriti M, Naseri K, Ospina A, Stavi I, Wang D, Woods NN, Yuan X,
Zaady E, Singh BK. 2015.Increasing aridity reduces soil microbial diversity and
abundance in global drylands.Proceedings of the National Academy of Sciences of the
United States of America112:15684–15689DOI 10.1073/pnas.1516684112.
Maestre FT, Escudero A, Martínez I, Guerrero C, Rubio A. 2005.Does spatial pattern
matter to ecosystem functioning? Insights from biological soil crusts.Functional
Ecology 19:566–573DOI 10.1111/j.1365-2435.2005.01000.x.
Makhalanyane TP, Valverde A, Gunnigle E, Frossard A, Ramond JB, Cowan DA.
2015.Microbial ecology of hot desert edaphic systems.FEMS Microbiology Reviews
Martiny J, Eisen JA, Penn K, Allison SD, Horner-devine MC. 2011.Drivers of bacterial beta-diversity depend on spatial scale.Proceedings of the National Academy of Sciences of the United States of America108:7850–7854DOI 10.1073/pnas.1016308108.
Murphy J, Riley JP. 1962.A modified single solution method for the determination of
phosphate in natural waters.Analytica Chimica Acta27:31–36
DOI 10.1016/S0003-2670(00)88444-5.
Noguez AM, Arita HT, Escalante AE, Forney LJ, García-oliva F, Souza V. 2005.
Microbial macroecology: highly structured prokaryotic soil assemblages in a tropical
deciduous forest.Global Ecology and Biogeography14:241–248
DOI 10.1111/j.1466-822X.2005.00156.x.
Noguez AM, Escalante AE, Forney LJ, Nava-Mendoza M, Rosas I, Souza V,
Garcia-Oliva F. 2008.Soil aggregates in a tropical deciduous forest: effects on C and N
dynamics, and microbial communities as determined by t-RFLPs.Biogeochemistry
89:209–220DOI 10.1007/s10533-008-9214-7.
Oksanen J, Blanchet FG, Kindt R, Legendre P, O’Hara RB, Simpson GL, Solymos P,
Stevens MHH, Wagner H. 2012.vegan: Community Ecology Package. R package
version 1. R package version 2.0–4.
Perroni Y, García-Oliva F, Tapia Y, Souza V. 2014.Relationship between soil P fractions
and microbial biomass in an oligotrophic grassland-desert scrub system.Ecological
Research29(3):463–472DOI 10.1007/s11284-014-1138-1.
R Development Core Team. 2011.R: a language and environment for statistical
comput-ing. Vienna: R Foundation for Statistical Computing. Available athttp://
www.R-project.org/ DOI 10.1007/978-3-540-74686-7.
Rényi A. 1961.On measures of entropy and information.Entropy 547:547–561
DOI 10.1021/jp106846b.
Schade JD, Hobbie SE. 2005.Spatial and temporal variation in islands of fertility in the
Sonoran Desert.Biogeochemistry73:541–553DOI 10.1007/s10533-004-1718-1.
Schlesinger WH, Raikes JA, Hartley AE, Cross AF. 1996.On the spatial pattern of soil
nutrients in desert ecosystems.Ecology77:364–374.
Singh BK, Munro S, Potts JM, Millard P. 2007.Influence of grass species and soil type on
rhizosphere microbial community structure in grassland soils.Applied Soil Ecology
36:147–155DOI 10.1016/j.apsoil.2007.01.004.
Strauss SL, Day TA, Garcia-Pichel F. 2012.Nitrogen cycling in desert biological soil
crusts across biogeographic regions in the Southwestern United States.
Biogeochem-istry 108:171–182DOI 10.1007/s10533-011-9587-x.
Strickland MS, Lauber C, Fierer N, Bradford MA. 2009.Testing the functional
signifi-cance of microbial community composition.Ecology90:441–451.
Tapia-Torres Y, López-Lozano NE, Souza V, García-Oliva F. 2015.Vegetation-soil
system controls soil mechanisms for nitrogen transformations in an oligotrophic
Mexican desert.Journal of Arid Environments114:62–69
Thompson TL, Zaady E, Huancheng P, Wilson TB, Martens DA. 2006.Soil C and N
pools in patchy shrublands of the Negev and Chihuahuan Deserts.Soil Biology and
Biochemistry38:1943–1955DOI 10.1016/j.soilbio.2006.01.002.
Titus JH, Nowak RS, Smith SD. 2002.Soil resource heterogeneity in the Mojave Desert.
Journal of Arid Environments52:269–292 DOI 10.1006/jare.2002.1010.
Vos M, Wolf AB, Jennings SJ, Kowalchuk GA. 2013.Micro-scale determinants of
bacterial diversity in soil.FEMS Microbiology Reviews37:936–954
DOI 10.1111/1574-6976.12023.
Warnes GR. 2012.gplots: various R programming tools for plotting data.Journal of
Phycology33:569–575DOI 10.1111/j.0022-3646.1997.00569.x.
Zeglin LH, Dahm CN, Barrett JE, Gooseff MN, Fitpatrick SK, Takacs-Vesbach CD.
2011.Bacterial community structure along moisture gradients in the parafluvial
sediments of two ephemeral desert streams.Microbial Ecology61:543–556
DOI 10.1007/s00248-010-9782-7.
Zeglin LH, Sinsabaugh RL, Barrett JE, Gooseff MN, Takacs-Vesbach CD. 2009. Landscape distribution of microbial activity in the McMurdo Dry Valleys: linked
biotic processes, hydrology, and geochemistry in a cold desert ecosystem.Ecosystems
12:562–573DOI 10.1007/s10021-009-9242-8.
Zhang YM, Chen J, Wang L, Wang XQ, Gu ZH. 2007.The spatial distribution patterns
of biological soil crusts in the Gurbantunggut Desert, Northern Xinjiang, China.
Journal of Arid Environments68:599–610 DOI 10.1016/j.jaridenv.2006.06.012.
Zhang J, Xu X, Lei J, Li S. 2013.Research on chemical characteristics of soil salt crusts
with saline groundwater drip-irrigation in the Tarim Desert Highway Shelterbelt.