in A549 Lung Cancer Cells
Hsin-Yi Chang1., Meng-Her Shih1., Hsuan-Cheng Huang2
, Shang-Ru Tsai3, Hsueh-Fen Juan1,3*, Si-Chen Lee3,4*
1Department of Life Science, Institute of Molecular and Cellular Biology, National Taiwan University, Taipei, Taiwan,2Institute of Biomedical Informatics, Center for Systems and Synthetic Biology, National Yang-Ming University, Taipei, Taiwan,3Graduate Institute of Biomedical Electronics and Bioinformatics, National Taiwan University, Taipei, Taiwan,4Department of Electrical Engineering, National Taiwan University, Taipei, Taiwan
Abstract
There were studies investigating the effects of broadband infrared radiation (IR) on cancer cell, while the influences of middle-infrared radiation (MIR) are still unknown. In this study, a MIR emitter with emission wavelength band in the 3–5mm region was developed to irradiate A549 lung adenocarcinoma cells. It was found that MIR exposure inhibited cell proliferation and induced morphological changes by altering the cellular distribution of cytoskeletal components. Using quantitative PCR, we found that MIR promoted the expression levels of ATM (ataxia telangiectasia mutated), ATR (ataxia-telangiectasia and Rad3-related and Rad3-related), TP53 (tumor protein p53), p21 (CDKN1A, cyclin-dependent kinase inhibitor 1A) and GADD45 (growth arrest and DNA-damage inducible), but decreased the expression levels of cyclin B coding genes, CCNB1 and CCNB2, as well as CDK1 (Cyclin-dependent kinase 1). The reduction of protein expression levels of CDC25C, cyclin B1 and the phosphorylation of CDK1 at Thr-161 altogether suggest G2/M arrest occurred in A549 cells by
MIR. DNA repair foci formation of DNA double-strand breaks (DSB) markerc-H2AX and sensor 53BP1 was induced by MIR treatment, it implies the MIR induced G2/M cell cycle arrest resulted from DSB. This study illustrates a potential role for the
use of MIR in lung cancer therapy by initiating DSB and blocking cell cycle progression.
Citation:Chang H-Y, Shih M-H, Huang H-C, Tsai S-R, Juan H-F, et al. (2013) Middle Infrared Radiation Induces G2/M Cell Cycle Arrest in A549 Lung Cancer
Cells. PLoS ONE 8(1): e54117. doi:10.1371/journal.pone.0054117
Editor:Jasti Rao, University of Illinois College of Medicine, United States of America
ReceivedSeptember 9, 2012;AcceptedDecember 6, 2012;PublishedJanuary 15, 2013
Copyright:ß2013 Chang et al. This is an open-access article distributed under the terms of the Creative Commons Attribution License, which permits unrestricted use, distribution, and reproduction in any medium, provided the original author and source are credited.
Funding:This work was supported by the National Science Council, Taiwan (NSC 100-2120-M-002-014, NSC 99-2621-B-002-005-MY3, NSC 99-2621-B-010-001-MY3) and National Taiwan University Cutting-Edge Steering Research Project (10R70602C3 and 101R4000). The funders had no role in study design, data collection and analysis, decision to publish, or preparation of the manuscript.
Competing Interests:The authors have declared that no competing interests exist.
* E-mail: yukijuan@ntu.edu.tw (H-FJ); sclee@cc.ee.ntu.edu.tw (S-CL)
.These authors contributed equally to this work.
Introduction
Neoplasm is the major cause of death worldwide, and lung cancer is the leading cause of cancer death [1]. As the smoking habit declines, the incidence of lung cancer has deteriorated in many countries accordingly [2]. Except smoking, other factors such as asbestos, radon or heavy metals exposures also contribute to lung cancer [3]. Statistics data from a 2008 International Agency for Research on Cancer (IARC) risk assessment indicates that lung cancer kills about 1.4 million people per year globally [4]. Due to the high occurrence and lethality of lung cancer, the related therapy is progressing to solve these problems.
The electromagnetic radiation from solar radiation can be divided into several regions, including c-ray, x-ray, ultraviolet (UV), visible light, infrared (IR) radiation, microwave and radio wave. Among the solar radiation, IR light with wavelengths ranging from 0.76–1000mm can be divided into three regions, near-infrared (NIR, 0.76–1.5mm), middle-infrared (MIR, 1.5– 5.6mm) and far-infrared (FIR, 5.6–1000mm). Applications of IR have been widely established in daily uses and clinical purposes, including cutaneous microcirculation, wound healing, gas sensors, and remote temperature measurement [5].
Previous studies have indicated that NIR triggered a retrograde mitochondrial signaling response resulting ROS mediated matrix metalloproteinase-1 (MMP-1) production via mitogen-activated protein kinases (MAPKs) pathway [6]. It also showed that NIR protected human dermal fibroblast from UV-induced cytotoxicity by inducing Hsp27 which prevents apoptosome assembly, an initial event of apoptosis [7,8].In vivostudies demonstrated that
and O-H bonds can be excited to generate stretching vibrations by 3–5mm infrared, it is expected that the important biochemical reaction will be affected by the irradiation of infrared with wavelength in this range [16]. We revealed that MIR reduced cell viability, caused significant changes in cytoskeleton arrangement, and induced G2/M cell cycle arrest which might be contributed by induction of double-strands breaks (DSB) in DNA along the ATM/ATR-p53-p21 axis.
Results
The Wavelength of MIR was Constrained at 3–5 mm and the Temperature of Culture Medium was Consistent at 37uC
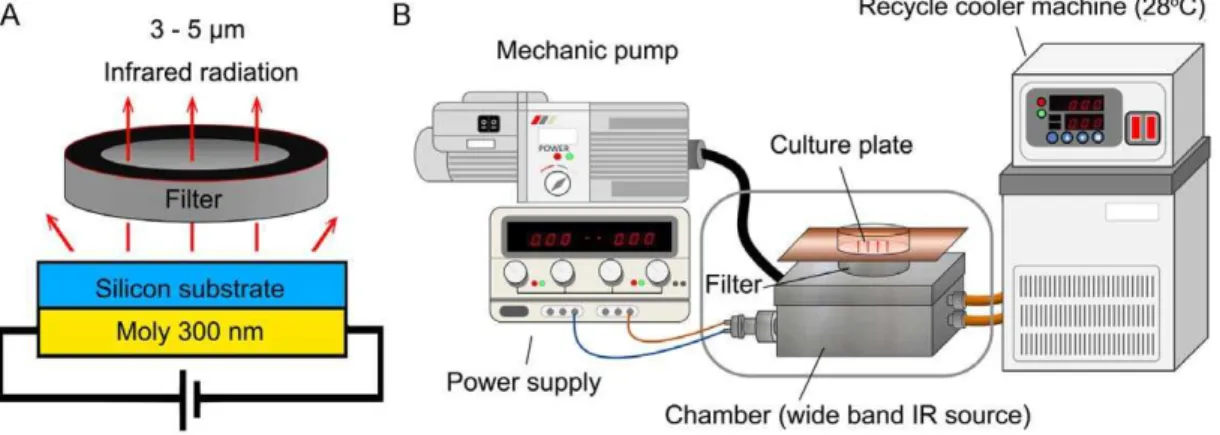
The wide band blackbody source was fabricated to provide broad band MIR and set in a metal chamber to avoid the disturbance from environment (Figure 1). With the increasing of heating temperature, the emission power of silicon substrate was elevated correspondingly. The radiation intensity was set to 3 mW/cm2by adjusting the heating temperature and measuring the magnitude by THORLAB PM100D power meter. To remove the heat effects of MIR, we set the recycle cooler machine at 28uC to cool the air in the chamber where provided the MIR source thus maintain the temperature of culture medium at 37uC. The arrangement of the apparatus is shown in Figure 1B.
The Cell Proliferation of A549 Cells Remained Unchanged in the MIR Exposed Medium
To distinguish whether the effects of MIR occurred directly on cultured cells or indirectly through altering the cell medium, the culture medium was exposed to MIR for 48 hours prior to its addition to the cell culture. After A549 cells (26104cells per well) were seeded onto a 12-well plate, we substituted the culture medium with MIR-exposed or unexposed medium for a further 48 hours and then determined cell viability by MTT assay. We observed that cell proliferation of A549 cells was not significantly altered under MIR-exposed medium compared to unexposed medium (Figure S1). From here, we applied a 48-hour period of exposure to the cells for all experiments unless otherwise specified.
MIR Inhibited the Cell Proliferation and Altered the Morphology of A549 Cells
To investigate the effect of MIR on cancer cells, lung adenocarcinoma cells A549 were utilized to assess the cytotoxicity
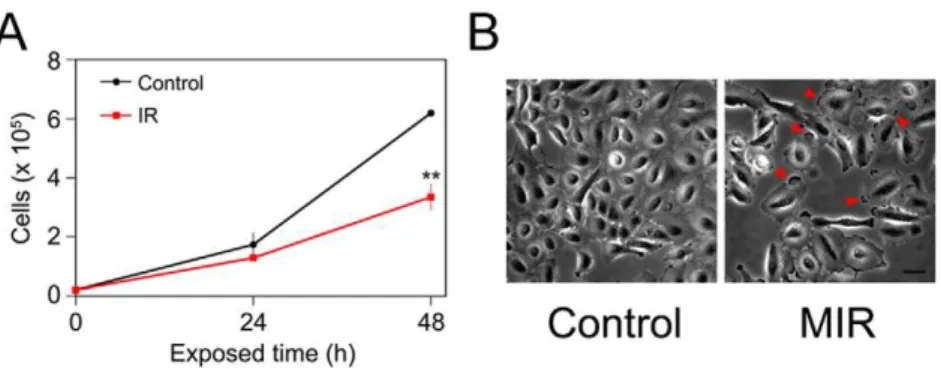
of MIR and the normal lung fibroblasts MRC-5 were tested for comparison. Cells (26104) were plated in 12-well culture plates overnight prior to MIR exposure. The cell viability was determined by MTT assay and trypan blue based cell counting after MIR exposure. The results indicated that the proliferation of A549 cells was significantly suppressed by MIR exposure for 48 hours (Figure 2A), while the growth and morphology of MRC-5 cells were not affected by MIR treatment (Figure S2A, S2B). Interestingly, we revealed morphological changes to the A549 cells upon MIR exposure. We observed that MIR-exposed A549 cells were more rounded in shape, enlarged in size, and formed a radial apron under phase-contrast microscopic examination (Figure 2B). The results imply that MIR might regulate the cytoskeleton dynamics which determines the cell morphology.
MIR Exposure Activated the Reorganization of Actin Filament, Vinculin and Microtubule
The cytoskeleton plays an important role in regulating cell shape [17,18], and both actin filaments and microtubules are known to affect the formation and distribution of cell focal adhesions [17] which determine cell morphology and motility. To distinguish the effects of MIR on cytoskeleton, we performed immunofluorescence staining to examine whether the two important components of cytoskeleton, actin filaments and microtubules, as well as the focal adhesion molecule vinculin involved in this morphological change. The results showed that MIR induced a significant decrease in F-actin containing stress fibers as determined by staining with rhodamine-labeled phalloi-din (Figure 3). Furthermore, the actin filaments exhibited a dense meshwork of unpolarized arrangement and the vinculin was aggregated around the cell periphery in MIR-exposed cells (Figure 3), implying that MIR may inhibit cell migration by regulating the reorganization of actin filaments and distribution of vinculin [19]. On the other hand, microtubules were distributed at the perinuclear cytoplasmic regions after MIR treatment (Figure 4). This specific distribution of irregular microtubule fragments suggests that MIR could cause G2/M cell cycle arrest as previously demonstrated [20,21].
MIR Exposure Regulated the mRNA Expression Level of G2/M Regulated Genes in A549 Cells
Since the distribution of cytoskeleton imply a possible role of MIR in regulating cell cycle progression, it is critical to examine the expression of genes involved in G2-M transition were further
Figure 1. The MIR emitter.(A) The side view of wide band blackbody source. (B) Schematic diagram showing the setup for the MIR irradiation experiment. The cells were plated onto 12-well plates and cultured in an incubator with 100% humidity, at 37uC and with 5% CO2.
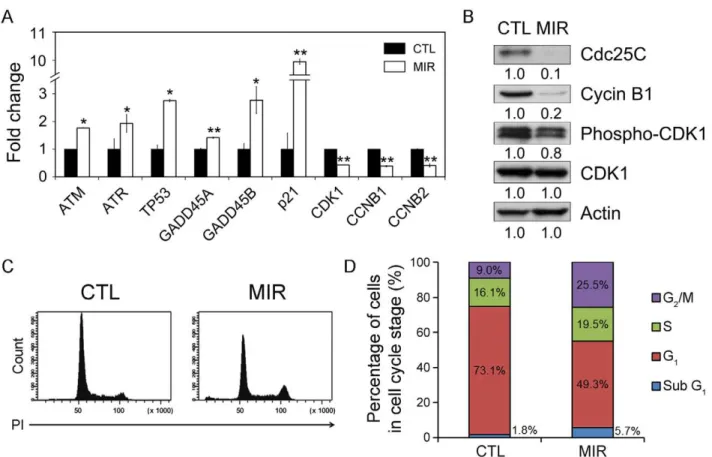
selected to be validated. The G2/M cell cycle checkpoint responds to DNA damage and involves the activation of ataxia-telangiec-tasia mutated (ATM) and ataxia-telangiecataxia-telangiec-tasia and Rad3-related (ATR) proteins [22]. Both ATM and ATR activate p53 by phosphorylation of Ser15 in response to DNA damage, thus increasing the transcription of growth arrest and DNA damage inducible gene (GADD45) and p21, which are required for inhibiting expression of the key regulators of the G2/M transition, cyclin-dependent kinase 1 (CDK1) and cyclin B [23,24,25,26]. The expression of genes involved in inducing G2/M arrest were increased in MIR-treated A549 cells, including ATM, ATR, p53, GADD45A, GADD45B, and p21 (Figure 5A). In contrast, the mRNA expression levels of CDK1, CCNB1 and CCNB2 were decreased after MIR exposure (Figure 5A). The results demon-strate that MIR exposure activates the expressions of ATM, ATR, p53, and p21 genes in response to DNA damage and regulates the genes to control G2/M cell cycle progression.
MIR Exposure Abolished the Expression of Cdc25C and Cyclin B1, and Decreased the Phosphorylation of CDK1 The cell cycle progression from the G2to M phase is regulated by activation of CDK1, whose activity is dependent upon coordination with cyclin B [27,28]. The activation of the CDK1/cyclin B complex is maintained through phosphorylation at Thr161 and dephosphorylation at Thr14 and Tyr15 of CDK1 [27,28]. Dephosphorylation of the Thr14 and Tyr15 residues in CDK1 is catalyzed by phosphatase Cdc25C. It is thought of as a rate-limiting step for G2 entry into mitosis [27,29]. Considering the role of the CDK1/cyclin B complex and Cdc25C in regulating G2 to M phase transition, we assessed whether MIR exposure altered the protein expression of CDK1, cyclin B1, and Cdc25C, as well as the phosphorylation of CDK1. The results showed that the phosphorylation of CDK1 protein at Thr161 and the levels of cyclin B1 and Cdc25C were all reduced in cells treated with MIR (Figure 5B). It indicates that MIR exposure induced a typical G2/ Figure 2. Effects of MIR exposure on cell proliferation and the morphology of A549 cells.(A) The cell numbers were measured at 0, 24 and 48 hours after MIR exposure by using Trypan blue and a hemocytometer. The average cell numbers of control (unexposed) and MIR exposure treatments were expressed as means6SD from three independent experiments. **P,0.01. (B) Cell images were observed by phase-contrast microscopy after 48 hours MIR exposure. Arrows indicate the radial aprons of enlarged cells. Scale bar represents 50mm.
doi:10.1371/journal.pone.0054117.g002
Figure 3. Effect of MIR exposure on the actin filaments and focal adhesions of A549 cells.Cells were seeded onto glass coverslips in 12-well plates, exposed to MIR for 48 hours, fixed for staining and visualized by fluorescence microscopy. Actin filaments were tagged with rhodamine-labeled phalloidin (red), vinculin was rhodamine-labeled with mouse anti-vinculin antibody and the corresponding FITC– conjugated secondary anti-mouse IgG antibody (green), and nuclei were stained with DAPI (blue). Scale bar represents 10mm. Arrows indicate the position of vinculin.
Figure 4. Effect of MIR exposure on the microtubule networks of A549 cells.Cells were seeded onto glass coverslips in 12-well plates, exposed to MIR for 48 hours, fixed for staining and visualized by fluorescence microscopy. Microtubules were labeled witha–tubulin antibody and the corresponding FITC–conjugated secondary antibody (green), and nuclei were labeled with DAPI (blue). Scale bar represents 10mm.
doi:10.1371/journal.pone.0054117.g004
Figure 5. MIR exposure induced G2/M cell cycle arrest in A549 cells.Cells were exposed to MIR for 48 h, and harvested for RNA and protein extraction. (A) Gene expression of genes involved in regulation of G2/M transition (x-axis). The y-axis indicates the relative transcript quantities calculated using theDDCt method with GAPDH as the reference gene amplified from each sample. The data are presented as mean6S.D. (n= 3). * P,0.05, **P,0.001. (B) Protein expression levels were examined by Western blot with actin as the internal control. All experiments were repeated three times. (C) Flow cytometric analysis of DNA content. Cells were exposed to MIR for 48 h. Cells from six independent experiments were collected for analyzing cell cycle distribution. (D) The percentage of cells in each phase was obtained by MultiCycle analysis.
M cell cycle arrest in A549 cells by regulating cyclin B1 and Cdc25C expression, and CDK1 phosphorylation.
MIR Exposure Resulted in Cell Cycle Arrest at G2/M Phase We next examined whether the cell cycle distribution of A549 were affected by MIR irradiation. To obtain the DNA content, we performed flow cytometry to analyze PI-labeled cells. The results showed that the cells in G2/M population were increased under MIR exposure. Coordinately, the G2/M regulators were both activated in their transcriptional, translational and post-transla-tional levels, leading to the accumulation of cells in G2/M phase.
MIR Exposure Triggered Colocalization of 53BP1 andc -H2AX Nuclear Foci in Response to Reactive Oxygen Species (ROS) Mediated DNA Damage
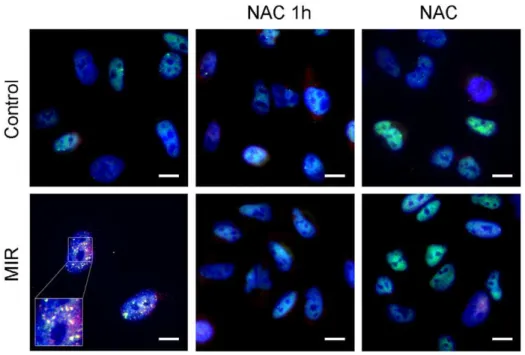
Since MIR activated the ATM/ATR-p53-p21 axis which is the DNA damage checkpoint pathway, it is critical to investigate whether the MIR caused DNA damage in A549 cells. Previous studies showed that tumor suppressor p53 binding protein (53BP1) and c-H2AX participate in the ATM-dependent DNA damage-signaling pathway and form nuclear foci in response to ionizing radiation caused DNA damage [30,31]. To examine this, A549 cells were fixed with acetone and stained for 53BP1 andc-H2AX after MIR exposure. We exhibited that 53BP1 (Figure S3A) andc -H2AX (Figure S3B) were dispersedly localized in the nuclei of unexposed cells, but formed numerous distinguished subnuclear foci in response to MIR. We also demonstrated that the 53BP1 andc-H2AX foci were colocalized in nucei of MIR exposed cells. The formation and the colocalization of 53BP1/c-H2AX foci were diminished upon pretreatment or cotreatment of 10 mM ROS scavenger NAC (Figure 6). We can postulate that MIR induced G2/M cell cycle arrest might result from ROS mediated
DNA damage of which the damage markers 53BP1 andc-H2AX foci were observed in this study.
Discussion
Because the molecular alterations involved in regulating cell cycle progression are accompanied by a failure to arrest proliferation in cancer cells, inhibition of cell proliferation by interfering with the cell cycle is a promising approach for anticancer therapy. In this study, we observed that MIR exposure can inhibit the proliferation of A549 cells (Figure 2A), and also lead to an enlarged, radial apron and rounded shape cell morphology (Figure 2B) by affecting the arrangement and distribution of actin filaments (Figure 3), focal adhesion (Figure 3), and microtubules (Figure 4). The perinuclear fragmented distribution of microtubules is consistent with the cell morphology observed during G2/M cell cycle arrest, which was further validated by analyzing cell cycle distribution, the gene expression and protein regulation of regulators of the G2/M check point (Figure 5). In advanced, we also demonstrated that MIR could induce formation of and colocalization 53BP1 andc-H2AX nuclear foci (Figure 6) in response to DNA damage which typically activates ATM/ATR-p53-p21 pathway resulting G2/M cell cycle arrest.
MIR is the part of the light from solar radiation which can cause DNA damage by direct excitation of DNA or indirect mechanism that involves excitation of other cellular chromophores [32]. The direct excitation process is caused by short wavelength radiation, such as UVB (280–315 nm) and UVC (100–280 nm) and mostly leads to generate cyclobutane pyrimidine dimers and photoprod-ucts, which are produced by absorption of radiation by DNA [32]. On the other hand, the indirect mechanism is contributed by reactive oxygen species (ROS) which is generated by endogenous
Figure 6. Effect of MIR exposure on DNA double strain breaks in A549 cells.Cells were seeded onto the glass coverslip in 12-well plate, exposure by MIR for 48 hours in the presence or absence of 10 mM N-Acetyl-Cysteine (NAC). Cells were treated with NAC for 1 h prior to MIR exposure (NAC 1 h) or cotreated throughout the exposure for 48 h (NAC). Cells were fixed for staining and visualized by fluorescence microscopy. 53BP1 was labeled with rabbit anti-53BP1 antibody and corresponded FITC–conjugated anti-rabbit IgG antibody (green),c-H2AX was labeled with mouse anti-c-H2AX antibody following corresponded PE–conjugated anti-mouse IgG antibody (red), and nuclei were labeled with DAPI (blue). Scale bar represents 10mm.
photosensitizers. The indirect DNA damage is caused by longer wavelength radiation above 320 nm, such as UVA (315–400 nm) and near-visible light, at which DNA absorbs only weakly [33,34]. Radiation with longer wavelength thus is absorbed by photosen-sitizers to generate ROS. After UVA light absorption, endogenous photosensitizer cross over to a triplet state and transfer energy to generate singlet oxygen [35]. These UVA irradiated photosensi-tizers include flavins [36], NADH/NADPH [37], urocanic acid [38] and some sterols [39]. Because of the short half time in cells, the singlet oxygen is only present after radiation [40]. However, ROS can be presented for an extended period after radiation exposure since the additional ROS can be produced by initial species [41]. The superoxide anion radical (NO22), hydrogen
peroxide (H2O2), and hydroxyl radical (NOH) are belonged to ROS
group, all of which can be generated by endogenous mechanism as by-products of normal mitochondrial activity or exogenous stress [42].
Once the exogenous stress induced ROS level are dramatically higher than the cell can eliminate, oxidative stress occurs and results in oxidative DNA damage by DNA protein crosslink, base and sugar modification, depurination or deprimidination [43,44,45,46,47]. The oxidative DNA damage induced by ROS can trigger cell cycle checkpoint responses including recruitment of 53BP1 andc-H2AX followed by degradation of CDC25C for G2/ M arrest as we observed, thus provides additional time for DNA repair [48,49]. Moreover, NIR have been found to generate ROS derived from mitochondria, and cytochromecoxidase have been
suggested as a possible photoreceptor [6,50]. The evidences suggest that IR could accelerate the oxidative phosphorylation reaction in mitochondria by irradiating photoreceptors such as cytochrome c oxidatse and NADH. The enhanced rate in oxidative phosphorylation generates higher ROS thus contributes to indirect damages in DNA.
In this study, we found that MIR exposure suppressed the proteins level of CDC25C and cyclin B1, and inhibited the phosphorylation of CDK1. Downregulation of CDC25C would block the activation of CDK1, resulting in dissociation of cyclin B1 and prevention of cell cycle progression from G2 to M phase. Furthermore, we exhibited that 53BP1 andc-H2AX form numer-ous subnuclear foci in response to MIR treatment. 53BP1 takes part in the ATM-dependent DNA damage-signaling pathway and forms nuclear foci in response to ionizing radiation caused DNA damage [30,31], while c-H2AX facilitates the recruitment of a number of damage response proteins, such as BRCA1, MDC1 and RAD51 for DNA repairing [51,52]. It is possible that MIR exposure induced G2/M arrest is caused by DNA damage, even though the wavelength of MIR is close to NIR which is hard to cause direct damage in DNA. Here, we postulate that MIR exposure may be absorbed by endogenous photosensitizer thus elevating ROS and causing oxidative DNA damage.
Previous studies showed that hydrogen peroxide induced G2/M cell cycle arrest and influenced the organization of microtubules and actin filaments relay on the capacity for reducing the oxidized cytoskeleton proteins or balance of thiol disruption [51,52,53]. Hydrogen peroxide increased monomeric tubulin, but decreased the polymerized tubulin suggesting hydrogen peroxide caused depolymerization of microtubules. In this study, MIR exposure caused the perinuclear distribution and densely aggregation of microtubules thus decreasing the microtubule networks. This observation is similar to microtubule targeting drugs, such as Vinca alkaloids [54]. The perinuclear distribution of microtubules implies that MIR exposure might induce oxidative stress thus disturbing microtubules networks.
In this study, we found that MIR exposure induced DNA damage response. Previous studies showed thatc-H2AX nuclear foci was found to be colocalized with repair proteins involved in homology recombination and nonhomologousend-joining (NHEJ) [55]. Other repair proteins, including MCD1/NFBD1 and 53BP1, were also documented to interact withc-H2AX to form nuclear foci [56]. Previous reports demonstrate that conforma-tional changes in 53BP1 is caused by phosphorylation of 53BP1 by ATM thus exposing the chromatin-binding domain which participates directly in repair of DNA DSBs by activating DNA ligase IV/Xrcc4 complex in NHEJ pathway [57]. In this study, we found that MIR exposure formed nuclear foci of 53BP1 andc -H2AX (Figure 6) implies that MIR exposure induce DNA repair in response to DAN damage.
In summary, this study exhibit MIR of the wavelength in 3– 5mm can alter the organization of actin filament, microtubule and vinculin, and cause inhibition on cell cycle progression through activating ATM/ATR-p53-p21 axis in response to DNA damage, also the Cdc25C regulating pathway in parallel thus resulting in downregulation of dephosphorylation in CDK1 and cyclin B. In particular, our study shows the first evidence on the inhibitory effect of MIR in lung cancer cells and provides useful information for cancer therapy.
Materials and Methods
Middle Infrared Radiation (MIR) Emitter
The wavelength of MIR generated from the wide band blackbody source was limited in the range between 3 to 5mm by using a 3–5mm band pass sapphire wafer (SingHuang Technology Co., Ltd., Taipei, Taiwan) (Figure 1A). The wide band pass filter was designed to isolate 3–5mm atmospheric windows with a diameter of 25.4 mm60.1%. The 50% cut on/ cut off transmission points were set at 3.0mm64% and 5.0mm 64%, respectively. The filter exhibited average transmission in the pass band higher than 60% and less than 0.1% transmission levels outside the pass band. A 300 nm thick molybdenum film was deposited by plasma deposition on the back side of an n-type silicon substrate as a heating source (Figure 1A). The radiation intensity was measured by THORLAB PM100D power meter to be 3 mW/cm2. To maintain the cell culture temperature, recycle cooler machine was set to maintain the temperature of culture medium at 37uC as shown in Figure 1B. Cells seeded onto 12 well tissue culture plates (Corning Costar, Corning, NY, USA) before 24 h of IR exposure were placed on the filter as indicated in Figure 1B.
Cell Culture
Human lung epithelial cells A549 (ATCC, CCL-185) and human fetal lung fibroblast cells MRC5 (ATCC, CCL-171) were obtained from American Type Culture Collection (Manassas, VA, USA). The A549 cells were cultured in Dulbecco’s modified Eagle’s medium (DMEM, Gibco, Grand Island, NY, USA) supplemented with 10% fetal bovine serum (Biological Industries, Beit Haemek, Israel). The MRC5 cells were cultured in Minimum Essential Medium (Gibco) supplemented with 1 mM sodium pyruvate (Gibco), 0.1 mM non-essential amino acid (Gibco), and 10% fetal bovine serum (Gibco). Both the cell lines were free from mycoplasma as detected by PCR based method and cultured at 37uC with 5% CO2.
Immunofluorescence Staining
in the dark for further 48 h. Cells were fixed and permeabilized with precool acetone for 5 min at220uC and then incubated with 1% BSA (Bioshop, Burlington, ON, Canada) in PBS as blocking buffer for 30 min at room temperature. Subsequently, cells were labeled with mouse monoclonal anti-tubulin antibody (Millipore, Billerica, MA, USA; 1:1000), mouse monoclonal anti-vinculin antibody (Millipore; 1:200), rabbit polyclonal anti-53BP1 antibody (GeneTex, San Antonio, TX, USA; 1:500), or mouse anti-c -H2AX antibody (Abcam, Cambridge, MA, USA; 1:500) at 4oC overnight. After washed with PBST (PBS containing 0.05% Tween-20, Sigma-Aldrich, St Louis, MO, USA) three times, cells were labeled with corresponding secondary anti-mouse IgG-Alexa 488 (Invitrogen, Carlsbad, CA; 1:1000), anti-mouse IgG-PE (Abcam; 1:1000), or secondary anti-rabbit FITC-IgG (Millipore; 1:200) for 1 hour in the dark at room temperature. Cells labeled with anti-vinculin were counter stained with TRITC-conjugated Phalloidin (Millipore; 1:1000) for 15 min in the dark at room temperature. The cells were then washed with PBST three times and mounted with ProLongHGold reagent with DAPI (Invitro-gen). Images were acquired by fluorescence microscope with Leica HCX FL PLAN 1006/1.25 oil objective using a SPOT camera (Diagnostic Instruments, Sterling Heights, MI, USA) and SPOT Advanced software (Diagnostic Instruments).
Cell Viability Assay
26104cells were seeded on 12-well plates per well and allowed to attach overnight before MIR exposure. The MTT powder (3[4,5-dimethylthiazol-2-yl)-2,5-diphenyltetrazolium bromide, Sig-ma-Aldrich) were prepared as stock in PBS at the concentration of 5 mg/ml and filtered. After exposed by MIR for 48 h, 150ml MTT solution was added to each well. The cells were incubated at 37uC for 3 hours until the violate crystal formed. Formazan crystals were dissolved with 500ml dimethyl sulfoxide (DMSO, Scharlau Chemie, Barcelona, Spain) and agitated avoided from light for 15 min to completely solubilize the crystals. The absorbance was measured at 570 nm on an ELISA reader (BioRad Laboratories, Hercules, CA, USA). All experiments were repeated three times.
RNA Extraction and Reverse Transcription
Total RNA was isolated using TRIzol reagent (Invotrogen) after 48-h exposure. In brief, 400mL TRIzol reagent (Invitrogen) was added to each well of 12-well TC plate once the medium was removed. Samples were collected from three independent experiments and stored at 280oC. The RNA extraction was performed according to the manual, and the RNA concentration and quality were determined by NanoDrop ND-1000 (NanoDrop Technologies, Montchanin, DE, USA). mRNA were reverstran-scripted by RevertAidTMH Minus First Strand cDNA Synthesis Kit (Thermo Scientific, Waltham, MA). 1mg of total RNA was mixed oligo (dT)18primer and denatured. Subsequently, the RNA sample was mixed with 5X reaction buffer, dNTP, RiboLockTM RNase Inhibitor, and RevertAidTMH Minus Reverse Transcrip-tase. The reverse transcription reaction was performed at 42oC for 60 min and terminated at 70oC for 5 min. The reverse transcription product was directly used in PCR amplification or stored at220oC.
Real Time PCR
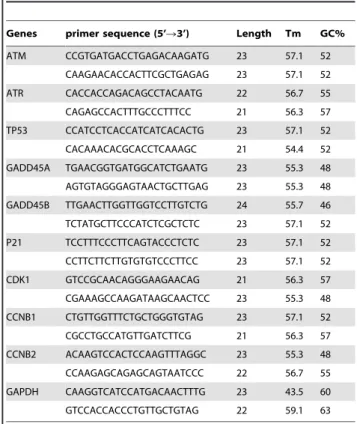
The gene-specific primers for real time PCR were designed by Beacon Designer 7 program (Premier Biosoft International, Palo Alto, CA, USA) and the sequences are listed in Table 1. Real-time quantitative PCR was performed using SYBR Green Supermix (BIO-RAD, Hercules, CA) for 40 amplification cycles in an
iCycler iQ5TM Real-Time PCR Detection System (Bio-Rad Laboratories). Relative transcript quantities were calculated using theDDCt (threshold cycle) method with GAPDH as the reference gene amplified from the samples. All reactions were run in triplicate.
Protein Extraction and Western Blotting
After MIR exposure for 48 h, total protein was extracted using the Trizol reagent (Invitrogen) following the manufacturer’s instructions. Protein was solubilized in lysis buffer (7 M urea (Boehringer, Mannheim, Germany), 2 M thiourea, 4% CHAPS (J. T. Baker, Phillipsburg, NJ, USA) and 0.002% bromophenol blue (Amersco, Solon, OH, USA)) and the protein concentration was determined by BCA method (Pierce Biotech Inc., Rockford, IL, USA). Samples (30mg) were mixed with sodium dodecyl sulfate-polyacrylamide gel electrophoresis (SDS-PAGE) sample buffer, boiled for 5 minutes, electrophoresed on a 10% SDS polyacryl-amide gel, and electroblotted onto polyvinylidene difluoride (PVDF) membrane (Millipore). The membrane was blocked in 5% non-fat milk in TBST for 1 hour with gentle agitation. The membrane was incubated with the following primary antibody diluted in blocking buffer at 4oC overnight: rabbit anti-CDC25C (GeneTex, San Antonio, TX, USA; 1:2000), rabbit anti-phospho-CDK1 (Thr161, Santa Cruz, CA, USA; 1:100), mouse anti-anti-phospho-CDK1 (Santa Cruz; 1:100), rabbit anti-Cyclin B1 (GeneTex; 1:500). To detect Actin, the membrane was stripped, blocked, and incubated with mouse anti-Actin (Millipore; 1:1000) in blocking buffer for 1 hour at room temperature. After washing, the membrane was incubated with appropriate horseradish peroxidase-labeled sec-ondary antibody (Sigma-Aldrich; 1:100000) for 2 hours at room temperature. Signal was developed with ECL detection reagent (Millipore) and exposed to Fuji medical X-ray film.
Table 1.Primers used in qPCR.
Genes primer sequence (5’R3’) Length Tm GC%
ATM CCGTGATGACCTGAGACAAGATG 23 57.1 52
CAAGAACACCACTTCGCTGAGAG 23 57.1 52
ATR CACCACCAGACAGCCTACAATG 22 56.7 55
CAGAGCCACTTTGCCCTTTCC 21 56.3 57
TP53 CCATCCTCACCATCATCACACTG 23 57.1 52
CACAAACACGCACCTCAAAGC 21 54.4 52
GADD45A TGAACGGTGATGGCATCTGAATG 23 55.3 48
AGTGTAGGGAGTAACTGCTTGAG 23 55.3 48
GADD45B TTGAACTTGGTTGGTCCTTGTCTG 24 55.7 46
TCTATGCTTCCCATCTCGCTCTC 23 57.1 52
P21 TCCTTTCCCTTCAGTACCCTCTC 23 57.1 52
CCTTCTTCTTGTGTGTCCCTTCC 23 57.1 52
CDK1 GTCCGCAACAGGGAAGAACAG 21 56.3 57
CGAAAGCCAAGATAAGCAACTCC 23 55.3 48
CCNB1 CTGTTGGTTTCTGCTGGGTGTAG 23 57.1 52
CGCCTGCCATGTTGATCTTCG 21 56.3 57
CCNB2 ACAAGTCCACTCCAAGTTTAGGC 23 55.3 48
CCAAGAGCAGAGCAGTAATCCC 22 56.7 55
GAPDH CAAGGTCATCCATGACAACTTTG 23 43.5 60
GTCCACCACCCTGTTGCTGTAG 22 59.1 63
Cell Cycle Analysis
Cells from six independent experiments were collected, fixed in 70% ethanol, and stored at220uC. Cells were then washed twice with PBS, resuspended in PBS containing 1 mg/mL RNase A and incubated at 37uC for 45 minutes and followed by propidium iodide (PI, 10mg/mL) staining for 15 minutes. The DNA content of cells was then analyzed with a FACSCanto instrument (BD Biosciences Immunocytometry Systems, San Jose, CA, USA). The percentage of cells in different phases of the cell cycle was calculated by MultiCycle (DeNovo software).
Statistics Analysis
Results are expressed as mean6SD. The Student’sttest was
used for analysis of the cell viability assay and real-time PCR data.
Supporting Information
Figure S1 MIR exposed medium does not affect the cell proliferation of A549.A549 cells were seeded in 12-well plates overnight and then seeding medium was replaced with IR-exposed or unexposed (control) medium. Cell proliferation was determined by MTT assay after a 48-h exposure. The data are presented as mean6SD from three independent experiments.
(TIF)
Figure S2 The cell viability and morphology of MRC-5 cells were not affected by 48-hour exposure to MIR.(A) Proliferation of MRC-5 cells was determined by an MTT assay as
described in materials and methods. The data are presented as mean 6 SD from three independent experiments. (B) Cell morphology was observed by phase-contrast microscopy. Scale bar represents 50mm.
(TIF)
Figure S3 Effect of MIR exposure on DNA double strain breaks in A549 cells.Cells were seeded onto the glass coverslip in 12-well plate, exposure by MIR for 48 hours, fixed for staining and visualized by fluorescence microscopy. (A) 53BP1 was labeled with anti-53BP1 antibody and corresponded FITC– conjugated secondary antibody (green), and nuclei were stained with DAPI (blue). (B) c-H2AX was labeled with anti-c-H2AX antibody following corresponded FITC–conjugated secondary antibody (green) and nuclei were labeled with DAPI (blue). Scale bar represents 10mm.
(TIF)
Acknowledgments
We would like to thank the Technology Commons at National Taiwan University for instrumental support.
Author Contributions
Conceived and designed the experiments: HYC HFJ SCL. Performed the experiments: HYC MHS SRT. Analyzed the data: HYC MHS HCH HFJ. Contributed reagents/materials/analysis tools: HCH HFJ SCL. Wrote the paper: HYC MHS HCH HFJ SCL.
References
1. Siegel R, Naishadham D, Jemal A (2012) Cancer statistics, 2012. CA Cancer J Clin 62: 10–29.
2. Travis WD, Brambilla E, Noguchi M, Nicholson AG, Geisinger K, et al. (2011) International Association for the Study of Lung Cancer/American Thoracic Society/European Respiratory Society: international multidisciplinary classifi-cation of lung adenocarcinoma: executive summary. Proc Am Thorac Soc 8: 381–385.
3. Samet JM, Avila-Tang E, Boffetta P, Hannan LM, Olivo-Marston S, et al. (2009) Lung cancer in never smokers: clinical epidemiology and environmental risk factors. Clin Cancer Res 15: 5626–5645.
4. Ferlay J, Shin HR, Bray F, Forman D, Mathers C, et al. (2010) Estimates of worldwide burden of cancer in 2008: GLOBOCAN 2008. Int J Cancer 127: 2893–2917.
5. Graf A, Arndt M, Sauer M, Gerlach G (2007) Review of micromachined thermopiles for infrared detection. Meas Sci Technol 18: R59.
6. Schroeder P, Pohl C, Calles C, Marks C, Wild S, et al. (2007) Cellular response to infrared radiation involves retrograde mitochondrial signaling. Free Radic Biol Med 43: 128–135.
7. Menezes S, Coulomb B, Lebreton C, Dubertret L (1998) Non-coherent near infrared radiation protects normal human dermal fibroblasts from solar ultraviolet toxicity. J Invest Dermatol 111: 629–633.
8. Frank S, Oliver L, Lebreton-De Coster C, Moreau C, Lecabellec MT, et al. (2004) Infrared radiation affects the mitochondrial pathway of apoptosis in human fibroblasts. J Invest Dermatol 123: 823–831.
9. Kim MS, Kim Y, Cho K, Chung J (2006) Infrared exposure induces an angiogenic switch in human skin that is partially mediated by heat. Br J Dermatol 155: 1131–1138.
10. Rau CS, Yang JCS, Jeng SF, Chen YC, Lin CJ, et al. (2011) Far-infrared radiation promotes angiogenesis in human microvascular endothelial cells via extracellular signal-regulated kinase activation. Photochem Photobiol 87: 441– 446.
11. Inoue´ S, Kabaya M (1989) Biological activities caused by far-infrared radiation. Int J Biometeorol 33: 145–150.
12. Yu SY, Chiu JH, Yang SD, Hsu YC, Lui WY, et al. (2006) Biological effect of far-infrared therapy on increasing skin microcirculation in rats. Photodermatol Photoimmunol Photomed 22: 78–86.
13. Lin CC, Liu XM, Peyton K, Wang H, Yang WC, et al. (2008) Far infrared therapy inhibits vascular endothelial inflammation via the induction of heme oxygenase-1. Arterioscler Thromb Vasc Biol 28: 739–745.
14. Ishibashi J, Yamashita K, Ishikawa T, Hosokawa H, Sumida K, et al. (2008) The effects inhibiting the proliferation of cancer cells by far-infrared radiation (FIR) are controlled by the basal expression level of heat shock protein (HSP) 70A. Med Oncol 25: 229–237.
15. Yamashita K, Dalkhsuren SO, Ishikawa T, Sumida K, Ishibashi J, et al. (2010) Far infrared ray radiation inhibits the proliferation of A549, HSC3 and Sa3
cancer cells through enhancing the expression of ATF3 gene. J Electromagn Anal Appl 2: 382–394.
16. Socrates G (1980) Infrared Characteristic Group Frequencies. New York: John Wiley & Sons. 366 p.
17. Pollard TD, Cooper JA (2009) Actin, a central player in cell shape and movement. Science 326: 1208–1212.
18. Gardel ML, Schneider IC, Aratyn-Schaus Y, Waterman CM (2010) Mechanical integration of actin and adhesion dynamics in cell migration. Annu Rev Cell Dev Biol 26: 315–533.
19. Mierke CT (2009) The role of vinculin in the regulation of the mechanical properties of cells. Cell Biochem Biophys 53: 115–126.
20. Risinger AL, Giles FJ, Mooberry SL (2009) Microtubule dynamics as a target in oncology. Cancer Treat Rev 35: 255–261.
21. Chang CH, Yu FY, Wu TS, Wang LT, Liu BH (2011) Mycotoxin citrinin induced cell cycle G2/M arrest and numerical chromosomal aberration associated with disruption of microtubule formation in human cells. Toxicol Sci 119: 84–92.
22. Ciccia A, Elledge SJ (2010) The DNA damage response: making it safe to play with knives. Mol Cell 40: 179–204.
23. Chan TA, Hwang PM, Hermeking H, Kinzler KW, Vogelstein B (2000) Cooperative effects of genes controlling the G2/M checkpoint. Genes Dev 14: 1584–1588.
24. Vairapandi M, Balliet AG, Hoffman B, Liebermann DA (2002) GADD45b and GADD45g are cdc2/cyclinB1 kinase inhibitors with a role in S and G2/M cell cycle checkpoints induced by genotoxic stress. J Cell Physiol 192: 327–338. 25. Lo¨brich M, Jeggo PA (2007) The impact of a negligent G2/M checkpoint on
genomic instability and cancer induction. Nat Rev Cancer 7: 861–869. 26. Squatrito M, Brennan CW, Helmy K, Huse JT, Petrini JH, et al. (2010) Loss of
ATM/Chk2/p53 pathway components accelerates tumor development and contributes to radiation resistance in gliomas. Cancer Cell 18: 619–629. 27. Malumbres M, Barbacid M (2009) Cell cycle, CDKs and cancer: a changing
paradigm. Nat Rev Cancer 9: 153–166.
28. Lapenna S, Giordano A (2009) Cell cycle kinases as therapeutic targets for cancer. Nat Rev Drug Discov 8: 547–566.
29. Potapova TA, Daum JR, Byrd KS, Gorbsky GJ (2009) Fine tuning the cell cycle: activation of the Cdk1 inhibitory phosphorylation pathway during mitotic exit. Mol Biol Cell 20: 1737–1748.
30. FitzGerald JE, Grenon M, Lowndes NF (2009) 53BP1: function and mechanisms of focal recruitment. Biochem Soc Trans 37: 897–904.
31. Polo SE, Jackson SP (2011) Dynamics of DNA damage response proteins at DNA breaks: a focus on protein modifications. Genes Dev 25: 409–433. 32. Cadet J, Anselmino C, Douki T, Voituriez L (1992) Photochemistry of nucleic
33. Wells R, Han A (1984) Action spectra for killing and mutation of Chinese hamster cells exposed to mid-and near-ultraviolet monochromatic light. Mutat Res 129: 251–258.
34. Jones CA, Huberman E, Cunningham ML, Peak MJ (1987) Mutagenesis and cytotoxicity in human epithelial cells by far-and near-ultraviolet radiations: action spectra. Radiat Res 110: 244–254.
35. Baier J, Maisch T, Maier M, Engel E, Landthaler M, et al. (2006) Singlet oxygen generation by UVA light exposure of endogenous photosensitizers. Biophys J 91: 1452–1459.
36. Viteri G, Edwards AM, De la Fuente J, Silva E (2003) Study of the interaction between triplet riboflavin and the alpha-, betaH- and betaL-crystallins of the eye lens. Photochem Photobiol 77: 535–540.
37. Sohal RS, Weindruch R (1996) Oxidative stress, caloric restriction, and aging. Science 273: 59–63.
38. Hanson KM, Simon JD (1998) Epidermal trans-urocanic acid and the UV-A-induced photoaging of the skin. Proc Natl Acad Sci U S A 95: 10576–10578. 39. Albro PW, Bilski P, Corbett JT, Schroeder JL, Chignell CF (1997)
Photochemical Reactions and Phototoxicity of Sterols: Novel Self-perpetuating Mechanism for Lipid Photooxidation. Photochem Photobiol 66: 316–325. 40. Skovsen E, Snyder JW, Lambert JDC, Ogilby PR (2005) Lifetime and diffusion
of singlet oxygen in a cell. J Phys Chem B 109: 8570–8573.
41. Valencia A, Rajadurai A, Carle AB, Kochevar IE (2006) 7-Dehydrocholesterol enhances ultraviolet A-induced oxidative stress in keratinocytes: roles of NADPH oxidase, mitochondria, and lipid rafts. Free Radic Biol Med 41: 1704–1718.
42. Devasagayam T, Tilak J, Boloor K, Sane K, Ghaskadbi S, et al. (2004) Free radicals and antioxidants in human health: current status and future prospects. J Assoc Physicians India 52: 794–804.
43. Harper JV, Anderson JA, O’Neill P (2010) Radiation induced DNA DSBs: Contribution from stalled replication forks? DNA Repair. 9: 907–913. 44. Maynard S, Schurman SH, Harboe C, de Souza-Pinto NC, Bohr VA (2009)
Base excision repair of oxidative DNA damage and association with cancer and aging. Carcinogenesis 30: 2–10.
45. Kasprzak KS (1995) Possible role of oxidative damage in metal-induced carcinogenesis. Cancer Invest 13: 411–430.
46. Kielbassa C, Roza L, Epe B (1997) Wavelength dependence of oxidative DNA damage induced by UV and visible light. Carcinogenesis 18: 811–816. 47. Kvam E, Tyrrell RM (1997) Induction of oxidative DNA base damage in human
skin cells by UV and near visible radiation. Carcinogenesis 18: 2379–2384. 48. Ditch S, Paull TT (2012) The ATM protein kinase and cellular redox signaling:
beyond the DNA damage response. Trends Biochem Sci 37: 15–22. 49. Tanner JJ, Parsons ZD, Cummings AH, Zhou H, Gates KS (2011) Redox
regulation of protein tyrosine phosphatases: structural and chemical aspects. Antioxid Redox Signal 15: 77–97.
50. Karu T (1999) Primary and secondary mechanisms of action of visible to near-IR radiation on cells. J Photochem Photobiol B 49: 1–17.
51. Lee CF, Liu CY, Hsieh RH, Wei YH (2005) Oxidative stress-induced depolymerization of microtubules and alteration of mitochondrial mass in human cells. Ann N Y Acad Sci 1042: 246–254.
52. Milzani A, DalleDonne I, Colombo R (1997) Prolonged oxidative stress on actin. Arch Biochem Biophys 339: 267–274.
53. Avery S (2011) Molecular targets of oxidative stress. Biochem J 434: 201–210. 54. Ngan VK, Bellman K, Hill BT, Wilson L, Jordan MA (2001) Mechanism of
mitotic block and inhibition of cell proliferation by the semisynthetic Vinca alkaloids vinorelbine and its newer derivative vinflunine. Mol Pharmacol 60: 225–232.
55. Mah LJ, El-Osta A, Karagiannis TC (2010) gammaH2AX: a sensitive molecular marker of DNA damage and repair. Leukemia 24: 679–86.
56. Morris JR (2010) Cancer Res. More modifiers move on DNA damage. 70: 3861–3863.