Discovery of Transcription Factors and
Regulatory Regions Driving
In Vivo
Tumor
Development by ATAC-seq and FAIRE-seq
Open Chromatin Profiling
Kristofer Davie1‡, Jelle Jacobs1‡, Mardelle Atkins2,3, Delphine Potier1, Valerie Christiaens1, Georg Halder2,3, Stein Aerts1*
1Laboratory of Computational Biology, Center for Human Genetics, KU Leuven, Leuven, Belgium,2 Laboratory of Growth Control and Cancer Research, Center for Human Genetics, KU Leuven, Leuven, Belgium,3VIB Center for the Biology of Disease, Laboratory for Molecular Cancer Biology, Leuven, Belgium
‡These authors contributed equally to this work. *[email protected]
Abstract
Genomic enhancers regulate spatio-temporal gene expression by recruiting specific combi-nations of transcription factors (TFs). When TFs are bound to active regulatory regions, they displace canonical nucleosomes, making these regions biochemically detectable as nucleosome-depleted regions or accessible/open chromatin. Here we ask whether open chromatin profiling can be used to identify the entire repertoire of active promoters and en-hancers underlying tissue-specific gene expression during normal development and onco-genesis in vivo. To this end, we first compare two different approaches to detect open chromatin in vivo using the Drosophila eye primordium as a model system: FAIRE-seq, based on physical separation of open versus closed chromatin; and ATAC-seq, based on preferential integration of a transposon into open chromatin. We find that both methods re-producibly capture the tissue-specific chromatin activity of regulatory regions, including pro-moters, enhancers, and insulators. Using both techniques, we screened for regulatory regions that become ectopically active during Ras-dependent oncogenesis, and identified 3778 regions that become (over-)activated during tumor development. Next, we applied motif discovery to search for candidate transcription factors that could bind these regions and identified AP-1 and Stat92E as key regulators. We validated the importance of Stat92E in the development of the tumors by introducing a loss of function Stat92E mutant, which was sufficient to rescue the tumor phenotype. Additionally we tested if the predicted Stat92E responsive regulatory regions are genuine, using ectopic induction of JAK/STAT signaling in developing eye discs, and observed that similar chromatin changes indeed oc-curred. Finally, we determine that these are functionally significant regulatory changes, as nearby target genes are up- or down-regulated. In conclusion, we show that FAIRE-seq and ATAC-seq based open chromatin profiling, combined with motif discovery, is a straightfor-ward approach to identify functional genomic regulatory regions, master regulators, and gene regulatory networks controlling complex in vivo processes.
OPEN ACCESS
Citation:Davie K, Jacobs J, Atkins M, Potier D, Christiaens V, Halder G, et al. (2015) Discovery of Transcription Factors and Regulatory Regions Driving In VivoTumor Development by ATAC-seq and
FAIRE-seq Open Chromatin Profiling. PLoS Genet 11 (2): e1004994. doi:10.1371/journal.pgen.1004994
Editor:Peter McKinnon, St Jude Children's Research Hospital, United States of America
Received:October 12, 2014
Accepted:January 8, 2015
Published:February 13, 2015
Copyright:© 2015 Davie et al. This is an open access article distributed under the terms of the Creative Commons Attribution License, which permits unrestricted use, distribution, and reproduction in any medium, provided the original author and source are credited.
Data Availability Statement:All raw and processed next generation sequencing data are available from the GEO database (accession number GSE59078). Processed data can also be viewed at the UCSC genome browser using the following hub URL http://genome.ucsc.edu/cgi-bin/hgTracks?db= dm3&hubUrl=http://ucsctracks.aertslab.org/ATAC-paper/hub.txt
Author Summary
The functional expression of all genes is regulated by proteins, namely transcription fac-tors that bind to specific areas of DNA known as regulatory regions. Whereas most DNA in our genome is normally bound by other proteins (histones) and packaged into units called nucleosomes, a specific subset of tissue-specific regulatory regions is responsible for tissue-specific gene expression; these active regions are nucleosome-depleted and bound by transcription factors. We use two techniques to identify these open chromatin regions,
in a normal tissue and a RasV12induced cancer tissue. We discovered a remarkable change
in the accessible regulatory landscape between these two tissues, with several thousand re-gions becoming more accessible in the cancer tissue. We identified two transcription fac-tors known to be involved in cancer (AP-1 and Stat92E) controlling these newly accessible regulatory regions. Finally, we introduced a mutation resulting in Stat92E becoming non-functional in the cancer tissue, which decreased the severity of the tumor. Our study shows that open chromatin profiling can be used to identify complex in vivo processes, and we shed new light on Ras dependent cancer development.
Introduction
Gene expression in higher eukaryotes is tightly controlled by complexcis-regulatory systems
consisting of multiple enhancers modulating the transcription levels of a target gene. Mapping all active promoters and enhancers in a cell type provides an entry point to reverse engineer the
functional gene regulatory network and to decipher the genomiccis-regulatory logic
underly-ing a cell type’s functional transcriptome. Understanding changes in regulatory landscapes
be-tween different cell types, for example during cellular differentiation, or bebe-tween normal and diseased cellular states, can furthermore provide a bridge between the genomic sequence and emerging transcriptome changes. Recent advances in chromatin studies have uncovered several characteristic features of active and repressed chromatin within and around regulatory regions. A typical active promoter or enhancer in higher eukaryotes is depleted for nucleosomes over relatively large regions of up to hundreds of base pairs, often spanning the entire enhancer
length [1]. In addition, nucleosomes flanking active regulatory regions usually carry histone
modifications, such as H3K27Ac and H3K4me1 [2], and in human and other vertebrates,
ac-tive promoters and enhancers may have dynamic hyper- or hypomethylated CpG dinucleo-tides, denoting inactive and active enhancers respectively, whereby changes in methylation
usually accompany changes in activity [3]. All of these features, to some extent, correlate
signif-icantly with the expression of the target gene(s) that they control [1,4]. Furthermore, these
fea-tures can be exploited to identify regulatory regions at a genome-wide scale, for example, integrative methods have been developed based on Hidden Markov Models that accurately pre-dict various types of regulatory regions using particular combinations of histone modifications
[5]. Another, more recently discovered feature of active enhancers is that RNA, known as
eRNA, is transcribed from them in a bidirectional way by RNApolII [4]. This property was
used in the Fantom project and lead to the identification of*44,000 tissue and cell type
specif-ic enhancers in the human genome. However, the technique that has been primarily used to map regulatory landscapes across hundreds of human cell lines, notably in the ENCODE and Epigenomics Roadmap projects, is the detection of open chromatin using DNaseI
www.kuleuven.be/research/funding/bof/) (grant PF/ 10/016 and OT/13/103 to SA), HFSP (www.hfsp.org) (grant RGY0070/2011 to SA), Foundation Against Cancer (http://www.cancer.be) (grants 2010-154 and 2012-F2 to SA). JJ has a PhD Fellowship from the agency for Innovation by Science and Technology (IWT,www.iwt.be). The funders had no role in study design, data collection and analysis, decision to publish, or preparation of the manuscript.
hypersensitivity coupled with high throughput sequencing (DNaseI-seq) [1,6,7]. DNaseI-seq identifies regions by fragmenting chromatin with the DNase I enzyme, an endonuclease that randomly cleaves regions of accessible DNA, and for which cleavage is hindered by the pres-ence of nucleosomes. This cleavage results in an increased number of cut sites in nucleosome-depleted regions, generating fragments with smaller sizes, allowing their enrichment based on size-selection, before high-throughput sequencing. As such, DNaseI-seq has mapped genome-wide regulatory element across many human and mouse cell types, as well as across
develop-mental stages during Drosophila embryogenesis [8]. DNaseI-seq however, has some limitations
as it requires large amounts of input material and has a complicated procedure. Consequently,
it has been mainly applied toin vitrocell cultures and cancer cell lines and has seen limited
ap-plications to in vivo post-embryonic biological systems. For example, it is generally not possible with this approach to assay to what extent the open chromatin profile of cells within a tumor, or during tumor development, is altered. It is indeed conceivable that the joint interpretation of cancer genomes and cancer transcriptomes, both of which can be sequenced directly from
tumor biopsies down to the single cell level, will require the intermediate layer of the“
function-al genome”to permit us to understand how the epigenomic changes drive changes in gene
ex-pression. Therefore, to profile this chromatin layer, alternative approaches are required to progress towards smaller cell populations.
Two alternative methods for open chromatin profiling were recently developed which over-come the limitation of sample size, namely FAIRE-seq (Formaldehyde Assisted Isolation of
Regulatory Elements) [9], and ATAC-seq (Assay for Transposase Accessible Chromatin) [10].
We wanted to know whether these methods are both suitable to identify the functional regula-tory elements operating in a wild type tissue or in a tumor. FAIRE-seq relies on the separation of open versus closed chromatin by phenol-chloroform extraction, whereby fragments with high nucleosome content are captured in the organic phase, and sequencing libraries are
pre-pared from the aqueous phase [9]. FAIRE-seq derived genome-wide enhancer maps, although
noisier than DNaseI-seq have been shown to be highly correlated with DNaseI-seq [11].
FAIRE-seq has recently been applied successfully to identify differential enhancer usage be-tween multiple Drosophila tissues and developmental time points, finding thousands of
en-hancers that change activity during development [12]. The most recent method, ATAC-seq,
uses a bacterial (Tn5) transposase, an enzyme that inserts a short fragment of DNA (a transpo-son) into another molecule of DNA, or in this case, inserts two short fragments separate from
each other [10]. As the transposase is unable to access DNA that is either bound by
nucleo-somes or strongly bound transcription factors, it integrates its transposons preferentially into accessible or open chromatin. In the case of ATAC-seq the transposase inserts two fragments
of DNA which act as tags, and a mechanism to fragment the DNA (as they are inserted*9
base pairs apart), a process known as tagmentation [13]. Buenrostro et al. recently showed that
ATAC-seq was able to accurately identify the nucleosome free regions of a lymphoblastoid cell line (GM12878), and the authors were able to obtain profiles comparable to DNaseI-seq in
sig-nal to noise ratio and specificity from much lower quantities of cells (100–10000 fold less) than
generally used for DNaseI-seq [10]. This technique is thus promising to apply to dissected
tis-sues, for example by micro-dissection of tumor samples, sorting of low populations of cells or other low-input samples.
based on the over-expression of oncogenic RasV12combined with the loss of the cell polarity genescribble(scrib), and is a well-established model to study Ras-dependent oncogenesis in
vivo [14,15]. The combination of RasV12andscrib-/-mutations cause differentiation defects,
coupled with over-proliferation and invasion of the surrounding tissue [16]. Whether such a
severe phenotypic change is driven by transcription factors operating within a stable, un-changed chromatin state, or whether changing gene expression profiles are accompanied by widespread changes in the regulatory landscape, has not yet been investigated. Given the simi-larity between this invasive cancer model and the mesenchymal state transitions occurring in human epithelial cancers, such as epithelial-to-mesenchymal transition, further insight into chromatin modulation in this model system may also be relevant to understand regulatory changes during human oncogenic processes.
Our results suggest that open chromatin profiling can provide valuable and previously un-obtainable information crucial for understanding how regulatory information is encoded in the genome and how regulatory programs determine phenotype and behavior in vivo.
Results
ATAC-seq and FAIRE-seq identify regulatory regions with active
chromatin in Drosophila eye development
The larval eye-antennal disc ofDrosophila melanogasteris a widely used model system for the
study of spatio-temporal gene regulation and cellular differentiation. This is because in one tis-sue both dimensions of "time and space" are present, with cells in many different states, from pluripotent cells and specified neuronal precursors, to the lineage committed sensory neurons
and accessory cells [17–20]. To map the plethora of regulatory regions operating in all of these
cell types, and to simultaneously assess the performance of different biochemical approaches to identify accessible regions, we applied both ATAC-seq and FAIRE-seq to several different
ge-notypes of wild type eye-antennal discs (seeMaterials and Methods) (Fig. 1). When looking at
well-known master regulators of eye development, such asOptixandsine oculis(so), we found
both methods to yield highly reproducible results whereby the open chromatin peaks mark
previously known enhancers within these genes (Fig. 1). Peaks called by both methods highly
overlap (Fig. 2A), and the normalized peak heights between the methods are strongly
correlat-ed (Fig. 2B-D). Both methods show a similar distribution of peaks within promoters, intronic, and intergenic regions, and a very strong depletion in coding exons, although ATAC-seq peaks are slightly more biased towards distal regions relative to promoter peaks than FAIRE-seq (S1 Fig.).
To investigate how accurately these methods can identify promoters, enhancers, and insula-tors, we looked in turn to each of these three classes of regulatory elements. Firstly, the accessi-bility of promoters and transcription start sites is overall highly enriched for both methods, although ATAC-seq shows slightly lower background levels, indicating a higher
signal-to-noise ratio for ATAC-seq (Fig. 2E). Secondly, to evaluate whether distal open chromatin peaks
also identify functional enhancers, we made use of two collections of Drosophila enhancers,
namely the REDFly database and the FlyLight [21] database. Out of 56 REDFly enhancers that
are active in the eye, ATAC-seq and FAIRE-seq recover 28 and 24 respectively whilst combined they recover 34. The recovery rates for eye enhancers are the highest of all tested enhancer cate-gories from REDFly, which illustrates the specificity of these approaches at similar thresholds
in the ranked list of all genomic regions (S2 Fig.). Likewise, eye enhancers from the FlyLight
da-tabase show increased chromatin activity (Fig. 2F); and the highest overlap between our open
enhancers [22] (Fig. 2G). Although both approaches have a good performance for enhancer
de-tection, ATAC-seq shows a higher recall of true enhancers than FAIRE-seq, detecting*18.75%
more enhancers (blue versus red bars inFig. 2G), even at similar levels of specificity (S2 Fig.).
Thirdly, we also asked whether the open chromatin peaks overlap with one more regulatory ge-nomic feature, namely functional insulators. To identify insulators, we performed ChIP-seq against CTCF in the wild type eye-antennal disc, under the same conditions as the ATAC-seq
and FAIRE-seq (seeMaterials and Methods). We identified 3682 CTCF peaks, which are
sig-nificantly enriched for the CTCF motif (PeakMotif adj. p-value = 2.6310–15) (Fig. 3A). Based
on this motif, we selected 805 high-confidence CTCF binding sites, having both a significant peak and a significant motif. Both ATAC-seq and FAIRE-seq signals are strongly enriched in
the regions around the CTCF binding sites (Fig. 3A-C). Generally, CTCF peaks were identified
as accessible regions, with 2244 of all the 3682 CTCF peaks overlapping (minimum 40%) with ATAC or FAIRE peaks. Of the 805 high-confidence CTCF sites, 279 and 278 are effectively (minimum 40% overlap) called as peaks by ATAC-seq and FAIRE-seq respectively, indicating a highly similar detection rate of both techniques. Thus, both approaches allow for efficient ge-nome-wide detection of promoters and enhancers whilst also detecting insulator sites, starting from low input tissue samples.
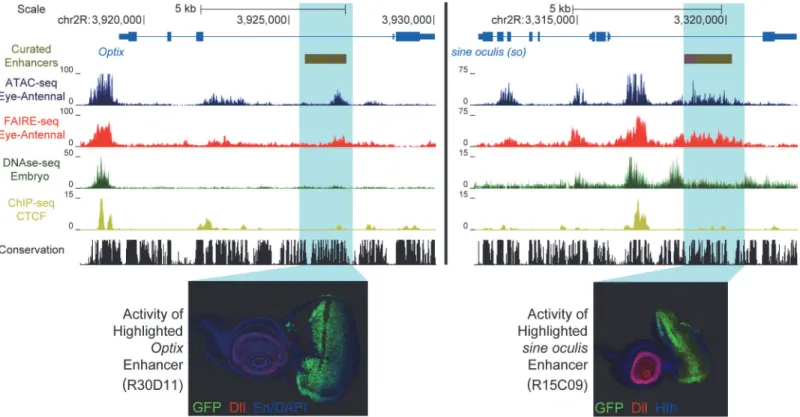
Fig 1. Enhancer identification in the eye primordium by ATAC-seq and FAIRE-seq.Two example eye-related genes from theDrosophila melanogaster
genome (dm3). Tracks shown include: experimentally validated enhancers from ORegAnno and REDFly [72,73] (shown in Gold), coverage data in the eye-antennal disc for ATAC-seq (Blue), FAIRE-seq (Red) and CTCF ChIP (Yellow), DNaseI-seq (Green) from whole stage 11 embryos [8] and finally sequence conservation across 14 Drosophila species (Black). On the left the gene locus ofOptixis shown. The region in gold is a known enhancer with binding sites for Eyeless overlaid in purple, with FlyLight enhancer activity of R30D11 below. This region is identified as a peak in both ATAC-seq and FAIRE-seq in the eye, but not in embryonic DNaseI-seq. On the right is the gene locus ofsine oculis(so). The region in gold is a known enhancer with binding sites for Eyeless and Twin of Eyeless overlaid in purple. The reporter activity of this enhancer (R15C09) is shown by the Janelia Farm FlyLight project. Again, this enhancer is identified as a peak in both ATAC-seq and FAIRE-seq but not in embryonic DNaseI-seq. In both examples, peaks can be seen in the CTCF ChIP-seq data corresponding to regions identified as open by all three other techniques. Some small differences between ATAC-seq and FAIRE-seq can also be seen, including a higher background signal for FAIRE-seq. Images obtained from the FlyLight database (http://flweb.janelia.org/cgi-bin/flew.cgi).
TF footprinting and nucleosome packing can be revealed by ATAC-seq
To further analyze the resolution of both open chromatin profiling methods we assessed whether
ATAC-seq and FAIRE-seq can be used for transcription factor footprinting [23]. In the original
publication of ATAC-seq [10], it was shown that CTCF binding regions, determined by
ChIP-seq, show increased ATAC-seq signals, while certain nucleotides within the actual CTCF binding site are protected from tagmentation, similar to protection from DNaseI cleavage in DNaseI-seq. To test whether this is also the case in Drosophila eye development, we centered the 805 high-confidence CTCF peaks on the best scoring occurrence of the CTCF motif (we used the strongest
enriched PWM) to investigate open chromatin signals around CTCF binding sites (Fig. 3A) with
background signal removed. Similarly to DNaseI-seq, for ATAC-seq the actual CTCF sites show a clear drop in cut sites. This indicates that, although the regions are generally open and therefore accessible by the transposase, the CTCF protein protects its binding site from being cut at specific
nucleotides (Fig. 3B-C). This further demonstrates the high degree of resolution obtained with
ATAC-seq while identifying active genomic regulatory elements.
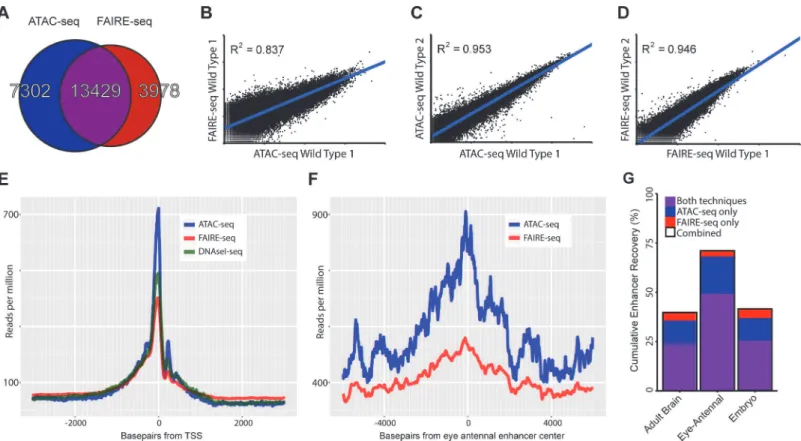
Fig 2. Comparing general features of ATAC-seq and FAIRE-seq.(A) Venn diagram of peaks called for each technique and the overlap between techniques. (B-D) Correlation plots for replicates of both techniques showing normalized read counts for the entire genome split into regions based on conservation [32]. Both techniques correlate very well within techniques (r2*0.95) despite each wild type sample being from differentD.melanogaster
genetic backgrounds. Correlation between the techniques on the same sample was 0.837; in this case FAIRE-seq seems to reach a limit of signal strength before ATAC-seq does. (E) Aggregation plot showing the aggregated signal for each technique across all transcription start sites (TSS) throughout the genome with a 2.5kb window on either side. Although each technique is enriched exactly at the TSS, there are large differences in the size of this peak, despite being normalized to the total read count within these regions. Note that the background level of FAIRE-seq is higher than that of ATAC-seq and DNaseI-seq which are roughly equal, indicating increased noise level in FAIRE-seq. (F) Aggregation plot showing the aggregated signal for ATAC-seq and FAIRE-seq across all Janelia Farm eye-antennal enhancers with a 5kb window on either side. A more distinct peak can be seen in ATAC-seq which also has a higher level overall, due to the fact that it recovers more enhancers than FAIRE-seq. (G) Sets of enhancers known to be expressed in specific tissues were extracted from the FlyLight database [21], these were then compared with the peaks identified from our ATAC-seq and FAIRE-seq data. The set with the most number of enhancers recovered was the eye-antennal enhancers with a total of 71.01% recovered, whilst 49.31% were recovered by both techniques, an extra 18.75% were identified by ATAC-seq only and 2.95% were identified by FAIRE-seq only.
A second structural feature of ATAC-seq, as shown in the original publication for human chromatin in vitro, is its ability to correlate distances between cut sites with nucleosomal
posi-tioning [24]. To assess whether such information could also be obtained from small in vivo
samples in Drosophila, we sequenced two samples with paired-end sequencing at low coverage, and found a distribution of insert sizes that almost perfectly resembles that of human
chroma-tin (Fig. 3D-E). Interestingly, this analysis also shows that even by shallow sequencing, with as
few as 0.5 million mapped reads, regulatory regions can be accurately identified across the
en-tire genome due to the high signal-to-noise ratio of ATAC-seq (S3 Fig.), and that both
single-end and paired-single-end sequencing provide near identical results (S4 Fig.). Taken together, these
two experiments illustrate that ATAC-seq can identify nucleosome-depleted regions, and pro-tected nucleotides at high resolution, even from low-input in vivo material from a
heterogeneous tissue.
Ras-driven oncogenesis drastically reshapes the open chromatin
landscape
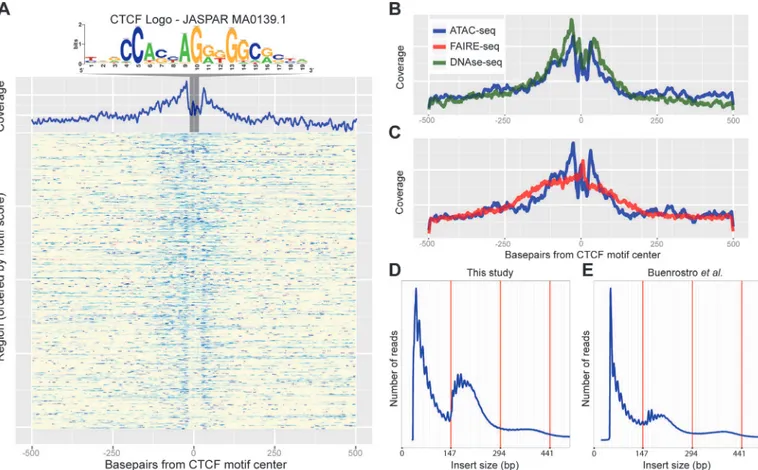
Encouraged by the power of ATAC-seq and FAIRE-seq to identify active regulatory regions in heterogeneous wild type tissues, we combined both methods to map all the differentially Fig 3. Recovery of known enhancers and CTCF footprinting by ATAC-seq.(A) Heatmap of ATAC-seq Tn5 transposase cut site occurrence in 500bp around 805 CTCF ChIP peaks centered on the JASPAR-MA0139.1 (CTCF) motif, highlighted and shown above. An aggregation plot shows the overall profile and protection at the motif. (B-C) Comparisons of the DNaseI-seq and FAIRE-seq cut sites respectively with the ATAC-seq profile. DNaseI-seq has a very similar profile whilst FAIRE-seq shows enrichment around the motif but with no protection. (D-E) Histograms showing the frequency of insert sizes from both this study in Drosophila (D) and the study by Buenrostroet al. in humans (E) [24]. Red lines indicate the amount of DNA bound by one, two and three nucleosomes.
activated regulatory regions during tumor development. To this end, we used a well-established cancer model in which the eye disc is transformed by over-expression of oncogenic Ras protein
(RasV12) in combination with a homozygousscrib-/-mutation (Fig. 4A-E). The combination of
these two perturbations in clones of cells in the eye disc has been shown to generate invasive
tu-mors and to serve as abona fidecancer model [14,25–29], but there is only limited molecular
and pathway characterization of these tumors.
To identify which parts of the genome are differentially open in the tumors we performed
ATAC-seq and FAIRE-seq both on early tumors (RSE,Fig. 4C,D) and late tumors (RSL,
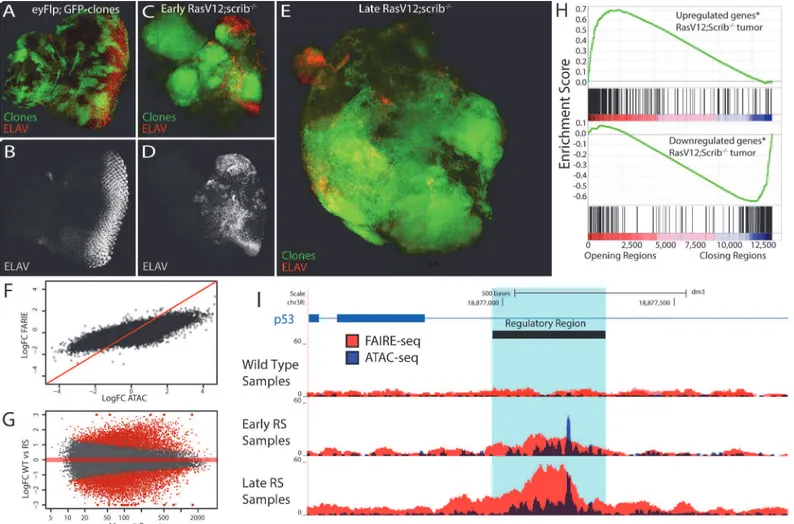
Fig. 4E) (seeMaterials and Methods) and compared their open chromatin landscapes to that of the wild type tissue. We found that the regulatory landscape in tumors is drastically different from the wild type, having both thousands of significantly increased peaks (4851 for ATAC-Fig 4. The tumor chromatin landscape.(A-E) Confocal images of eye imaginal discs, clones are indicated by GFP expression (green) and neuronal differentiation is visualized by an ELAV staining (red or grey). (A-B) Control disc showing a normal photoreceptor differentiation pattern (y,w,eyFlp; act>y+>Gal4, UAS-GFP; FRT82). (C-D) Early oncogenesis (day7), the clones are homozygousscribblemutant and overexpress Rasv12(RasV12;scrib-/-),
changing the morphology of the disc and blocking photoreceptor differentiation (y,w,eyFlp; act>y+>Gal4, UAS-GFP, UAS-RasV12; FRT82 scrib2-,e). (E) Late
oncogenesis (day 9), the clones have overgrown neighboring tissue and formed a massive tumor. (F) Comparing the log fold change of the differential peaks between tumor and wild type, for FAIRE (y-axis) and ATAC (x-axis) shows the greater dynamic range of ATAC. (G) MA-plot of the 36506 peaks with their mean number of counts (x-axis) and their log fold change between wild type and RasV12;scrib-/-(y-axis). 11516 peaks (red) are called significantly different
(padj<0.01) by DESeq2 using the batch effect (seeMaterials and Methods). (H) Gene Set Enrichment Analysis plots showing a strong correlation between
genes [69] up regulated in RasV12;scrib-/-tumors and the opening of nearby regulatory regions (top) and vice versa (bottom). (I) Example of a gradually
opening regulatory region in an intron of p53, a known tumor suppressor gene with significantly increased expression in these tumors (logFC = 0.73, padj<0.0017).
seq) and thousands of significantly decreased peaks (4984 for ATAC-seq). Notably, the dynam-ic range of ATAC-seq seems to be greater than that of FAIRE-seq, as ATAC can detect both smaller and greater significant differences between normal and tumor states than FAIRE (Fig. 4F). Interestingly, when we apply a statistical model allowing for the analysis of both ATAC-seq and FAIRE-seq signals together, the total amount of significantly opening and
clos-ing peaks increases to 11516 (Fig. 4Gand Materials and Methods); these differential peaks
have slightly different genomic distributions, although at present it is unclear which
mecha-nism could be causing this (S5 Fig.).
Since a database with regulatory regions specific for these tumors does not exist, we needed an alternative approach to test whether our candidate regulatory regions are indeed functional regions affecting gene expression of their candidate target genes. To investigate this, we ranked all our regions according to their fold-change between wild type and tumor tissue, and linked
them to their candidate target genes based on their location in the genome (seeMaterials and
Methods). Using publicly available gene expression data obtained under the same conditions
as ours (GEO accession: GSE42938) [30] we examined the enrichment of the differentially
ex-pressed genes in the RasV12;scrib-/-tumors relative to this ranked region-gene list. The
enrich-ment plots inFig. 4H(by Gene Set Enrichment Analysis, seeMaterials and Methods) show
that the up-regulated genes strongly correlate (p-value<10–7, and Normalized Enrichment
Score (NES) = 2.4) with the differentially opening regions, while genes down-regulated in the
tumor strongly correlate (p-value<10–7, NES = -2.4) with the genomic regions showing a
de-crease in open chromatin (differential gene-region pairs are available inS1–S2Tables). The
correlation still holds when we stratify our putative regulatory regions in two groups based on their distance from a TSS (proximal versus distal) or when we assign an alternative way to
as-sign peaks to genes (S6 Fig.). This indicates that the differentially opening/closing chromatin
regions in the tumor tissue are overall functional and play a role in the perturbation of the tran-scriptome. An example of a tumor-specific regulatory region is a previously unknown putative enhancer within an intron of p53 for which the strongly increased chromatin opening likely
points to the underlying activation of p53 in the tumor cells (Fig. 4I).
Next, we wanted to test whether the newly opened chromatin during tumor formation cor-responds to functional regulatory regions that have an endogenous role in other tissues during development. To this end we took the 4111 differential peaks whose normalized number of reads was at least two fold increased in the tumor samples when compared to the wild type control, and clustered these peaks into 3778 unique candidate regulatory regions that gain
ac-tivity in the tumor (seeMaterials and Methods). We compared this set of differentially active
regions against the entire collection of REDFly, FlyLight, and VDRC enhancer resources, cov-ering a total of more than 16000 enhancers with at least one tissue of activity. The most
signifi-cant overlap was found with sets of enhancers known to be active in the“leading edge of
invading tissue”, and with“epidermis”and“midgut primordium”(S3 Table). These
relation-ships may indicate re-activation of endogenous invasive processes. Activated regulatory regions also overlap with genitalia enhancers, which may indicate a re-activation of germline
expres-sion typical for pluripotent stem cells, corresponding to previous studies [31]. An example of
such a gene isfruitless(fru), for which our data pinpoints a previously described genitalia
en-hancer [21] that may underlie the observed over-expression offruduring the oncogenic
pro-cess in the RasV12;scrib-/-cancer model, and in another cancer model in the Drosophila brain
[31] (S7 Fig.).
In conclusion, profound changes in the open chromatin landscape can be identified between
wild type tissue and RasV12;scrib-/-tumor tissue using ATAC-seq and FAIRE-seq. In the
Motif inference on the opening regulatory regions predicts AP-1 and
Stat92E as key regulators
Having identified the exact locations of activity gaining regulatory regions in the tumors
down-stream of oncogenic RasV12;scrib-/-provides us with a high-quality set of sequences that are
likely regulated/bound by a shared set of transcription factors. To predict which transcription factors might be binding to these activity gaining tumor-induced regulatory regions, we used a
recently developed motif discovery method, known as i-cisTarget [32]. From a total of 9713
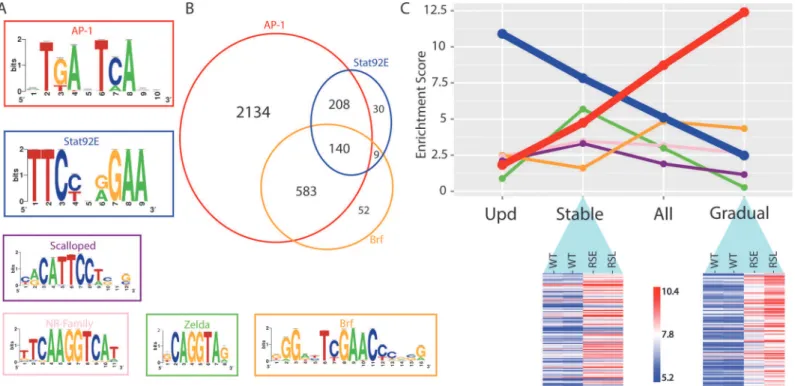
candidate TF motifs (as position weight matrices (PWM)), i-cisTarget yielded the AP-1 and Stat92E motifs as the two most enriched, AP-1 is ranked 1st with a normalized enrichment score (NES) of 8.73 and Stat92E is ranked 2nd with a NES of 5.1. In the active, but unchanging, regulatory regions the Stat92E motif is not enriched and there is only a minor enrichment for the AP-1 motif (NES = 2.7), indicating that the enrichment is specifically in the activity gaining
regulatory regions. (seeMaterials and Methodsfor an explanation of the NES score).
Remark-ably, of the tumor-induced regulatory regions, AP-1 is predicted to target the majority (3065 of the 3778, or 81%), pointing to its driving role in oncogenesis. The AP-1 complex is a homo- or heterodimer of bZIP proteins such as Jun and Fos, binds to highly similar DNA motifs, and is functionally activated downstream of phosphorylated Jun Kinases (JNK). Interestingly, multi-ple labs have shown the importance of JNK signaling, and of the AP-1 commulti-plex, specifically to
the development of RasV12;scrib-/-tumors. Particularly, either suppressing JNK signaling or
knocking-down the AP-1 complex, is sufficient to block tumor development [14,29,33,34]. The
Stat92E motif is enriched in a smaller part of the regulatory regions and shows a significant
overlap with the predicted AP-1 responsive regions (Fig. 5A, B). This is consistent with reports
that show that these pathways can have synergistic effects on RasV12;scrib-/-tumorigenesis
[16].
Besides AP-1 and Stat92E, a few additional motifs for other TFs are also significantly
en-riched, although with a lower representation (Fig. 5A). One of them is the Scalloped (Sd) motif,
a transcription factor that acts together with its coactivator Yorkie (Yki) to promote tissue
overgrowth, as effectors of the Hippo signaling pathway [35]. It has been shown that
knock-down of either Scalloped or Yorkie can rescuescrib-/-mutant tissue overgrowth and reduces
RasV12;scrib-/-tumor size [36]. Another group are the zinc-finger protein motifs of Zelda (Vfl)
that are known for their activating roles in earlyDrosophiladevelopment [37], and for which a
role during oncogenesis has not been described. Note that not all enriched motifs are
necessari-ly involved in the regulatory oncogenic program, and some can be“bystander”motifs for the
key regulators. An example of such a bystander motif could be the Zelda motif, which often co-occurs with Stat92E motifs in the same regulatory region because these two TFs cooperate
dur-ing early embryonic development [38], but in the eye tumor thezeldagene is not
mis-regulat-ed, while all 3 the ligands of the JAK/STAT signaling pathway are (S1 Table). Finally, we
recovered several nuclear receptor motifs (e.g., Ftz-f1 and Hr39) and motifs of the TFIIB-relat-ed factor (Brf), which increases RNA polymerase III-mTFIIB-relat-ediatTFIIB-relat-ed transcription, and its
overex-pression has been linked to several human cancer types [39]. Interestingly, this set of candidate
Brf-regulated tRNA genes could be discovered by open chromatin profiling, but not by micro-arrays or mRNA-seq, showing another advantage, and complementarity, of using chromatin profiling besides classical gene expression profiling.
versus early tumors, and early tumors versus late tumors, we found that the majority of changes are gradual, showing an increase in the height of the open chromatin peak between wild type and early tumor, and a further increase between the early and the late tumor. Such a gradual in-crease of the peak height on a regulatory region most likely indicates that this region is becom-ing accessible in a higher fraction of cells in the dissected tumor tissue, which is likely the consequence of a lower percentage of normal cells in the late tumor tissue. On the other hand, we found a subset of regulatory regions that are more open in the early tumor versus wild type,
but do not show an increasing signal in the late tumor (determined by Fisher’s omnibus, see
Materials and Methods). Interestingly, the motif enrichment scores for AP-1 and Stat92E are very different between the gradually and stably opening regulatory regions. More specifically, the stably open regions are mainly enriched for Stat92E (ranked 1st, NES = 7.83), while the en-richment for AP-1 motifs is reduced (ranked 3rd, NES = 4.74). On the other hand, the gradual-ly open regions are stronggradual-ly enriched for AP-1 motifs (ranked 1st, NES = 12.4), while the
Stat92E motif is no longer enriched in this set (NES<2.5) (Fig. 5C). This finding may indicate
that, either Stat92E targets are activated earlier than AP-1 targets, or that a relatively small pro-portion of cells in the invasive tumor retain Stat92E activity. It could also indicate that Stat92E is active in both tumor and non-tumor cells, and that the secretion of Unpaired ligands from the tumor cells can cause non-autonomous activation of the JAK/STAT pathway in
surround-ing non-tumor tissue [40].
In conclusion, motif inference on differentially open chromatin peaks during tumor develop-ment provides valuable hypotheses about the identity of the transcription factors that are driving the oncogenic regulatory program. Our data confirms previous observations of an important role Fig 5. Regulator detection by motif inference.(A) Motifs enriched in the activity-gaining enhancers for the transcription factors AP-1, Stat92E, Scalloped, nuclear receptor family, Zelda and Brf. (B) Venn diagram of the tumor-specific enhancers that are predicted to be responsive to AP-1, Stat92E and Brf transcription factors. (C) The motif enrichment score (i-cisTarget) of the six transcription factors plotted for each of the four different enhancer groups; opening after Upd-overexpression (activating Stat92E), Stably opening enhancers, All opening enhancers and Gradually opening enhancers in RasV12;
Scrib-/-tumors. The heatmaps are representing a subset of the regions that are classified as stably or gradually opening. A variance stabilizing transformation
(DESeq2) was performed on the count data, blue indicates low and red indicates high peak intensity.
for AP-1 and Stat92E downstream of RasV12;scrib-/-induced oncogenesis, and now suggests that these two regulators can explain a very large fraction of the changing chromatin landscape.
Stat92E plays a key role in the oncogenic process
One of the predicted transcription factors involved in changing the open chromatin landscape
in the tumors is Stat92E, the effector of the JAK/STAT signaling pathway [41]. All three the
li-gands of this pathway are present in our list of significantly up-regulated gene-peak pairs (S1
Table), strongly supporting the predicted role of JAK/STAT signaling in the tumor. Indeed, previous reports have shown that blocking the activity of the JAK/STAT pathway, for example by using a dominant negative form of the receptor Domeless, reduced the tumor phenotype
[16]. However, the direct involvement of Stat92E in this process has not been explicitly tested.
We therefore incorporated a null mutation ofStat92Ein the RasV12;scrib-/-tumors (Stat92E
[85c9], seeMaterials and Methods) to determine if Stat activity is required for the tumor
phe-notype. We observed that tumor growth was severely reduced (Fig. 6A-C). In addition, in the
Stat92E loss-of-function, a fraction of larvae with reduced tumors now also reach pupation
stages, which is not observed in RasV12;scrib-/-larvae.
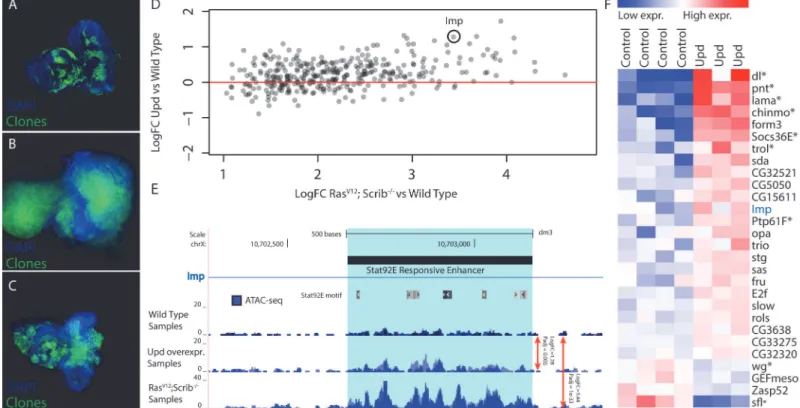
Based on our motif predictions (see above), Stat92E may activate more than three hundred regulatory regions and thereby play a role in regulating the nearby target genes, downstream of RasV12;scrib-/-during oncogenesis. If these promoters and putative enhancers depend on Fig 6. Validation of Stat92E as a key regulator during RasV12;scrib-/-oncogenesis.(A-C) Confocal images of eye-antennal imaginal discs, clones are
indicated in green and DAPI in blue. (A) Wild type disc from a 5 day old larva with MARCM clones expressing GFP (B) An eye-antennal tumor taken from an 8 day old larva with the RasV12;scrib-/-clones. (C) An eye-antennal disc from an 8 day old larva with the RasV12; Stat92E85c9,scrib-/-clones, showing partial
rescue of the tumor phenotype. (D) Opening of predicted Stat92E enhancers from RasV12; scrib-/-tumors vs wild type (x-axis), compared to the opening of
these enhancers when ectopically activating the JAK/STAT signaling pathway vs wild type (y-axis). (E) Predicted Stat92E enhancer region inside an intron of
Imp, the enhancer is significantly more active in the Upd eye discs compared to wild type (logFC 1.28 padj 0.005) and even more so in the RasV12;scrib
-/-tumors compared to wild type (logFC 3.44 padj 1e-33). (F) Heatmap showing the expression level of 28 genes [42] that have at least one activated enhancer predicted to be Stat92E responsive (Fig. 6A).
Stat92E for their opening, the same regions may be activated and opened by Stat92E alone,
in-dependently of the RasV12;scrib-/-induced oncogenesis. To test this we hyper-activated the
JAK/STAT pathway in the wild type eye disc, and thereby the downstream Stat92E activity, by overexpressing one of the ligands that is up-regulated in the tumor, namely Unpaired (Upd,
encoded byos). ATAC-seq on these discs could demonstrate that the tumor-induced changes
at Stat92E predicted target sites are recapitulated by JAK/STAT activation alone. The changes
are significant and mainly in the same direction (Fig. 6D), but as expected the changes in open
chromatin caused by the Upd overexpression are quantitatively more subtle compared to those
in the tumors. For example, an intronic regulatory region ofImpshows activated chromatin by
Stat92E (log2 fold change = 1.23) but this activation is stronger during RasV12;scrib-/-tumor
formation (log2 fold change = 3.44) (Fig. 6E).
In the RasV12;scrib-/-tumors we had identified 356 candidate target regulatory regions of
Stat92E, of these we found that 72% have a positive fold change in the Upd over-expressing discs (Fig. 6D), indicating that this group is Stat92E responsive (p-value 0.0097). However, this still means that 28% of the candidate regions did not respond to the activation of Stat92E by overex-pressing Upd. We analyzed these responsive and non-responsive regions and found that the AP-1 motif is only enriched in the regions that are not responsive to Stat92E, indicating that for those regions AP-1 might be the main input and the Stat92E motif might be of less importance here.
Next, we asked whether these changes incis-regulatory activity directly affect gene
expres-sion of target genes. To test this, we linked the 254 Stat92E responsive regulatory regions to
nearby (<5kb upstream or intronic) candidate target genes and examined their expression in
Upd over-expressing discs using publicly available gene expression data (GEO accession:
GSE15868) [42]. After applying two filtering steps, requiring the regulatory region to go
signifi-cantly open both in tumor and UPD-overexpressing tissue, combined with a significant differ-ential expression of the assigned gene, we end up with a final list of 28 potdiffer-ential direct Stat92E
target genes (Fig. 6F). Among these are at least seven well-known transcriptional targets of the
JAK/STAT signaling pathway including:dorsal,pointed,lama,chinmoandtrol, as well as two
key negative regulators of this pathway:Socs36EandPtp61F[42–49]. Interestingly, not all
genes that have an opened Stat92E regulatory region are up-regulated. The JAK/STAT pathway can also repress transcription of target genes and is known to block the Wnt/Wingless signaling
pathway in the eye imaginal disc [50]. In our list we recover two genes that are known to be
in-volved in the Wingless signaling pathway,winglessitself andsulfateless, an essential enzyme for
this pathway [51]. This may indicate that Stat92E can function directly in the repression of
genes, through an as yet unidentified mechanism. An interesting future challenge will be to
un-derstand thecis-regulatory mechanisms and possible co-factors that determine the
mecha-nisms by which Stat92E can act as activator or repressor.
In conclusion, we demonstrate that Stat92E is a significant transcriptional regulator and re-quired for the growth of our tumor model. We identify known and newly predicted Stat92E
targets in the tumor and are able to independently recover>70% of those targets using a
Stat92E activation model in the normal eye. This second analysis also illustrates the feasibility of an integrated approach of ATAC-seq and motif discovery to capture and annotate modest, yet functional, changes in the chromatin landscape. We conclude that Stat92E induced chro-matin-opening correlates with a change in the transcription of nearby genes, and that Stat92E may function as a key regulator of the tumor transcriptome.
Discussion
underpinnings of any biological process in vivo. Our study first compares, and subsequently combines, two recent methods for open chromatin profiling to obtain genome-wide regulatory landscapes in the developing Drosophila eye as model system. By applying FAIRE-seq and ATAC-seq to the normal eye-antennal imaginal disc, alongside anti-CTCF ChIP-seq, we found both methods to be highly robust in identifying accessible or open regions, with few differences between strains with different genetic backgrounds. The main advantages of ATAC-seq, for our application, are besides its undemanding experimental procedure, (1) its higher signal-to-noise ratio, with low background signal and sharper peaks; (2) its ability to identify TF foot-prints, as binding sites are protected from transposon insertion, similar to their protection
from DNaseI cleavage [23]; and (3) its ability to determine nucleosome positioning when using
paired-end sequencing.
Although these assets of ATAC-seq may be important for some studies, overall both FAIRE and ATAC allow identification of promoters and candidate enhancers, and here we use them
as independent“replicate”measurements (taking batch effects into account) to examine the
open chromatin status of a tumor model.
We observe that thecis-regulatory landscape of active promoters and enhancers changes
dramatically in RasV12;scrib-/-eye tumors, while more moderate changes were observed in
tis-sues with JAK/STAT induced hyperplasia. A possible explanation for the marked differences in the intensity of change may be found in the cellular composition of the samples. Open chroma-tin signals represent the average signal across all cells within a sample, and since each regulato-ry region, in each cell can yield only two open alleles, this observed activity mainly reflects the number of cells in which the region is active, rather than the quantitative activity of the region.
Once the repertoire of tumor-induced regulatory regions was identified by open chromatin profiling, we reasoned that if many of these functional regions are activated by a small set of master regulators, then the motifs of these TFs should be enriched within the sequences of
these regions. While motif inference ongenesets is challenging due to the large intergenic and
intronic regulatory space around genes, motif inference onenhancer-size regulatory sequences
often gives highly accurate results [32,52–54]. We used the tool i-cisTarget, which is optimized
for Drosophila genomes, and found not only AP-1 and Stat92E, but also Zelda, Scalloped (the Hippo pathway effector), Brf, and Ftz-f1 as candidate regulators of the oncogenic, Ras-depen-dent program. All of these TFs (except perhaps Zelda) can be directly linked to cancer-related
processes that are conserved to human [35,39], and AP-1, Stat, and Scalloped have each been
previously linked to the RasV12;scrib-/-program specifically [16,29,36,55,56]. We could
con-firm that the RasV12;scrib-/-tumor phenotype depends on Stat92E, and furthermore reveal that
JAK/STAT signaling causes specific chromatin changes at Stat92E-responsive regulatory regions.
Finally, once the regulatory regions and their candidate regulators are identified, an impor-tant next step is to examine which target genes are now differently regulated, as a consequence of the activation of these promoters and enhancers. Previous work has found that open
chro-matin peaks obtained across cell lines are correlated with gene expression changes of“nearby”
target genes [4]. We also found evidence that a high degree of chromatin changes are
concor-dant with transcriptional changes of nearby target genes, both in the tumor and in the over-grown tissue with hyper-activated JAK/STAT, confirming that the chromatin state of these
regions is not only altered, but that they are alsofunctionallyactivated. Interestingly, not all
pu-tative target genes with an increased open chromatin peak are up-regulated, but a small subset
is also down-regulated, which indicates that regulatory regions can be“activated”by TF
Overall, our integrated approach reveals a largecistromeof changing activity at promoters and enhancers during tumor development, which is mainly operated by AP-1 and Stat92E; and illustrates how integrative open chromatin profiling, motif detection, and gene expression anal-yses have great potential to unravel tissue and cell type specific regulatory programs in vivo, in health and disease.
Materials and Methods
Fly stocks
The following fly stocks were used during this investigation: y,w,eyFlp; act>y+>Gal4,
UAS-GFP; FRT82 tub Gal80 and y,w; UAS-RasV12; FRT82 scrib2, e/ TM6B, yw; UAS-Rasv12; FRT82
Stat92E85c9, scrib2, e/ FRT82 tub-Gal80, Optix-GFP [57] and UAS-GFP:Upd (Courtesy of
Fer-nando Casares), GMR-Gal4, isogenic wild type DGRP-208 (Bloomington stock 25174), y, w; FRT82 and CantonS wild types. Crosses were raised at 25°C on a yeast based medium.
Dissections
Wild type, RasV12;scrib-/-early and Upd overexpression eye-antennal discs were dissected
from wandering third instar larvae (day 6) in 1xPBS. RasV12;scrib-/-late discs were collected
three days after larvae began wandering (day 9); this is possible because RasV12;scrib-/-do
not pupate, but can persist more than one week in a prolonged larval stage.
Immunohis-tochemistry was performed as previously described in [58]. Confocal images were taken on an
Olympus FV1000 or FV1200 microscope. Images were processed using ImageJ and Adobe Photoshop software.
ATAC-seq
The previously described ATAC-seq protocol was adapted for working with Drosophila rather
than human cells [10]. Ten eye antennal imaginal discs (or three RasV12;scrib-/-late total
tu-mors) were immediately placed in 50μl ice cold ATAC lysis buffer (10 mM Tris-HCl, pH 7.4,
10mM NaCl, 3mM MgCl2, 0.1% IGEPAL CA-630). Lysed discs were then centrifuged at 800 xg
for 10 minutes at 4’C and the supernatant was discarded. The rest of the ATAC-seq protocol
was performed as described previously [10] using the following primers: Fwd:-‘AATGATAC
GGCGACCACCGAGATCTA CACTCGTCGGCAGCGTCAGATGTG’and Rev:-‘CAAGC
AGAAGACGGCATACGAGATXXX XXXGTCTCGTGGGCTCGGAGATGT’(where X
indi-cates barcode nucleotides). The final library was purified using a Qiagen MinElute kit (Qiagen) and Ampure XP beads (Ampure) (1:1.2 ratio) were used to remove remaining adapters. The final library was first checked on an Agilent Bioanalyzer 2000 for the average fragment size. Re-sulting successful libraries were sequenced with 50bp, single end reads on the Illumina HiSeq 2000 platform. Single end sequencing was chosen for this study because we were not interested in the fragment contents (i.e., how many nucleosomes are placed between two insertion sites), rather just the profile of insertion sites, which also made comparisons with pre-existing FAIRE-seq data easier.
FAIRE-seq
Methodology adapted from [12]. In short, 150 head complexes were dissected from wandering
third instar larvae, these were fixed for 10 min with 4% formaldehyde,. The formaldehyde was
then replaced with 750μl quenching buffer (125 mM Glycine 0.01% Triton X-100 in PBS) was
X-100, 1mM PMSF) and 200 eye-antennal discs were then dissected in buffer A and kept on
ice, these were centrifuged at 6000rpm, 4’C to pellet the discs and lysed in lysis buffer 1 (50mM
HEPES-KOH, pH 7.5, 140mM NaCl, 1mM EDTA, 10% glycerol, 0.5% NP-40, 0.25% Triton
X-100) rocking at 4’C for 10 minutes, centrifuged and the supernatant removed. Next lysis buffer
2 (10mM Tris-HCl, pH 8.0, 200 mM NaCl, 1mM EDTA, 0.5 mM. EGTA) was added and the sample was rocked at room temperature for 10 minutes. Finally lysis buffer 3 (10 mM Tris-HCL, pH 8.0, 100mM NaCl, 1mM EDTA, 0.5mM EGTA, 0.1% Na-deoxycholate, 0.5%
N-laur-oylsarcosine) was added and samples were sonicated (Bioruptor UCD-200 (Diagenode) at 4’C,
8 Cycles set to pulse high 30 seconds, rest 30 seconds) immediately.
Double phenol/chloroform extraction was performed with a final chloroform extraction. DNA was precipitated using Sodium acetate (0.3 M, pH 5.2), 20mg Glycogen and 100%
etha-nol. DNA was washed with 500μl ice cold 70% Ethanol. Supernatant was removed and the
pel-let air-dried. The dried pelpel-let was re-suspended in 50μl TE buffer (10 mM Tris pH 8.0, 1 mM
EDTA in MilliQ water) and incubated at 65’C overnight to reverse crosslinks. Finally 1μl
10mg/ml RNAseA was added and incubated at 37’C for 1 hour, samples were cleaned using the
QiaQuick MinElute kit (Qiagen) and DNA was measure using a Qubit analyzer. Final libraries were prepared as per standard Illumina protocols.
ChIP-seq
Head complexes were dissected from wandering third instar larvae (500, in batches of 100) and fixed in 1ml crosslinking solution (1.8% formaldehyde, 50 mM HEPES pH 7.9, 1 mM EDTA, 0.5 mM EGTA, 100 mM NaCl in MilliQ water) for 25 minutes at room temperature while ro-tating. Crosslinking solution was replaced 5 times after 5 minutes each time. Crosslinking was stopped by adding 1ml stop solution (0.01% Triton X-100, 125 mM Glycine in PBS) and incu-bating at room temperature for 10 minutes while rotating, this was repeated for 3 more washes. Complexes were washed in 1 ml wash A (10 mM HEPES pH7.9, 10 mM EDTA, 0.5 mM EGTA, 0.25% Triton-X100 in MilliQ water) for 10 minutes at room temperature while rotat-ing. Complexes were washed in 1 ml wash B (10 mM HEPES pH7.9, 200 mM NaCl, 1 mM EDTA, 0.5 mM EGTA, 0.01% Triton X-100 in MilliQ water) for 10 minutes at room tempera-ture while rotating, this was repeated 3 more times. Eye-antennal discs (200) were dissected
from head complexes in wash B and collected in a tube containing 100μl sonication buffer (10
mM HEPES pH7.9, 1mM EDTA, 0.5 mM EGTA in MilliQ water), samples were sonicated
(Bioruptor UCD-200 at 4’C, 8 Cycles set to pulse high 30 seconds, rest 30 seconds)
immediate-ly. Samples were centrifuged at 21000 xg for 10 minutes at 4’C. For each immunoprecipitation,
the pellet from 100μl extract was re-suspended in 1 ml RIPA buffer (140 mM NaCl, 10 mM
Tris-HCl pH8.0, 1 mM EDTA, 1% Triton X-100, 0.1% SDS, 0.1% Na-deoxychoate, 1% PMSF
in MilliQ water), an extra sample (10μl) was kept aside as input.
Immunoprecipitation was performed by adding 20μl protein A/G magnetic beads
(Milli-pore) and incubating for 1 hour at 4’C; samples were centrifuged at 3000 rpm for 2 minutes
and supernatant kept. Anti-CTCF antibody (10μl crude rabbit serum—A kind gift from Dr.
Ranier Renkawitz) was added to the supernatant and rotated at 4’C overnight.
Immunocom-plexes were recovered by adding 20μl protein A/G magnetic beads to sample and incubating at
4’C for 3 hours while rotating. Magnetic beads were separated using a magnetic stand and
su-pernatant discarded. Beads were re-suspended and washed for 5 minutes on a rotating plat-form, with 1 ml of the following buffers in order:- Low salt immune complex wash buffer (Millipore), High salt immune complex wash buffer(Millipore), LiCl immune complex wash
buffer (Millipore), TE buffer. ChIP elution buffer (Millipore) was warmed to 38’C and 100μl
minutes, shaking at 950rpm. Both immunoprecipitated and control samples had 1ul proteinase
K added and were incubated at 62’C for 2 hours, shaking at 950rpm and then 95’C for 10
min-utes. Samples were allowed to cool to room temperature and beads were separated with a mag-netic stand. Final DNA was purified according to the manufacturers guidelines (MagnaChIP, Millipore) Final libraries were prepared as per standard Illumina protocols.
ATAC-seq, FAIRE-seq, and DNaseI-seq data analysis
Raw reads were first cleaned for adapter sequences usingfastq-mcfusing default parameters
and an adapter file containing common Illumina adapter sequences. Cleaned samples were
mapped to the Drosophila melanogaster FlyBase release r5.53 genome [59] usingbowtie2[60]
(default parameters) and reads with a mapping quality of less than 4 were discarded. In several
samples we discovered reads mapping to the Wolbachia genome (60–80%), these were also
dis-carded. Both ATAC-seq and DNaseI-seq reads (publicly available data) were adjusted to better represent the open chromatin by centering reads on the cut-sites and extending this by 5bp on
either side, samples were finally sorted and indexed using Samtools [61]. Peaks were called on
ATAC-seq, FAIRE-seq and DNaseI-seq samples using the MACS2 software suite [62] with the
added parameters“-g dm–nomodel–shiftsize 50–q 0.01”. For comparison between samples,
all peaks from each sample were merged to provide one set of combined peaks. Peaks on
ChIP-seq data were called also using the MACS2 software suite with the parameters“-g dm–q 0.01”
also using input as a control. For quantification of peaks, bed files of combined peaks were con-verted into a GFF3 format and then the number of reads per peak, per sample were counted
using htseq-count [63].
Finally bigWig files were created from bam files for each sample using genomeCoverageBed
[64] (using the–scale option) and bedGraphToBigWig [65]. Scales were determined by the
‘sizeFactors()’command from DESeq2 [66] on a matrix of all samples, counted on all
com-bined peaks. Genomic locations of peaks was determined by the CEAS software package using
default parameters and a prebuilt dm3 gene annotation file [67]. For the CTCF protection
anal-ysis motif scanning was performed with Cluster Buster to find occurrences of the
JASPAR-MA0139.1 motif in CTCF peaks using the parameters‘-m7–c0’, each peak was then
re-cen-tered on the center of the best scoring motif present. The cut sites from each read was deter-mined and plotted 500bp around the re-centered CTCF peaks. Signal from the same motif at random regions of DNA was subtracted to remove background noise.
To determine overlaps between peaks, the tool intersectBed was used, with all CTCF peaks or high confidence regions as file A and the ATAC-seq/FAIRE-seq peaks as file B, the option
‘-f 0.4’was also used to enforce a 40% overlap of the CTCF peak by the
ATAC-seq/FAIRE-seq peak.
To identify differential peaks between conditions we used DESeq2 [66] with a p-adjusted
cutoff of 0.01. This cutoff was supported by the leading edge of a Gene Set Enrichment Analysis
(GSEA [68]) analysis whereby all genes ranked by their most significant peak (tumor vs wild
type) are compared to a Ras/Scrib gene signature. To link peaks to genes we assigned a peak within any intron or in the 5kb upstream region of the TSS to the gene. To rank genes accord-ing to peak heights (for GSEA analysis) we used the peak with the most significant adjusted p-value. When FAIRE-seq and ATAC-seq are used as replicates, we took batch effects into ac-count in DESeq2.
Rankings for the recovery curves seen inS2 Fig.were generated by scoring peaks
Publicly available microarray data
We acquired two Affymetrix Drosophila Genome 2.0 Array data sets from GEO [30], one
com-prised of 3 wild type and 3 RasV12;scrib-/-biological replicates (GEO accession: GSE42938)
[69], and the second comprised of 5 wild type and 5 Upd overexpression biological replicates
(GEO accession: GSE15868) [42]. We discarded three low-quality samples from our analyses
(GSM398336, GSM398339, GSM398341). Differential expression analysis was carried out in R using the Bioconductor packages affy, limma, Biobase and GEOquery, applying a standard
limma protocol [70]. After obtaining differential values we associated each probe to their
re-spective gene; for genes with more than one associated probe, we decided to use the probe with the most significant adjusted p-value.
Gene set enrichment analysis
The differential peaks (wild type control vs RasV12;scrib-/-tumors) were assigned to genes
(<5kb upstream or intronic) and for each gene the most significantly differential peak was
kept. The genes were ordered based on the relative openness of their assigned peak (opening on top and closing on bottom), to obtain the ranked gene list (x-axis of GSEA plots).
Two groups of differentially expressed genes were determined based on the publically avail-able micro array data (GEO accession: GSE42938). One group contained the significantly upre-gulated and the other the significantly downreupre-gulated genes in the tumors. We used GSEA (with 100000 perturbations) to determine if these groups of differentially regulated genes were significant enriched on either side of the ranked gene list.
Grouping regulatory regions
The globally opening regions in the RasV12;scrib-/-tumors were determined by differential
peak calling between all 5 wild type controls and all 4 RasV12;scrib-/-samples (combining early
and late). Of the significantly differential peaks, only those with a logFC greater than 1 were se-lected, ending up with 4111 globally opening regions.
To determine the early versus late RasV12;scrib-/-regulatory regions, differential peaks were
called between the 5 wild type controls and the 2 RasV12;scrib-/-early samples and between the
2 RasV12;scrib-/-early samples and the 2 RasV12;scrib-/-late samples. We selected a subset of
regulatory regions that were opening from WT to RSE (with a logFC>1) and that remained at
similar levels between RSE and RSL (-0.2<logFC<0.2); we defined these regulatory regions
as‘stably opening’. For the regulatory regions defined as‘gradually opening’, we selected the
re-gions that are becoming more open between WT and RSE (logFC>0) and that further open
between RSE and RSL (logFC>0.5). Using a Fisher's Omnibus test we combined the p-values
for each regulatory region (one from WT vs RSE and one from RSE vs RSL) and obtain a new chi-squared p-value.
The regulatory regions opening in Upd-overexpression were determined by differential peak calling between the 3 ATAC-seq wild type controls and the 2 ATAC-seq Upd-overexpres-sing samples. We took the top 250 opening regions (ordered on Upd-overexpres-singed P Value) to perform motif enrichment analysis.
Motif enrichment and normalized enrichment scores
For motif enrichment we used i-cisTarget [32], a tool developed in our lab to discover motifs
significantly enriched in our four regulatory region groups (the stably, globally and gradually
opening in RasV12;scrib-/-and opening in Upd-overexpression). We ran i-cisTarget via the
collection of 9713 motifs. The enrichment of each motif in the input set is calculated as an area under the recovery curve (AUC), whereby recovery is observed over a genome-wide ranking of
136K a priori defined candidate regulatory regions [32]. The AUC score is normalized by
sub-tracting the mean of all AUCs over all motifs, and dividing it by the standard deviation, to
ob-tain a Normalized Enrichment Score (NES). We use a cutoff of NES>2.5 to select
significantly enriched motifs. Relationships between NES and False Discovery Rates can be
found in [71]. For each factor of interest with multiple enriched motifs, we selected the motif
with the highest NES score.
Accession numbers
ATAC-seq, ChIP-seq and FAIRE-seq data for all conditions are available in GEO (http://www.
ncbi.nlm.nih.gov/geo/), with accession number GSE59078.
Data access
Genome browser tracks for all data, and called peaks for wild type and cancer-related regulato-ry regions are all available within a UCSC Genome Browser hub from this URL:
http://genome.ucsc.edu/cgi-bin/hgTracks?db=dm3&hubUrl=http://ucsctracks.aertslab.org/ ATAC-paper/hub.txt
Supporting Information
S1 Fig. Wild type peak locations.Genomic locations of peaks identified in the wild type sam-ples for both ATAC-seq and FAIRE-seq. Both techniques are clearly enriched for promoter re-gions and depleted for exonic rere-gions, a pattern expected for regulatory elements.
(TIF)
S2 Fig. Recovery curves of curated enhancers.Recovery curves which show how well both ATAC-seq and FAIRE-seq recover overlapping enhancer between their peaks and two sets of curated enhancers (FlyLight eye and REDFly eye) in comparison to all other enhancer groups from FlyLight (Janelia farm), REDFly and VDRC. ATAC-seq shows clear enrichment over all other enhancer groups whilst FAIRE-seq seems to only be slightly enriched for REDFly eye enhancers.
(TIF)
S3 Fig. Low read depth paired-end ATAC-seq profiles.ATAC-seq data (Blue) from two sam-ples sequenced paired end on an Illumina MiSeq with a low amount of reads, in comparison to our previous FAIRE-seq (Red) data. The wild type sample (Top) was infected with Wolbachia
and had only*500k reads and the RasV12;scrib-/-sample (Track #3) had*1.4 million read.
Each FAIRE-seq sample has*10 million reads.
(TIF)
S4 Fig. Single- and Paired-end sequencing comparison.ATAC-seq data from both
single-end (tracks 1 and 3) and paired-single-end (tracks 2 and 4) of Wild type and RasV12;scrib-/-samples.
Each of the sequencing types shows near identical profiles, with the difference most likely
at-tributable to the difference in sequencing depth (*1 million reads per paired end sample and
10 million per single end sample). (TIF)
show a stronger enrichment in the distal intergenic regions. (TIF)
S6 Fig. GSEA analysis of putative promoter and enhancer regions and of alternative peak to gene assignment.GSEA analysis with the same up- and down regulated gene sets of the
RS-tumor as inFig. 4H. The differential peaks are now separated according to their distance to the
closest Transcription Start Site and based on this separation a new ranked gene list was created (seeMaterials and Methods). (A) Ranking based on promoter proximal peaks within 500bp of TSS and (B) based on the promoter distal peaks outside this 500bp. (C) Ranking based on pro-moter proximal peaks within 1kb of TSS and (D) based on the propro-moter distal peaks outside this 1kb. (E) The peak to gene assignment is now purely based on their nearest TSS, this way all peaks are assigned to a gene and for each gene the most significant differential peak is retained to create the ranked gene list.
(TIF)
S7 Fig. An enhancer identified in thefruitlessgene.Regulatory region inside an intron of fruitlessoverlapping with a previously described Janelia genital enhancer (R22G01). The en-hancer gains activity in the RS-tumor (4 times more reads) and may underlie the increased
transcription of thefruitlessgene.
(TIF)
S1 Table. Genes with their assigned Regulatory Region, both going UP in RS-tumors com-pared to wild type.
(DOCX)
S2 Table. Genes with their assigned Regulatory Region, both going DOWN in RS-tumors compared to wild type.
(DOCX)
S3 Table. Enhancer sets enriched in opening or closing ranked lists of differential regulato-ry regions from RS-tumors.
(DOCX)
Acknowledgments
We would like to thank Prof. William Greenleaf and Jason Buenrostro (Department of Genet-ics, Stanford University School of Medicine, Stanford, California, USA) for providing us with an in-depth ATAC-seq protocol; and Daniel McKay and Jason Lieb for the detailed FAIRE-seq protocol.
Author Contributions
Conceived and designed the experiments: KD JJ DP GH SA. Performed the experiments: KD JJ MA VC. Analyzed the data: KD JJ DP. Contributed reagents/materials/analysis tools: MA GH SA. Wrote the paper: KD JJ MA SA.
References
1. Thurman RE, Rynes E, Humbert R, Vierstra J, Maurano MT, et al. (2012) The accessible chromatin landscape of the human genome. Nature 489: 75–82. doi:10.1038/nature11232PMID:22955617
2. Dunham I, Kundaje A, Aldred SF, Collins PJ, Davis CA, et al. (2012) An integrated encyclopedia of DNA elements in the human genome. Nature 489: 57–74. doi:10.1038/nature11247PMID:22955616
4. Andersson R, Gebhard C, Miguel-Escalada I, Hoof I, Bornholdt J, et al. (2014) An atlas of active en-hancers across human cell types and tissues. Nature 507: 455–461. doi:10.1038/nature12787PMID:
24670763
5. Ernst J, Kellis M (2010) Discovery and characterization of chromatin states for systematic annotation of the human genome. Nat Biotechnol 28: 817–825. doi:10.1038/nbt.1662PMID:20657582
6. Bernstein BE, Stamatoyannopoulos JA, Costello JF, Ren B, Milosavljevic A, et al. (2010) The NIH Roadmap Epigenomics Mapping Consortium. Nat Biotechnol 28: 1045–1048. doi: 10.1038/nbt1010-1045PMID:20944595
7. Stergachis AB, Neph S, Reynolds A, Humbert R, Miller B, et al. (2013) Developmental fate and cellular maturity encoded in human regulatory DNA landscapes. Cell 154: 888–903. doi:10.1016/j.cell.2013. 07.020PMID:23953118
8. Thomas S, Li X-Y, Sabo PJ, Sandstrom R, Thurman RE, et al. (2011) Dynamic reprogramming of chro-matin accessibility during Drosophila embryo development. Genome Biol 12: R43. doi: 10.1186/gb-2011-12-5-r43PMID:21569360
9. Giresi PG, Kim J, McDaniell RM, Iyer VR, Lieb JD (2007) FAIRE (Formaldehyde-Assisted Isolation of Regulatory Elements) isolates active regulatory elements from human chromatin. Genome Res 17: 877–885. PMID:17179217
10. Buenrostro JD, Giresi PG, Zaba LC, Chang HY, Greenleaf WJ (2013) Transposition of native chromatin for fast and sensitive epigenomic profiling of open chromatin, DNA-binding proteins and nucleosome position. Nat Methods 10: 1213–1218. doi:10.1038/nmeth.2688PMID:24097267
11. Song L, Zhang Z, Grasfeder LL, Boyle AP, Giresi PG, et al. (2011) Open chromatin defined by DNaseI and FAIRE identifies regulatory elements that shape cell-type identity. Genome Res 21: 1757–1767. doi:10.1101/gr.121541.111PMID:21750106
12. McKay DJ, Lieb JD (2013) A Common Set of DNA Regulatory Elements Shapes Drosophila Append-ages. Dev Cell 27: 306–318. doi:10.1016/j.devcel.2013.10.009PMID:24229644
13. Adey A, Morrison HG, Asan, Xun X, Kitzman JO, et al. (2010) Rapid, low-input, low-bias construction of shotgun fragment libraries by high-density in vitro transposition. Genome Biol 11: R119. doi:10.1186/ gb-2010-11-12-r119PMID:21143862
14. Brumby AM, Richardson HE (2003) scribble mutants cooperate with oncogenic Ras or Notch to cause neoplastic overgrowth in Drosophila. EMBO J 22: 5769–5779. PMID:14592975
15. Gonzalez C (2013) Drosophila melanogaster: a model and a tool to investigate malignancy and identify new therapeutics. Nat Rev Cancer 13: 172–183. doi:10.1038/nrc3461PMID:23388617
16. Wu M, Pastor-Pareja JC, Xu T (2010) Interaction between RasV12 and scribbled clones induces tu-mour growth and invasion. Nature 463: 545–548. doi:10.1038/nature08702PMID:20072127
17. Amore G, Casares F (2010) Size matters: the contribution of cell proliferation to the progression of the specification Drosophila eye gene regulatory network. Dev Biol 344: 569–577. doi:10.1016/j.ydbio. 2010.06.015PMID:20599903
18. Treisman JE (2013) Retinal differentiation in Drosophila. Wiley Interdiscip Rev Dev Biol 2: 545–557. doi:10.1002/wdev.100PMID:24014422
19. Quan X, Ramaekers A, Hassan BA (2012) Transcriptional control of cell fate specification: lessons from the fly retina. Curr Top Dev Biol 98: 259–276. doi:10.1016/B978-0-12-386499-4.00010-0PMID:
22305166
20. Kumar JP (2010) Retinal determination the beginning of eye development. Curr Top Dev Biol 93: 1–28. doi:10.1016/B978-0-12-385044-7.00001-1PMID:20959161
21. Jory A, Estella C, Giorgianni MW, Slattery M, Laverty TR, et al. (2012) A survey of 6,300 genomic frag-ments for cis-regulatory activity in the imaginal discs of Drosophila melanogaster. Cell Rep 2: 1014–
1024. doi:10.1016/j.celrep.2012.09.010PMID:23063361
22. Jenett A, Rubin GM, Ngo T-TB, Shepherd D, Murphy C, et al. (2012) A GAL4-Driver Line Resource for Drosophila Neurobiology. Cell Rep 2: 991–1001. doi:10.1016/j.celrep.2012.09.011PMID:23063364
23. Boyle AP, Song L, Lee B-K, London D, Keefe D, et al. (2011) High-resolution genome-wide in vivo foot-printing of diverse transcription factors in human cells. Genome Res 21: 456–464. doi:10.1101/gr. 112656.110PMID:21106903
24. Buenrostro JD, Giresi PG, Zaba LC, Chang HY, Greenleaf WJ (2013) Transposition of native chromatin for fast and sensitive epigenomic profiling of open chromatin, DNA-binding proteins and nucleosome position. Nat Methods 10: 1213–1218. doi:10.1038/nmeth.2688PMID:24097267