ACPD
8, 15463–15490, 2008Hydration of the lower stratosphere by
ice crystal geysers
S. Khaykin et al.
Title Page
Abstract Introduction
Conclusions References
Tables Figures
◭ ◮
◭ ◮
Back Close
Full Screen / Esc
Printer-friendly Version
Interactive Discussion
Atmos. Chem. Phys. Discuss., 8, 15463–15490, 2008 www.atmos-chem-phys-discuss.net/8/15463/2008/ © Author(s) 2008. This work is distributed under the Creative Commons Attribution 3.0 License.
Atmospheric Chemistry and Physics Discussions
This discussion paper is/has been under review for the journalAtmospheric Chemistry
and Physics (ACP). Please refer to the corresponding final paper inACPif available.
Hydration of the lower stratosphere by ice
crystal geysers over land convective
systems
S. Khaykin1, J.-P. Pommereau2, L. Korshunov1, V. Yushkov1, J. Nielsen3, N. Larsen3, T. Christensen3, A. Garnier2, A. Lukyanov1, and E. Williams4
1
Central Aerological Observatory of Roshydromet 3, Pervomayskaya str. Dolgoprudny, Moscow region, Russian Federation, 141700, Russia
2
Service d’Aeronomie, CNRS, University of Versailles St Quentin, BP 3, Verri `eres le Buisson 91371, France
3
Danish Meteorological Institute, Lyngbyvej 100, 2100 Copenhagen, Denmark 4
Dept. of Civil & Environmental Engineering, Massachusetts Institute of Technology, 77 Massachusetts Ave., Cambridge, MA 02139-4307, USA
Received: 24 June 2008 – Accepted: 18 July 2008 – Published: 14 August 2008
Correspondence to: S. Khaykin ([email protected])
ACPD
8, 15463–15490, 2008Hydration of the lower stratosphere by
ice crystal geysers
S. Khaykin et al.
Title Page
Abstract Introduction
Conclusions References
Tables Figures
◭ ◮
◭ ◮
Back Close
Full Screen / Esc
Printer-friendly Version
Interactive Discussion
Abstract
The possible impact of deep convective overshooting over land has been explored by six simultaneous soundings of water vapour, particles and ozone in the lower strato-sphere next to MesoScale Convective Systems (MCSs) during the monsoon season over West Africa in Niamey, Niger in August 2006. The water vapour measurements
5
were carried out using a fast response FLASH-B Lyman-alpha hygrometer. The high vertical resolution observations of this instrument show the presence of enhanced wa-ter vapour layers between the tropopause at 370 K and the 450 K level. Most of these moist layers are shown connected with overshooting events occurring upwind as iden-tified from satellite IR images, over which the air mass probed by the sondes passed
10
during the three previous days. In the case of a local overshoot identified by echo top turrets up to 18.5 km by the MIT C-band radar also in Niamey, tight coincidence was found between enhanced water vapour, ice crystal and ozone dip layers indicative of fast uplift of tropospheric air across the tropopause. The water vapour mixing ratio in the enriched layers, up to 8 ppmv higher than that of saturation at the tropopause,
15
and the coincidence with the presence of ice crystals strongly suggest hydration of the lower stratosphere by geyser-like injection of ice particles over overshooting turrets. The pile-like structure of the water vapour seen by the high-resolution hygrometer in contrast to smooth profiles reported by a coarse vertical-resolution satellite observa-tion, suggests that the hydration mechanism described above may be responsible for
20
the known summer seasonal increase of moisture in the lower stratosphere. If this interpretation is correct, hydration by ice geysers across the tropopause may be an important contributor to the stratospheric water vapour budget.
1 Introduction
Water vapour is a key player in stratospheric climate and chemistry. It is the most
25
ACPD
8, 15463–15490, 2008Hydration of the lower stratosphere by
ice crystal geysers
S. Khaykin et al.
Title Page
Abstract Introduction
Conclusions References
Tables Figures
◭ ◮
◭ ◮
Back Close
Full Screen / Esc
Printer-friendly Version
Interactive Discussion
upper troposphere (Forster and Shine, 2002), as well as a source of hydroxyl radi-cals and polar stratospheric clouds involved in ozone depletion (Solomon et al., 1986). Its concentration was reported to increase above Northern America by 5–10% per decade at all levels between 15–26 km over the period 1980–2000 (Oltmans et al., 2000; Rosenlof et al., 2001), whilst a cooling of the lower stratosphere of 0.5 K per
5
decade was reported between 1979–2005 (WMO, 2007), now followed by a levelling off
of both parameters since 2001 (Randel et al., 2006). Since troposphere-stratosphere exchange is known to take place primarily in the tropics (Brewer, 1949; Holton et al., 1995), these changes are generally attributed to changes in the vertical transport in the tropical upper troposphere–lower stratosphere (UT–LS). However, the mechanism
10
controlling the amount of water vapour entering the lower stratosphere is still debated. Indeed, whatever is the mechanism of transport invoked – slow radiative ascent, synop-tic uplift, or convective overshooting (e.g. Sherwood and Dessler, 2000, and references herein) the amount of water vapour transported is generally assumed to be limited by the minimum temperature of the tropopause resulting in the dehydration of air entering
15
the lower stratosphere (e.g. WMO, 2007). If this mechanism is correct, the observed cooling of the tropopause by 0.5 K per decade since 1979 (Seidel et al., 2001; WMO, 2007), should have resulted in a dryer stratosphere and not the opposite, casting some doubt on the currently accepted process.
Although a number of satellite observations of water vapour in the stratosphere are
20
available, they are of little use in the Tropical Tropopause Layer (TTL) between 14– 20 km because of large systematic biases, poor precision, broad vertical resolution and frequent presence of clouds, as shown by Montoux et al. (2007). Most of the infor-mation on this layer comes from in situ measurements by sondes, balloons and aircraft, all becoming increasingly available (Kley et al., 1982; Kelly et al., 1993; Jensen et al.,
25
ACPD
8, 15463–15490, 2008Hydration of the lower stratosphere by
ice crystal geysers
S. Khaykin et al.
Title Page
Abstract Introduction
Conclusions References
Tables Figures
◭ ◮
◭ ◮
Back Close
Full Screen / Esc
Printer-friendly Version
Interactive Discussion
stronger updrafts (Vonnegut and Moore, 1958), as confirmed recently by the TRMM (Tropical Rainfall Measuring Mission) radar overshooting precipitation features and the Lightning Imaging Sensor flashes (Liu and Zipser, 2005; Zipser et al., 2006). After the pioneering ER2 total water measurements over Panama in 1980 (Kley et al., 1982) and over Panama and Darwin in 1987 (Kelly et al., 1993), it is only recently that new
5
water vapour profiles over continental convective regions have been made available from the HIBISCUS (Pommereau et al., 2007; Durry et al., 2007) and TROCCINOX (Chaboureau et al., 2007; Corti et al., 2008) balloon and high altitude aircraft cam-paigns in Brazil and the SCOUT-O3 aircraft deployment in Northern Australia (Vaughan et al., 2008). Remarkably, they are all reporting enhanced moisture layers above the
10
tropopause over land convective systems, never seen in maritime observations where sub-visual cirrus is frequent but limited at and below the tropopause altitude (Kent et al., 1995).
The presence of moist layers in the lower stratosphere over land strongly suggests a hydration mechanism associated with convective overshooting, which could explain
15
also the higher concentration of long-lived species of tropospheric origin such as N2O
and CH4 in the TTL over land, particularly over Africa, as reported by Ricaud et
al. (2007). The explosive convection developing over land in the afternoon could lead to strong overshooting of adiabatically cooled air above the cold point tropopause (CPT) in the stratosphere as shown by Danielsen (1993), resulting in a systematic cooling of
20
the lower stratosphere in the afternoon as shown by Pommereau and Held (2007). It could also explain the presence of ice particles as suggested by Liu and Zipser (2005) from the relationship between precipitating ice mass and the mass of small ice particles seen by the TRMM radar, eventually evaporating, thus hydrating and not dehydrating the lower stratosphere as proposed by Danielsen (1982). The injection of ice particles
25
ACPD
8, 15463–15490, 2008Hydration of the lower stratosphere by
ice crystal geysers
S. Khaykin et al.
Title Page
Abstract Introduction
Conclusions References
Tables Figures
◭ ◮
◭ ◮
Back Close
Full Screen / Esc
Printer-friendly Version
Interactive Discussion
Grovesnor et al., 2007) suggesting a local injection of a few tons of water per second in
the lower stratosphere. As reported by in-situ aircraft measurements of H2O and HDO
(Hanisco et al., 2007), similar events may also occur in the extratropical stratosphere displaying isotopic water signatures that are characteristic of sublimated ice lofted from the troposphere during convective storms.
5
Aiming at better exploration of this possible mechanism of hydration of the lower stratosphere by convective overshoots, a series of simultaneous water vapour, particle and ozone measurements has been carried out within a new SCOUT-AMMA campaign
in August 2006 from Niamey, Niger (13.6◦N) in West Africa, a location of frequent
overshooting during the monsoon season according to Liu and Zipser (2005). Indeed,
10
the summer season there is characterized by powerful convective systems, commonly known as MCS (Mesoscale Convective Systems), developing due to the confrontation of moist air from the Gulf of Guinea carried by the monsoon and dry air from the Saharan heat low carried by the Harmattan wind. Those MCSs developing initially over East and Central Africa are travelling westwards and their convective activity is
15
strongly modulated by the diurnal cycle with a maximum development around 16 local time (e.g. Liu and Zipser, 2005).
Within the SCOUT-AMMA campaign named after the support of two projects of the European projects SCOUT-O3 (http://www.ozone-sec.ch.cam.ac.uk/scout o3/) and AMMA (http://www.amma-international.org) a number of soundings (29) of various
20
types and larger balloon flights (7) carrying a variety of instruments were performed, moreover in coordination during the first half of the month with high altitude M-55 Geophysica aircraft flights from Ouagadougou, Burkina-Faso, 400 km West of Niamey. Among the sondes, six of them were carrying integrated packages of water vapour, ozone and particle measuring instruments. These sondes were flown as close as
25
me-ACPD
8, 15463–15490, 2008Hydration of the lower stratosphere by
ice crystal geysers
S. Khaykin et al.
Title Page
Abstract Introduction
Conclusions References
Tables Figures
◭ ◮
◭ ◮
Back Close
Full Screen / Esc
Printer-friendly Version
Interactive Discussion
teorological package (pressure, temperature, GPS location and altitude). The sondes were reaching 30 km altitude, after which the measurements were continued during the fast descent below a parachute. The connection with possible overshoots upwind was analyzed by examination of MSG images available every 15 min along backward
trajec-tories using the method of brightness temperature difference between 6.2 and 10.8µm
5
for detecting the overshoot signatures (Schmetz et al., 1997) and cloud top information provided by the C-band radar operated with continuous 10-min volume scans.
The organisation of the paper is the following. Section 2 provides a description of the instruments and details of the experiment, whose results are presented in Sect. 3. The impact of overshooting systems on the lower stratospheric water content and the
10
relation between ice particles and water vapour over a local convective system are discussed in Sect. 4, followed by concluding remarks in Sect. 5.
2 Experimental setup
The payload for the sondes lifted by an Aerostar 1500 m3 plastic balloon, included
a backscatter (BKS) sonde, an EnSci Electro Chemical Cell (ECC) ozone sonde, a
15
Vaisala RS-92-SGP PTU radio sonde (H-Humicap), and a FLASH-B hygrometer cou-pled with a Vaisala RS-80 radiosonde at the bottom of the flight train 55 m below the balloon, and a parachute, for a total weight of 10 kg, allowing ascent to 30 km. The BKS sonde (see Rosen and Kjome, 1991, for technical details) is measuring the backscatter
coefficients at two wavelengths (940 nm and 480 nm) by sending out a light flash
ap-20
proximately every 7 s, and counting the backscattered photons with two photodiodes. The FLASH-B (FLuorescence Advanced Stratospheric Hygrometer for Balloon) in-strument is the Lyman-alpha hygrometer developed at the Central Aerological Obser-vatory for balloon-borne water vapour measurements in the upper troposphere and stratosphere (Yushkov et al., 1998, 2001). The instrument is based on the fluorescent
25
method (Kley and Stone, 1978; Bertaux and Delannoy, 1978), which uses the
measure-ACPD
8, 15463–15490, 2008Hydration of the lower stratosphere by
ice crystal geysers
S. Khaykin et al.
Title Page
Abstract Introduction
Conclusions References
Tables Figures
◭ ◮
◭ ◮
Back Close
Full Screen / Esc
Printer-friendly Version
Interactive Discussion
ment of the fluorescence of excited OH radicals. The source of Lyman-alpha radiation
(λ=121.6 nm) is a hydrogen discharge lamp, while the detector of OH fluorescence at
308–316 nm is a Hamamatsu R647-P photomultiplier run in photon-counting mode with a narrow band interference filter selecting the fluorescence spectral region. The inten-sity of the fluorescent light sensed by the photomultiplier is directly proportional to the
5
water vapour mixing ratio under stratospheric conditions (10–150 hPa) with small
oxy-gen absorption (3% at 50 hPa). The H2O measurement range is limited to pressures
lower than 300–400 hPa due to strong Lyman-alpha absorption in the troposphere. The instrument uses an open optical layout design (Khaplanov et al., 1992), where the optics is looking directly outside. Such arrangement is suitable for nighttime
mea-10
surements only at solar zenith angles larger than 98◦. The co-axial optical layout allows
a reduction in the size of the instrument to 106×156×242 mm for a total weight of about
1 kg including batteries. The hygrometer is coupled with a Vaisala RS-80 radiosonde, providing telemetry as well as pressure and temperature measurements.
Each FLASH-B is calibrated in the laboratory before flight. A description of the
pro-15
cedure can be found in V ¨omel et al. (2007). The precision of the measurements is 5.5% for a 4-s integration time at stratospheric conditions, while the accuracy is limited by the calibration error estimated at 4% in the 3–200 ppmv range. The total uncertainty is less than 10% at the stratospheric mixing ratios greater than 3 ppmv, increasing to about 20% at mixing ratios less than 3 ppmv. Accuracy and good performance of the
20
FLASH-B instrument have been confirmed through point-by-point comparisons with the NOAA-CMDL frost point hygrometer during the LAUTLOS-WAVVAP intercomparison campaign (V ¨omel et al., 2007) showing excellent agreement between both instruments
with a mean deviation of −2.4±3.1% (1 standard deviation) for data between 15 and
25 km altitude.
25
ACPD
8, 15463–15490, 2008Hydration of the lower stratosphere by
ice crystal geysers
S. Khaykin et al.
Title Page
Abstract Introduction
Conclusions References
Tables Figures
◭ ◮
◭ ◮
Back Close
Full Screen / Esc
Printer-friendly Version
Interactive Discussion
temperature provided by the Vaisala RS-92 radiosonde.
The flight configuration of FLASH-B, in which the analyzed volume is located beneath the downward looking optics about 24 mm away from the lens, caused noticeable self-contamination due to water outgassing from the instrument surfaces during the ascent in the stratosphere above 90 hPa. In this arrangement, the measurements during the
5
fast descent in undisturbed air can be considered as contamination-free as shown by the drop of water vapour immediately after the balloon burst.
3 Flight results
The data available are those of the six soundings, all performed in the evening after sunset and downwind or next to MCSs. The details of the six flights are shown in
10
Table 1. The water vapour, backscatter and temperature profiles of each are displayed in Fig. 1 and the average water vapour profile along with the standard deviation are shown in Fig. 2.
The cold point tropopause (CPT), the minimum temperature, is found at 16.5 km on
average with a mean temperature of −79.5◦C, varying between 16.3 km and 16.8 km
15
and with temperatures ranging from−77.5◦C to−81.5◦C. This is significantly lower and
warmer than the 17–17.5 km,−85/−90◦C CPT over Darwin. The BKS sonde indicates
the frequent presence of cloud anvils and cirrus in the upper troposphere sometimes up to the CPT, a permanent layer of aerosols between 19–21 km, and sporadic thin layers of particles in the lower stratosphere, particularly enhanced on 23 August. The
20
aerosol layer at 19–21 km seen also by all other balloon and aircraft particle measur-ing instruments durmeasur-ing the campaign (optical particle counter, UV-Vis solar occultation
spectrometer, backscatter diode laser) was made of 0.1µm radius, undepolarizing and
thus spherical liquid particles, the characteristics of volcanic aerosols. Since they could be observed also by the CALIPSO lidar from the beginning of the satellite operation in
25
ACPD
8, 15463–15490, 2008Hydration of the lower stratosphere by
ice crystal geysers
S. Khaykin et al.
Title Page
Abstract Introduction
Conclusions References
Tables Figures
◭ ◮
◭ ◮
Back Close
Full Screen / Esc
Printer-friendly Version
Interactive Discussion
18 km above the tropopause are very similar to those reported in Brazil by the same backscatter sonde up to 20.8 km (Nielsen et al., 2007), and by the Forward Scatter-ing Spectrometer Probe (FSSP)-100 on board the M-55 Geophysica aircraft at around 18 km (Chaboureau et al., 2007). Since they could be seen during descent below a parachute they cannot be attributed to particles falling from the balloon. The colour
5
index of the BKS sonde, i.e. the ratio between the aerosol backscatter ratios at 940 nm and 480 nm, and the depolarized signal of the backscatter diode laser flown on another balloon indicate that, in contrast to the volcanic aerosols at 20 km, these particles are
non spherical and of 0.5–10µm radius, the characteristics of small ice crystals.
The FLASH-B relative humidity (RH) in the troposphere in the 350 hPa–150 hPa
10
range show very good agreement with the Vaisala RS-92 H-Humicap RH (mean diff
er-ence of−0.27±6.15% RH). At altitude below 350 hPa FLASH-B is incapable of
measur-ing humidity due to high absorption of Lyman-alpha emission by water vapour. In the stratosphere FLASH-B data, showing good repeatability, are also consistent with the measurements by the fast in situ Lyman-alpha hygrometer (FISH) (Zoger et al., 1999)
15
flown on the high-altitude M55 Geophysica aircraft during the same period from Oua-gadougou, displaying a minimum mixing ratio of 4.2 ppmv at 19 km (450 K) (C. Schiller, personal communication, 2007), compared to the 4.4 ppmv value seen by FLASH-B at the same level. The profiles of the micro-SDLA tunable diode laser hygrometer (Durry et al., 1999) flown on a larger balloon in parallel with the sondes on 5 and 23 August
20
showed similar profiles in the TTL, but for an unknown reason biased systematically low by a factor 1.8 and 2, resulting in doubtful values of 2.6 ppmv and 2.1 ppmv at 18.3 and 20 km, respectively, in the two flights.
Overall, the FLASH-B water vapour profiles display an almost invariably saturated or supersaturated upper troposphere and an average mixing ratio (MR) of 6.5 ppmv at
25
ACPD
8, 15463–15490, 2008Hydration of the lower stratosphere by
ice crystal geysers
S. Khaykin et al.
Title Page
Abstract Introduction
Conclusions References
Tables Figures
◭ ◮
◭ ◮
Back Close
Full Screen / Esc
Printer-friendly Version
Interactive Discussion
the water vapour amount is highly variable between the CPT (near 16.5 km, 365 K) and 19 km (450 K), a region displaying frequently enhanced water vapour layers.
In the upper troposphere the water vapour profiles show saturation or supersatura-tion with respect to ice, except on 5 August when the CPT temperature was as high as
−77.5◦C and no clouds were observed by the BKS sonde. The air inside thick cirrus
5
clouds or anvils is always saturated or supersaturated. Supersaturation in cloud-free conditions is frequently observed too. On 14, 21 and 23 August cirrus anvil cloud tops reach the CPT level according to the BKS sonde measurements. A maximum saturation ratio as high as 177% RHi is observed at 15.9 km a little below the CPT in a cumulonimbus anvil on 14 August. No saturation was observed higher than 600 m
10
above the CPT.
A better insight into the vertical structure of water vapour in the stratosphere is pro-vided by Fig. 2 showing the mean water vapour profile calculated from the six sound-ings along with the standard deviation. Above the minimum at 475 K (20 km), the mean mixing ratio is gradually increasing to a maximum of 5.8 ppmv around 620 K (24.7 km),
15
above which the mixing ratio is almost constant or slightly decreasing up to 30 km. The observed structure is very consistent with the water vapour tape recorder signal derived from HALOE by Mote et al. (1996). It corresponds to an uplift of the minimum mixing ratio from about 17–17.5 km during the season with the coldest tropopause tem-perature in the Northern Hemisphere winter in January–February at a vertical velocity
20
of 0.5 km/month (0.2 mm/s) consistent with the Brewer-Dobson circulation. However, between the CPT and the hygropause, the picture provided by the high-resolution
mea-surements differs significantly from the satellite profiles with low vertical resolution. The
water vapour increase in this layer in the Northern Hemisphere summer season does not show a smooth profile from 6.5 ppmv at the CPT to 4.2 ppmv at the hygropause,
25
ACPD
8, 15463–15490, 2008Hydration of the lower stratosphere by
ice crystal geysers
S. Khaykin et al.
Title Page
Abstract Introduction
Conclusions References
Tables Figures
◭ ◮
◭ ◮
Back Close
Full Screen / Esc
Printer-friendly Version
Interactive Discussion
to the mean profile in those layers are highly variable, ranging from 0.2 ppmv (3 Au-gust) to 7 ppmv (23 AuAu-gust). Indeed, the standard deviation (Fig. 2), accounting for the variability between the profiles, decreases to a quasi-constant value of 0.2 ppmv only by 450 K (19 km), implicitly suggesting that the lower stratosphere is influenced by a succession of convective overshootings, carrying moisture across the tropopause.
5
However, the amplitude of hydration remains far from saturation except when immedi-ately above the CPT. Among all profiles that of 3 August, closer to the beginning of the convective season is the driest with a minor enhancement at 17.2 km, whilst most of the others are displaying multiple layers between the CPT and 20.5 km (5 August), the largest of 13 ppmv being observed 0.8 km above the CPT on the last flight on 23
Au-10
gust.
4 Discussion
4.1 Impact of convective overshoots
A key question is how fresh each of these water vapour layers seen in the lower stratosphere are and whether they relate to overshoots upwind. This question was
15
addressed by looking at overshoots, which might have occurred upwind along back-ward trajectories ending at the sounding location.
The trajectories are three-day backward 3-dimensional trajectories calculated ev-ery 5 K in the 350–450 K range using the TRACAO trajectory model (Lukyanov et al., 2003), based on ECMWF T511 operational analyses (21 pressure levels). The
cal-20
culations are performed by time steps of 15 min corresponding to the time resolution of MSG satellite images, a product of the SEVIRI (Spinning Enhanced Visible and In-frared Imager) instrument operating onboard the Meteosat-08 (MSG-01) satellite. The presence of convective overshoots along the trajectories is identified from MSG
im-ages by the brightness temperature difference (BTD) technique (Schmetz et al., 1997).
25
ACPD
8, 15463–15490, 2008Hydration of the lower stratosphere by
ice crystal geysers
S. Khaykin et al.
Title Page
Abstract Introduction
Conclusions References
Tables Figures
◭ ◮
◭ ◮
Back Close
Full Screen / Esc
Printer-friendly Version
Interactive Discussion
at two wavelengths, 6.2µm and 10.8µm, the first being sensitive to the water vapour
emission at higher temperature in the lower stratosphere above the cloud in contrast to the adiabatically cooled turret. Following Chaboureau et al. (2007), overshoots are
declared when the BTD exceeds 3 K within a MSG pixel of 3 km×3 km, although
indi-vidual turrets may be substantially smaller than this. Overshoots are detected along
5
each backward trajectory together with an estimate of their size given by the number of MSG pixels with BTD larger than 3 K.
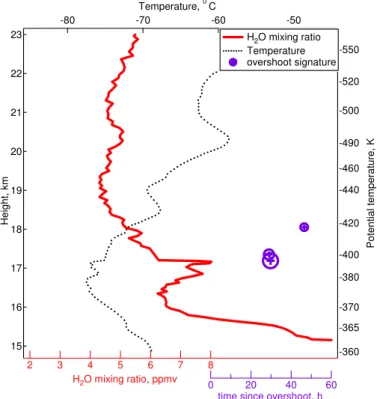
Figure 3 shows an example of backward trajectories at different potential temperature
levels starting 30 h prior to the sounding at 20:00 UTC on 5 August and superimposed on an MSG BT image. The two trajectories ending at 395 K and 400 K passed over an
10
overshooting MCS at 14:00 UT on 4 August, i.e. 30 h prior to the sounding. The time when the air mass was passing over an overshoot area and the size of the latter were explored for each trajectory. An example of the results of such analysis for 5 August is shown in Fig. 4. The time at which overshoots were encountered are represented by markers at the altitude of the water vapour-enhanced layers of size proportional to the
15
number of MSG pixels of BTD>3 K. In this example, three overshoots were
encoun-tered, a large one of 23 pixels and a smaller one of 12 pixels around 390 K 30 h before the sounding, and a small one of 6 pixels at 410 K 48 h before. The three are corre-sponding to water vapour layers centred at 17.1 km (391 K) and 17.9 km (411 K). How-ever, no overshoot could be identified corresponding to the layer at 20.3 km (492 K).
20
The information relevant to all soundings is summarized in Table 2, including an estimate of the vertical velocity of the overshoot above the equilibrium level assumed at 14 km, using the rule of thumb (Vonnegut and Moore, 1958). A connection with an overshoot upwind during the three previous days could be identified for 70% of the layers, occurring between 16:00 h local in the afternoon and 04:00 h during the night
25
ACPD
8, 15463–15490, 2008Hydration of the lower stratosphere by
ice crystal geysers
S. Khaykin et al.
Title Page
Abstract Introduction
Conclusions References
Tables Figures
◭ ◮
◭ ◮
Back Close
Full Screen / Esc
Printer-friendly Version
Interactive Discussion
no overshoot could be found, the required velocity of the updraft above the equilibrium level is between 50–80 m/s according to the rule of thumb proposed by Vonnegut and Moore (1958). An order of magnitude of such vertical velocity as well as that of the water vapour enhancements are consistent with those suggested by cloud resolving models (Chaboureau et al., 2007; Grovesnor et al., 2007).
5
However, no direct connection with an overshoot could be identified for about 30% of the layers. The possible reason for that could be that the overshoot occurred more than 72 h before the sounding over Ethiopia or possibly also over India during the monsoon
season, East of 40◦E , the limit of the MSG imagery used in this study.
In summary, the unambiguous connection between enhanced water vapour layers
10
reported by the sondes over Niamey and earlier upwind overshoots incorporates the idea of a hydration process of the lower stratosphere by fast uplift of water conden-sates across the tropopause over continental areas. Although such events have been already observed in the southern tropics during the local summer (Nielsen et al., 2007; Chaboureau et al., 2007), they seem to be particularly abundant in the northern tropics
15
during the monsoon season in Africa and Asia. The larger geographical extension of continental convective regions in the Northern Hemisphere (Liu and Zipser, 2005) may explain the higher concentration of water vapour in the lower stratosphere during the summer compared to the same season in the Southern Hemisphere.
4.2 Ice particles and water vapour over a local convective system on 23 August 2006
20
The next step is to understand how water amounts larger than those permitted by condensation at the temperature of the tropopause could penetrate the stratosphere. Three out of six profiles (14 August, 21 August and 23 August) show the presence of thin layers of particles above the CPT similar to that reported up to 20.8 km over Brazil by Nielsen et al. (2007). Among these, the largest are observed on 23 August. An
25
ACPD
8, 15463–15490, 2008Hydration of the lower stratosphere by
ice crystal geysers
S. Khaykin et al.
Title Page
Abstract Introduction
Conclusions References
Tables Figures
◭ ◮
◭ ◮
Back Close
Full Screen / Esc
Printer-friendly Version
Interactive Discussion
In addition to the existence of upwind overshoots already identified, the specificity of this sounding in contrast to all others is that it was launched within a broad convective area and particularly two hours after the pass of a small-size convective system over the launching station when the co-located C-band radar was showing turrets develop-ing up to 18.5 km (Fig. 6). The most remarkable features in the plot in Fig. 5 are: a)
5
ice saturation in a cloud anvil expanding from 13–16 km and saturating the BKS
sig-nal; b) a relative minimum of water vapour MR at the cold point tropopause of−78◦C
at 15.8 km corresponding to saturation; c) the presence of a strongly supersaturated (138% RHi) sharp water vapour peak immediately above at 16.2 km, also present in the ascent profile (not shown) and thus not an instrumental artefact, coincident with an
10
ice crystals layer composed of 0.5–10µm size particles, according to the BKS colour
index; and d) the presence of small water vapour-enhanced layers up to 18.5 km in a subsaturated region also coincident with layers of ice crystals, but on the descent profile only and not during the ascent an hour earlier, 50 km East.
Remarkable also is the presence of dips in the ozone profile coincident with the water
15
vapour and ice crystals layers, indicative of an injection of relatively ozone-poor tropo-spheric air into the lower stratosphere. Although low-biased by a factor 2 compared to that of FLASH-B, the water vapour profile reported by the micro-SDLA tunable diode laser instrument flown on a larger balloon at 18:15 UT, an hour before the sondes, shows a similar 1 km broad peak of 6 ppmv at 16 km above a minimum of 3.8 ppmv at
20
the tropopause, at 15.2 km only. Note that its lower altitude compared to all other flights might be coming from the injection of adiabatically cooled air over the local convective system which, as shown by Pommereau and Held (2007), is resulting in the lowering of the CPT. Also flown on the same balloon, the LABS (Laser Backscatter Sonde) in-strument shows several layers of depolarizing and thus solid particles at 19.2 km, but
25
ACPD
8, 15463–15490, 2008Hydration of the lower stratosphere by
ice crystal geysers
S. Khaykin et al.
Title Page
Abstract Introduction
Conclusions References
Tables Figures
◭ ◮
◭ ◮
Back Close
Full Screen / Esc
Printer-friendly Version
Interactive Discussion
as well as dips in ozone profiles at the same levels indicative of fast uplift of tropospheric air. Those observations provide experimental evidence of hydration of the stratosphere after sublimation of ice crystals freshly injected by overshooting turrets, a geyser-like feature, as shown by pictures of severe storms taken from a Learjet (Fujita, 1992) and suggested by cloud resolving model simulations (Chaboureau et al., 2007; Grovesnor
5
et al., 2007).
5 Concluding remarks
A series of six balloon flights combining a fast response FLASH-B Lyman-alpha hy-grometer and particles and ozone measurements supported by C-band ground-based radar observations has been carried out in West Africa during the monsoon season.
10
The high vertical resolution observations show evidence of the presence of local accu-mulations of water vapour-enhanced layers between the tropopause at 370 K (16.0 km) and the 450 K level (19 km). Most of them are shown connected with overshooting events upwind identified from satellite IR images, flown over by the air mass probed by the sondes along three-day backward trajectories. In the case of a local overshoot
15
identified by echo tops turrets up to 18.5 km in the C-band radar, tight coincidence was found between enhanced water vapour, ice crystal and ozone dip layers indicative of fast uplift of tropospheric air across the tropopause. The water vapour mixing ratio in the enriched layers, higher than that of condensation at the tropopause, and the coincidence with the presence of ice crystals strongly suggest hydration of the lower
20
stratosphere by geyser-like injection of ice particles over overshooting turrets.
The local accumulation of water vapour seen by the high-resolution hygrometer in contrast to smooth profiles reported by broad resolution satellite observations, sug-gests that the above hydration mechanism may be responsible for the known summer
seasonal increase of moisture in the lower stratosphere. The mechanism offers also an
25
re-ACPD
8, 15463–15490, 2008Hydration of the lower stratosphere by
ice crystal geysers
S. Khaykin et al.
Title Page
Abstract Introduction
Conclusions References
Tables Figures
◭ ◮
◭ ◮
Back Close
Full Screen / Esc
Printer-friendly Version
Interactive Discussion
sult in the opposite behavior if the dehydration process proposed by Danielsen (1982) was correct. Ice geyser hydration across the tropopause may be a significant factor controlling water vapour in the stratosphere on a global scale.
Acknowledgements. The authors thank the CNES balloon team, the West African ASECNA
Meteorological Service, the Niger Air Traffic Control and Air Force, the French Institute for
5
Research and Development in Niamey and the AMMA project, particularly Arona Diedhou and Cheikh Kane for their help in sondes operations, Brian Russell at the University of Michigan for his assistance with the MIT radar imagery, and Karim Ramage of the ClimServ data base for his help in the use of MSG images, which are all gratefully acknowledged. This work was supported by the EC SCOUT-O3 integrated project, INSU in France, the INTAS YSF
05-109-10
4955 grant, the ISTC #3093 project and RFBR #07-05-00486 grant in Russia.
References
Bertaux, J. L. and Delannoy, A.: Premieres measures stratospheriques par un hygrometre a fluorescence ultraviolette, C. R. Acad. Sc. Paris, 286, 191–194, 1978.
Brewer, A. W.: Evidence for a world circulation provided by the measurements of helium and
15
water vapour distribution in the stratosphere, Q. J. Roy. Meteorol. Soc., 75, 351–363, 1949. Chaboureau, J.-P., Cammas, J.-P., Duron, J., Mascart, P. J., Sitnikov, N. M., and Voessing, H. J.:
A numerical study of tropical cross-tropopause transport by convective overshoots, Atmos. Chem. Phys., 7, 1731–1740, 2007,
http://www.atmos-chem-phys.net/7/1731/2007/.
20
Corti, T., Luo, B. P., de Reus, M., Brunner, D., Cairo, F., Mahoney, M. J., Martucci, G., Matthey, R., Mitev, V., dos Santos, F. H., Schiller, C., Shur, G., Sitnikov, N. M., Spelten, N., Vossing, H. J., Borrmann, S., and Peter, T.: Unprecedented evidence for overshooting convection hydrat-ing the tropical stratosphere, Geophys. Res. Lett., 35, L10810, doi:10.1029/2008GL033641, 2008.
25
Danielsen, E. F.: A dehydration mechanism for the stratosphere, Geophys. Res. Lett., 9, 605– 608, 1982.
Danielsen, E. F.: Insitu evidence of rapid, vertical, irreversible transport of lower tropospheric air into the lower tropical stratosphere by convective cloud turrets and by larger-scale upwelling in tropical cyclones, J. Geophys. Res.-Atmos., 98 , 8665–8681, 1993.
ACPD
8, 15463–15490, 2008Hydration of the lower stratosphere by
ice crystal geysers
S. Khaykin et al.
Title Page
Abstract Introduction
Conclusions References
Tables Figures
◭ ◮
◭ ◮
Back Close
Full Screen / Esc
Printer-friendly Version
Interactive Discussion
Durry, G. and Megie, G.: Atmospheric CH4 and H2O monitoring with near-infrared InGaAs laser diodes by the SDLA, a balloonborne spectrometer for tropospheric and stratospheric in situ measurements, Appl. Optics, 38, 7342–7354, 1999.
Durry, G., Huret, N., Hauchecorne, A., Marecal, V., Pommereau, J.-P., Jones, R. L., Held, G., Larsen, N., and Renard, J.-B.: Isentropic advection and convective lifting of water vapor
5
in the UT-LS as observed over Brazil (22◦S) in February 2004 by in situ high-resolution
measurements of H2O, CH4, O3 and temperature, Atmos. Chem. Phys. Discuss., 6, 12 469– 12 501, 2007.
Forster, P. M. and Shine, K. P.: Assessing the climate impact of trends in stratospheric water vapor, Geophys. Res. Lett., 29, 1086, doi:10.1029/2001GL013909, 2002.
10
Fujita, T. T.: Mystery of Severe Storms, during the 50 years 1942–1992, Wind Research Labo-ratory, Department of Geophysical Sciences, University of Chicago, 1992.
Grosvenor, D. P., Choularton, T. W., Coe, H., and Held, G.: A study of the effect of overshooting
deep convection on the water content of the TTL and lower stratosphere from Cloud Resolv-ing Model simulations, Atmos. Chem. Phys., 7, 4977–5002, 2007,
15
http://www.atmos-chem-phys.net/7/4977/2007/.
Hanisco, T. F., Moyer, E. J., Weinstock, E. M., St. Clair, J. M., Sayres, D. S., Smith, J. B., Lockwood, R., Anderson, J. G., Dessler, A. E., Keutsch, F. N., Spackman, J. R., Read, W. G., and Bui, T. P.: Observations of deep convective influence on stratospheric water vapor and its isotopic composition, Geophys. Res. Lett., 34, L04814, doi:10.1029/2006GL027899,
20
2007.
Holton, J. R., Haynes, P. H., McIntyre, M. E., Douglass, A. R., Rood, R. B., and Pfister, L.: Stratosphere-troposphere exchange, Rev. Geophys., 33, 403–439, 1995.
Jensen, E. J., Smith, J. B., Pfister, L., Pittman, J. V., Weinstock, E. M., Sayres, D. S., Herman, R. L., Troy, R. F., Rosenlof, K., Thompson, T. L., Fridlind, A. M., Hudson, P. K., Cziczo, D.
25
J., Heymsfield, A. J., Schmitt, C., and Wilson, J. C.: Ice supersaturations exceeding 100% at the cold tropical tropopause: Implications for cirrus formation and dehydration, Atmos. Chem. Phys., 5, 851–862, 2005,
http://www.atmos-chem-phys.net/5/851/2005/.
Kelly, K. K., Proffitt, M. H., Chan, K. R., Loewenstein, M., Podolske, J. R., Strahan, S. E., Wilson,
30
J. C., and Kley, D.: Water Vapor and Cloud Water Measurements Over Darwin During the STEP 1987 Tropical Mission, J. Geophys. Res., 98(D5), 8713–8723, 1993.
ACPD
8, 15463–15490, 2008Hydration of the lower stratosphere by
ice crystal geysers
S. Khaykin et al.
Title Page
Abstract Introduction
Conclusions References
Tables Figures
◭ ◮
◭ ◮
Back Close
Full Screen / Esc
Printer-friendly Version
Interactive Discussion
Related Variations in Tropical Cirrus Cloud as Measured by SAGE II, J. Climate, 8, 2577– 2594, 1995.
Khaplanov, M., Astakhov, V., Lukjanov, A., Kretova, M., and Yushkov, V.: Fluorescent hygrom-eter for middle atmosphere measurements, Proc. 19th Annual European Meeting on Atmo-spheric Studies by Optical Methods, 540–545, 1992.
5
Kley, D. and Stone, E. J.: Measurements of water vapor in the stratosphere by photodissotiation with Ly-alpha (1216 A) light, Rev. Sci. Instrum., 49, 661–697, 1978.
Liu, C. and Zipser, E. J.: Global distribution of convection penetrating the tropical tropopause, J. Geophys. Res., 110, D23104, doi:10.1029/2005JD006063, 2005.
Lukyanov, A., Nakane, H., and Yushkov, V.: Lagrangian estimations of ozone loss in the core
10
and edge region of the arctic polar vortex 1995/1996: Model results and observations, J. Atmos. Chemistry, 44(2), 191–210, 2003.
Montoux, N., Hauchecorne, A., Pommereau, J.-P., Durry, G., Morel, B., Jones, R. L., Lef `evre, F., and Bencherif, H.: Evaluation of balloon and satellite water vapour measurements in the Southern tropical UTLS during the HIBISCUS campaign, Atmos. Chem. Phys. Discuss., 7,
15
6037–6075, 2007,
http://www.atmos-chem-phys-discuss.net/7/6037/2007/.
Mote, P. W., Rosenlof, K. H., Mclntyre, M. E., Carr, E. S., Gille, J. C., Holton, J. R., Kinnersley, J. S., Pumphrey, H. C., Russell III, J. M., and Waters, J. W.: An atmospheric tape recorder: The imprint of tropical tropopause temperatures on stratospheric water vapor, J. Geophys.
20
Res., 101(D2), 3989–4006, 1996.
Nielsen, J. K., Larsen, N., Cairo, F., Di Donfrancesco, G., Rosen, J. M., Durry, G., Held, G., and Pommereau, J.-P.: Solid particles in the tropical lowest stratosphere, Atmos. Chem. Phys., 7, 685–695, 2007, http://www.atmos-chem-phys.net/7/685/2007/.
Oltmans, S., V ¨omel, H., Hofmann, D., Rosenlof, K., and Kley, D.: The increase in stratospheric
25
water vapor from balloon-borne, frostpoint hygrometer measurements at Washington, D.C. and Boulder, Colorado, Geophys. Res. Lett., 27(21), 3453–3456, 2000.
Pommereau, J.-P. and Held, G.: Is there a stratospheric fountain?, Atmos. Chem. Phys. Dis-cuss., 7, 8933–8950, 2007, http://www.atmos-chem-phys-discuss.net/7/8933/2007/.
Pommereau, J.-P., Garnier, A., Held, G., et al.: An overview of the HIBISCUS campaign, Atmos.
30
Chem. Phys. Discuss., 7, 2389–2475, 2007,
http://www.atmos-chem-phys-discuss.net/7/2389/2007/.
ACPD
8, 15463–15490, 2008Hydration of the lower stratosphere by
ice crystal geysers
S. Khaykin et al.
Title Page
Abstract Introduction
Conclusions References
Tables Figures
◭ ◮
◭ ◮
Back Close
Full Screen / Esc
Printer-friendly Version
Interactive Discussion
water vapor after 2001: Links to changes in the tropical tropopause and the Brewer-Dobson circulation, J. Geophys. Res., 111, D12312, doi:10.1029/2005JD006744, 2006.
Ricaud, P., Barret, B., Atti ´e, J.-L., Le Flochmo ¨en, E., Motte, E., Teyss `edre, H., Peuch, V.-H., Livesey, N., Lambert, A., and Pommereau, J.-P.: Impact of land convection on troposphere-stratosphere exchange in the tropics, Atmos. Chem. Phys, 7, 5639–5657, 2007.
5
Richard, E. C., Tuck, A. F., Aikin, C., Kelly, K. K., Herman, R. L., Troy, R. F., Hovde, S. J., Rosenlof, K. H., Thompson, T. L., and Ray, A.: High-resolution airborne profiles of CH4, O3, and water vapour near tropical Central America in late January to early February 2004, J. Geophys. Res., 111, D13304, doi:10:1029/2005JD006513, 2006.
Rosen, J. M. and Kjome, N. T.: Backscattersonde – A new instrument for atmospheric aerosol
10
research, Appl. Optics, 30, 1552–1561, 1991.
Rosenlof, K., Oltmans, S., Kley, D., Russell III, J. M., Chiou, E.-W., Chu, W. P., Johnson, D. G., Kelly, K. K., Michelsen, H. A., Nedoluha, G. E., Remsberg, E. E., Toon, G. C., and McCormick, M. P.: Stratospheric water vapor increases over the past half-century, Geophys. Res. Lett., 28(7), 1195–1198, 2001.
15
Seidel, D. J., Ross, R. J., Angell, J. K., and Reid, G. C.: Climatological characteristics of the tropical tropopause as revealed by radionsondes, J. Geophys. Res., 106(D8), 7857–7878, 2001.
Schmetz, J., Tjemkes, S. A., Gube, M., and van de Berg, L.: Monitoring deep convection and convective overshooting with METEOSAT, Adv. Space Res., 19(3), 433–441, 1997.
20
Sherwood, S. C. and Dessler, A. E.: On the control of stratospheric humidity, Geophys. Res. Lett., 27, 2513–2516, 2006.
Solomon, S., Garcia, R. R., Rowland, F. S., and Wuebbles, D. J.: On the depletion of Antarctic ozone, Nature, 321, 755–758, 1986.
Tuck, A., Hovde, S. J., Kelly, K. K., Reid, S. J., Richard, E. C., Atlas, E. L., Donnelly, S. G.,
25
Stroud, V. R., Cziczo, D. J., Murphy, D. M., Thomson, D. S., Elkins, J. W., Moore, F. L., Ray, E. A., Mahoney, M. J., and Friedl, R. R.: Horizontal variability 1–2 km below the tropical tropopause, J. Geophys. Res., 109, D05310, doi:10.1029/2003JD003942, 2004.
Vaughan, G., Schiller, C., MacKenzie, A. R., Bower, K., Peter, T., Schlager, H., Harris, N. R. P., and May, P. T.: SCOUT-O3/ACTIVE: High-altitude Aircraft Measurements around Deep
30
Tropical Convection, B. Am. Meteorol. Soc., 89, 647–662, 2008.
ACPD
8, 15463–15490, 2008Hydration of the lower stratosphere by
ice crystal geysers
S. Khaykin et al.
Title Page
Abstract Introduction
Conclusions References
Tables Figures
◭ ◮
◭ ◮
Back Close
Full Screen / Esc
Printer-friendly Version
Interactive Discussion
the TTL, Proc. Reunion Island Internat. Symp., November 2007.
V ¨omel, H., Oltmans, S. J., Johnson, B. J., Hasebe, F., Shiotani, M., Fujiwara, M., Nishi, N., Agama, M., Cornejo, J., Paredes, F., and Enriquez, H.: Balloon-borne observations of water vapour and ozone in the tropical upper troposphere and lower stratosphere, J. Geophys. Res., 107(D14), 4210–4222, 2002.
5
V ¨omel, H., Yushkov, V., Khaykin, S., Korshunov, L., Kyr ¨o, E., and Kivi, R.: Intercomparisons of Stratospheric Water Vapor Sensors: FLASH-B and NOAA/CMDL Frost-Point Hygrometer, J. Atmos. Oceanic Technol., 24, 941–952, 2007.
Vonnegut, B. and Moore, C. B.: Giant Electrical storms, Recent Advances in Atmospheric Electricity, Pergamon Press (London), 399–411, 1958.
10
Weinstock, E. M., Hintsa, E. J., Dessler, A. E., and Anderson, J. G.: Measurements of water vapour in the tropical lower stratosphere during CEPEX campaign: Results and interpreta-tion, Geophys. Res. Lett., 22(23), 3231–3234, 1995.
Williams, E., Nathou, N., Hicks, E., Pontikis, C., Russell, B., Miller, M., and Bartholomew, M. J.: The Electrification of Dust-Lofting Gust Fronts (“Haboobs”) in the Sahel, Atmos. Res.,
15
accepted, 2008.
WMO: Scientific assessment of Ozone Depletion: 2006, Global Ozone Research and Monitor-ing project, Report No. 50, 572 pp., Geneva, 2007.
Yushkov, V., Merkulov, S., and Astakhov, V.: Optical balloon hygrometer for upper stratosphere and stratosphere water vapour measurements, in: Optical remote sensing of the atmosphere
20
and clouds, edited by: Wang, J., Wu, B., Ogawa, T., and Guans, Z.-H., Proc. SPIE, 3501, 439–445, 1998.
Yushkov, V., Sitnikov, N., Zaitcev, I., Pommereau, J.-P., and Garnier, A.: Stratospheric water vapor measurements in the winter arctic with optical fluorescence hygrometer on short and long duration balloons, in: Proceedings of the 15th ESA Symposium on European Rocket
25
and Balloon programmes and Related Research, Biarritz, France, ESA SP-471, 28–31 May 2001, edited by: Warmbein, B., ESA, 263–268, 2001.
Zipser, E. J., Cecil, D. J., Liu, C., Nesbitt, S. W., and Yorty, D. P.: Where are the most intense thunderstorms on earth?, B. Am. Meteorol. Soc., 87, 1057–1071, 2006.
Zoger, M., Schiller, C., and Eicke, N.: Fast in situ hygrometers: A new family of balloonborne
30
and airborne Lyman-α photofragment fluorescence hygrometers, J. Geophys. Res., 104,
ACPD
8, 15463–15490, 2008Hydration of the lower stratosphere by
ice crystal geysers
S. Khaykin et al.
Title Page
Abstract Introduction
Conclusions References
Tables Figures
◭ ◮
◭ ◮
Back Close
Full Screen / Esc
Printer-friendly Version
Interactive Discussion
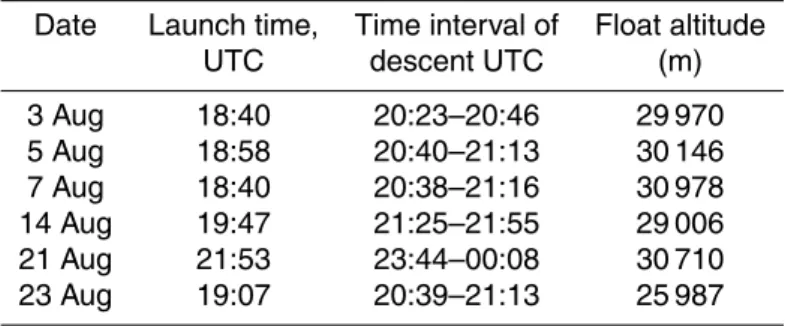
Table 1.List of soundings (Local Time=UTC+1).
Date Launch time, Time interval of Float altitude
UTC descent UTC (m)
3 Aug 18:40 20:23–20:46 29 970
5 Aug 18:58 20:40–21:13 30 146
7 Aug 18:40 20:38–21:16 30 978
14 Aug 19:47 21:25–21:55 29 006
21 Aug 21:53 23:44–00:08 30 710
ACPD
8, 15463–15490, 2008Hydration of the lower stratosphere by
ice crystal geysers
S. Khaykin et al.
Title Page
Abstract Introduction
Conclusions References
Tables Figures
◭ ◮
◭ ◮
Back Close
Full Screen / Esc
Printer-friendly Version
Interactive Discussion
Table 2.Summary of observed water vapour-enhanced layers and correlated convective
over-shoots upwind. From left to right: date of sounding, altitude and potential temperature of the layer, amplitude of enhancement compared to background, thickness of the layer in altitude and potential temperature units, delay between the overshoot and the sounding, local time of overshoot, size in MSG pixels and vertical velocity at the equilibrium level at 14 km estimated as in Vonnegut and Moore (1958).
Date H2O layer altitude (km) H2O enhancement Layer thickness Time since Local time of Size of overshoot Vertical velocity
pot. temp. (K) (ppmv) (km/K) overshoot (h) overshoot, (h) (pixels) (m/s)
3 Aug 17.2/395 0.2 0.6/10 22 23 5 64
5 Aug 17.1/391 1.5 1.2/30 30 15:15 23+12 62
5 Aug 17.9/411 0.6 0.6/9 47 23:30 6 78
5 Aug 20.3/492 0.6 1/16 n/a n/a n/a 126
7 Aug 17.4/390 0.3 0.5/17 n/a n/a n/a 68
14 Aug 16.9/377 1.8 0.4/14 21, 19 01, 03 75+65 58
14 Aug 17.0/384 1.0 0.7/19 44 03 33 60
14 Aug 17.3/394 1.3 0.7/19 n/a n/a n/a 66
14 Aug 18.2/416 0.7 0.7/19 n/a n/a n/a 84
21 Aug 16.6/378 0.8 0.3/11 5 19 11+12 52
21 Aug 16.9/390 0.2 >0.2/>0.7 6 18 6 58
21 Aug 17.2/408 1.0 0.7/24 6 18 7+3 64
23 Aug 16.1/368 7.0 1.2/21 19, 23 03, 23 7+7+6 62
23 Aug 17.6/392 1.1 0.3/5 22 00 5 72
ACPD
8, 15463–15490, 2008Hydration of the lower stratosphere by
ice crystal geysers
S. Khaykin et al.
Title Page Abstract Introduction Conclusions References Tables Figures ◭ ◮ ◭ ◮ Back Close
Full Screen / Esc
Printer-friendly Version Interactive Discussion 30 28 26 24 22 20 18 16 14 Heigh t, km
2 3 4567 8 910 2 3 4567 8 9100 backscatter ratio
2 3 4 5 678910 2 3
H2O mix. ratio, ppmv
-80 -70 -60 -50
Temperature, 0C
H2O mix. ratio Saturation mix. ratio Temperature backscatter ratio
mean H2O profile
03 August 30
28 26 24 22 20 18 16 14 Heigh t, km
2 3 4567 8 910 2 3 4567 8 9100 backscatter ratio
2 3 4 5 6 78910 2 3
H2O mix. ratio, ppmv
-80 -70 -60 -50
Temperature, 0C
H2O mix. ratio Saturation mix. ratio Temperature backscatter ratio
mean H2O profile
05 August 30 28 26 24 22 20 18 16 14 Heigh t, km
2 3backscatter ratio4567 8 910 2 3 4567 8 9100 2 3 4 5 678910 2 3
H2O mix. ratio, ppmv
-80 Temperature, -70 -60 -50
0 C
H2O mix. ratio Saturation mix. ratio Temperature backscatter ratio
mean H2O profile
14 August 30
28 26 24 22 20 18 16 14 Heigh t, km
2 3backscatter ratio4567 8 910 2 3 4567 8 9100 2 3 4 5 6 78910 2 3
H2O mix. ratio, ppmv
-80 Temperature, -70 -60 -50
0 C H2O mix. ratio Saturation mix. ratio Temperature backscatter ratio
mean H2O profile
21 August 30 28 26 24 22 20 18 16 14 H e ig ht, km
2 3 4 5 678910 2 3
H2O mix. ratio, ppmv
-80 -70 -60 -50
Temperature, 0
C
2 3 4567 8 910 2 3 4567 8 9100 backscatter ratio
H2O mix. ratio Saturation mix. ratio Temperature backscatter ratio
mean H2O profile
07 August 30
28 26 24 22 20 18 16 14 Heigh t, km
2 3backscatter ratio4567 8 910 2 3 4567 8 9100 2H2O mix. ratio, ppmv3 4 5 6 78910 2 3
-80 -70 -60 -50
Temperature, 0
C H2O mix. ratio Saturation mix. ratio Temperature backscatter ratio
mean H2O profile
23 August
Fig. 1. Results of the six soundings carried out from Niamey in August 2006. Water vapour
ACPD
8, 15463–15490, 2008Hydration of the lower stratosphere by
ice crystal geysers
S. Khaykin et al.
Title Page
Abstract Introduction
Conclusions References
Tables Figures
◭ ◮
◭ ◮
Back Close
Full Screen / Esc
Printer-friendly Version
Interactive Discussion 355
365 390 420 450 480 520 560 600 640 680 720 760 800
Potenti
a
l tem
per
atur
e, K
10 9 8 7 6 5 4 3 2
water vapour mixing ratio, ppmv 30
29
28
27
26
25
24
23
22
21
20
19
18
17
16
15
Height, km
4 3
2 1
0
standard deviation, ppmv
Fig. 2. Mean water vapour profile calculated from the six soundings (blue, bottom axis) and
ACPD
8, 15463–15490, 2008Hydration of the lower stratosphere by
ice crystal geysers
S. Khaykin et al.
Title Page
Abstract Introduction
Conclusions References
Tables Figures
◭ ◮
◭ ◮
Back Close
Full Screen / Esc
Printer-friendly Version
Interactive Discussion
20
19
18
17
16
15
14
13
12
11
10
9
8
7
6
5
la
titu
de, deg.
24 22 20 18 16 14 12 10 8 6 4 2 0
longitude, deg.
Niamey
375 K 385 K 395 K 400 K 405 K 415 K 425 K 435 K 445 K
Meteosat IR brightness temperature orange= -65 C
04 Aug
1400 UT, 30 hours prior to observation
Fig. 3. 30-h backward trajectories ending between 375 and 445 K at the sounding location at
20:00 UT on 5 August superimposed on the MSG 10.8µm brightness temperature image at
ACPD
8, 15463–15490, 2008Hydration of the lower stratosphere by
ice crystal geysers
S. Khaykin et al.
Title Page
Abstract Introduction
Conclusions References
Tables Figures
◭ ◮
◭ ◮
Back Close
Full Screen / Esc
Printer-friendly Version
Interactive Discussion 23
22
21
20
19
18
17
16
15
H
e
ight,
km
-80 -70 -60 -50
Temperature, 0 C
60 40 20 0
time since overshoot, h
8 7 6 5 4 3 2
H2O mixing ratio, ppmv
-360 -365 -370 -380 -400 -420 -440 -460 -490 -500 -520 -550
Po
ten
tial temper
a
ture, K
H2O mixing ratio
Temperature overshoot signature
Fig. 4. Water vapour (solid red, bottom axis) and temperature (dotted black, top axis) profiles
ACPD
8, 15463–15490, 2008Hydration of the lower stratosphere by
ice crystal geysers
S. Khaykin et al.
Title Page
Abstract Introduction
Conclusions References
Tables Figures
◭ ◮
◭ ◮
Back Close
Full Screen / Esc
Printer-friendly Version
Interactive Discussion 26
25
24
23
22
21
20
19
18
17
16
15
14
13
Heig
ht,
km
1 2 3 4 5 6 7 8 910 2 3
H2O mix. ratio, ppmv
-80 -70 -60 -50
Temperature, 0 C
2 3 4 5 6 7 8 910 2 3 4 5 6 7 8 9100
backscatter ratio
4 6 80.1 2 4 6 81 2 4 6
O3 mix. ratio, ppmv
350 365 390 420 450 480 520 560 600 640
Po
te
ntia
l tempe
rat
ur
e
,
K
H2O mix. ratio
Saturation mix. ratio Temperature Backscatter ratio O3 mix. ratio
Fig. 5. Vertical profiles of water vapour mixing ratio during descent (solid red), RS-92 descent
ACPD
8, 15463–15490, 2008Hydration of the lower stratosphere by
ice crystal geysers
S. Khaykin et al.
Title Page
Abstract Introduction
Conclusions References
Tables Figures
◭ ◮
◭ ◮
Back Close
Full Screen / Esc
Printer-friendly Version
Interactive Discussion
Fig. 6. MIT C-band radar cloud top heights at 16:51 UT on 23 August, two hours before the
sounding from Niamey: (a) (large plot) geographical distribution of cloud tops within 150 km
range colour coded by the cloud top altitude (colour code on top right scaled from 2 km in light
blue to>16 km in magenta with 1 km step); (b)(small plot) altitude-distance cross-section of