www.atmos-meas-tech.net/9/3547/2016/ doi:10.5194/amt-9-3547-2016
© Author(s) 2016. CC Attribution 3.0 License.
Validation of Aura MLS retrievals of temperature, water vapour
and ozone in the upper troposphere and lower–middle stratosphere
over the Tibetan Plateau during boreal summer
Xiaolu Yan1,a,b, Jonathon S. Wright2, Xiangdong Zheng1, Nathaniel J. Livesey3, Holger Vömel4, and Xiuji Zhou1
1Chinese Academy of Meteorological Sciences, Beijing, China 2Center for Earth System Science, Tsinghua University, Beijing, China
3Jet Propulsion Laboratory, California Institute of Technology, Pasadena, California, USA
4Earth Observing Laboratory, National Center for Atmospheric Research, Boulder, Colorado, USA
anow at: Key Laboratory of Middle Atmosphere and Global Environment Observation (LAGEO), Institute of Atmospheric
Physics, Chinese Academy of Sciences, Beijing, China
bnow at: Institute for Energy and Climate Research: Stratosphere (IEK-7), Forschungszentrum Jülich, Jülich, Germany
Correspondence to:Jonathon S. Wright ([email protected]) and Xiangdong Zheng ([email protected])
Received: 19 December 2015 – Published in Atmos. Meas. Tech. Discuss.: 18 January 2016 Revised: 29 June 2016 – Accepted: 21 June 2016 – Published: 3 August 2016
Abstract. We validate Aura Microwave Limb Sounder (MLS) version 3 (v3) and version 4 (v4) retrievals of sum-mertime temperature, water vapour and ozone in the up-per troposphere and lower–middle stratosphere (UTLS; 10– 316 hPa) against balloon soundings collected during the Study of Ozone, Aerosols and Radiation over the Tibetan Plateau (SOAR-TP). Mean v3 and v4 profiles of tempera-ture, water vapour and ozone in this region during the mea-surement campaigns are almost identical through most of the stratosphere (10–68 hPa), but differ in several respects in the upper troposphere and tropopause layer. Differences in v4 relative to v3 include slightly colder mean temperatures from 100 to 316 hPa, smaller mean water vapour mixing ratios in the upper troposphere (215–316 hPa) and a more vertically homogeneous profile of mean ozone mixing ratios below the climatological tropopause (100–316 hPa). These changes substantially improve agreement between ozonesondes and MLS ozone retrievals in the upper troposphere, but slightly worsen existing cold and dry biases at these levels.
Aura MLS temperature profiles contain significant cold bi-ases relative to collocated temperature measurements in sev-eral layers of the lower–middle stratosphere and in the upper troposphere. MLS retrievals of water vapour volume mixing ratio generally compare well with collocated measurements, excepting a substantial dry bias (−32±11 % in v4) that
ex-tends through most of the upper troposphere (121–261 hPa). MLS retrievals of ozone volume mixing ratio are biased high relative to collocated ozonesondes in the stratosphere (18– 83 hPa), but are biased low at 100 hPa. The largest relative biases in ozone retrievals (approximately+70 %) are located at 83 hPa. MLS v4 offers substantial benefits relative to v3, particularly with respect to water vapour and ozone. Key im-provements include larger data yields, reduced noise in the upper troposphere and smaller fluctuations in the bias profile at pressures larger than 100 hPa. The situation for temper-ature is less clear, with cold biases and noise levels in the upper troposphere, both larger in v4 than in v3. Several as-pects of our results differ from those of validations conducted in other locations. These differences are often amplified by monsoon onset, indicating that the Asian monsoon anticy-clone poses unique challenges for remote sensing that impact the quality of MLS retrievals in this region.
1 Introduction
change (Soden et al., 2008; Solomon et al., 2010; Dessler et al., 2013). Accurate observations of these variables at UTLS altitudes are difficult to obtain. Instruments mounted on balloonsondes and aircraft can be used to collect mea-surements with high resolution along specific flight tracks, but suffer from limited spatial and temporal coverage. Re-analyses and other data assimilation systems provide global coverage at frequent intervals, but are heavily influenced by the underlying numerical model and often do not assimilate observations of ozone or stratospheric water vapour. Satellite observations occupy something of a middle ground between them, with improved spatial and temporal coverage relative to sonde and aircraft measurements (at the expense of spatio-temporal resolution) and improved fidelity to the state of the atmosphere relative to reanalyses (at the expense of simulta-neous global coverage).
Satellite retrievals are based on the mathematical process-ing and physical interpretation of observed atmospheric radi-ances, with errors and uncertainties that reflect imperfections in the design of the instrument used to conduct the obser-vations and the algorithm used to process the obserobser-vations. These errors can be globally systematic or vary with season and region, so that the evaluation and validation of satellite retrievals requires a geographically and temporally diverse set of independent validation measurements from a variety of observational and semi-observational platforms.
The Microwave Limb Sounder (MLS) instrument on board the Aura satellite has provided near-continuous sun-synchronous observations of temperature, water vapour and ozone in the upper troposphere, stratosphere and lower meso-sphere since August 2004 (Waters et al., 2006). Four versions of MLS data have been released to the public to date. The initial production version, version 1.5 (v1.5), was replaced by version 2.2/2.3 (v2) in 2007 and version 3.3/3.4 (v3) in 2010. The most recent production version, version 4.2 (v4), replaced v3 in February 2015.
The boreal summertime UTLS over the Tibetan Plateau is dominated by the Asian monsoon anticyclone. The com-position and thermodynamic structure of this region differ substantially from other regions at this latitude and repre-sent a mix of tropical and midlatitude characteristics (Park et al., 2007). The Tibetan Plateau region has been variously described as “the world’s water tower” (Xu et al., 2008) and an “ozone valley” (Zhou et al., 1995; Tobo et al., 2008), and the Asian monsoon anticyclone has been identified as a key pathway for the transport of water vapour and pollu-tants across the tropopause and into the global stratosphere (Fu et al., 2006; Randel et al., 2010; Wright et al., 2011; Ploeger et al., 2013). Biases in Aura MLS are well charac-terized globally, with multiple validation analyses of temper-ature (Froidevaux et al., 2006; Schwartz et al., 2008), water vapour (Read et al., 2007; Lambert et al., 2007; Vömel et al., 2007a; Berthet et al., 2013; Hegglin et al., 2013; Hurst et al., 2014) and ozone (Jiang et al., 2007; Livesey et al., 2008; Tegtmeier et al., 2013) against radiosonde and ozonesonde
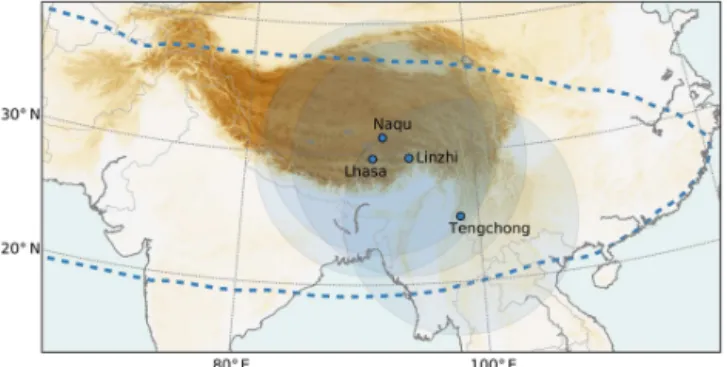
Figure 1.Locations of the radiosonde launch sites. The circular shaded areas cover a 1000 km radius from each site. The dashed contour corresponds to the 16 770 gpm contour of 100 hPa geopo-tential height from the ERA-Interim reanalysis, averaged over July and August 1979–2014. The shading indicates topography, with darker colours corresponding to higher surface altitudes.
networks, frost point hygrometers, ground-based lidars, air-craft data and other satellite retrievals. However, despite ex-tensive use and analysis of MLS retrievals in the vicinity of the Asian monsoon anticyclone (e.g. Park et al., 2007; Uma et al., 2014), few previous studies have conducted focused validations of MLS observations in this region (with the no-table exception of Yan et al., 2015, which is discussed further below). Moreover, few of the field observations used to eval-uate MLS retrievals in global validation studies have been collected in the vicinity of the Asian monsoon anticyclone. Characterization of biases in this region therefore relies on global and zonal mean comparisons with other satellite data sets.
Here, we present a validation of the third (v3) and fourth (v4) public releases of Aura MLS retrievals over the south-eastern Tibetan Plateau and adjacent regions during boreal summer using balloon soundings collected at four sites over 4 different years (Fig. 1 and Table 1) during the Study of Ozone, Aerosols and Radiation over the Tibetan Plateau (SOAR-TP). The results provide a detailed evaluation of MLS retrievals of temperature, water vapour and ozone in the vicinity of the Asian monsoon anticyclone. We describe the in situ data, key differences between v3 and v4 and the validation methodology in Sect. 2. We then present the re-sults of the validation in Sect. 3 and discuss these rere-sults in the context of previous validation studies, related variables and differences between v3 and v4 in Sect. 4. We conclude with a summary of key findings in Sect. 5.
2 Data and methodology 2.1 Sonde measurements
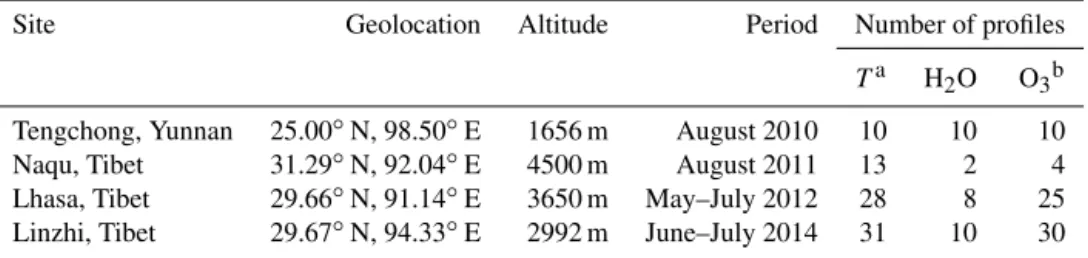
Table 1.Radiosonde site information for data used in this validation. The rightmost column lists the number of profiles for which a collocated Aura MLS profile was identified (see Sect. 2.3).
Site Geolocation Altitude Period Number of profiles
Ta H2O O3b
Tengchong, Yunnan 25.00◦N, 98.50◦E 1656 m August 2010 10 10 10
Naqu, Tibet 31.29◦N, 92.04◦E 4500 m August 2011 13 2 4
Lhasa, Tibet 29.66◦N, 91.14◦E 3650 m May–July 2012 28 8 25
Linzhi, Tibet 29.67◦N, 94.33◦E 2992 m June–July 2014 31 10 30
aListed quantities are temperature profiles collected using Vaisala RS80 and RS92 instruments. Eighteen temperature profiles
were also collected using InterMet (IMet) instruments at Lhasa (7) and Linzhi (11).bTwo O3profiles collected at Tengchong
(17 and 22 August 2010) could not be matched to v3 MLS ozone retrievals that meet the quality control and collocation criteria. Both profiles were successfully matched to v4 MLS retrievals and included in the validation of v4 ozone.
Naqu, Tibet (August 2011); Lhasa, Tibet (May–July 2012) and Linzhi, Tibet (June–July 2014). Table 1 lists geoloca-tion informageoloca-tion for each of these sites and the numbers of temperature, water vapour and ozone profiles from each site used in the validation analysis. Temperature measurements were collected using Vaisala RS80 (Tengchong and Naqu) and RS92 (Naqu, Lhasa and Linzhi) radiosondes. Profiles of water vapour mixing ratio were collected using cryogenic frost point hygrometer (CFH) instruments attached to RS80 (Tengchong and Naqu) and InterMet (Lhasa and Linzhi) ra-diosondes, as the RS92 radiosonde does not permit the at-tachment of a CFH. The InterMet radiosondes released at Lhasa and Linzhi were launched together with RS92 ra-diosondes and are therefore directly comparable. Ozone mea-surements were collected using electrochemical concentra-tion cell (ECC) instruments. Profiles of temperature, water vapour and ozone were obtained up to the burst point of each balloon, which typically occurred at altitudes greater than 30 km and pressures as low as 5 to 10 hPa. Launch times var-ied, but were predominantly during the early afternoon local time at Tengchong, Naqu and Lhasa and were predominantly around midnight local time at Linzhi.
The CFH is a microprocessor and chilled mirror instru-ment capable of measuring a large range of water vapour con-centrations from the surface to approximately 28 km altitude (Vömel et al., 2007b). Cryogenic fluid is used to maintain the mirror at the frost point temperature, which is then converted to water vapour mixing ratio using the approximation to the Clausius–Clapeyron relation proposed by Goff and Gratch (1946). The uncertainty in CFH measurements is less than 10 % in the upper troposphere and stratosphere.
ECC ozonesondes observe ozone mixing ratios by mea-suring electrical currents produced by reactions of O3 and
potassium iodide (KI) in separate cathode and anode cham-bers. These electrical currents are directly proportional to the amount of ozone in the air which is pumped into the instru-ment. The minimum detection limit is approximately 2 ppbv, considerably less than the typical background value for clean tropospheric air (30 ppbv). ECC measurements are typically
accurate to within 10 % in the troposphere and 5 % in the stratosphere up to 10 hPa (Smit et al., 2007).
During flight, the CFH and ECC data streams were trans-mitted to receiving equipment on the ground through inter-faces for the RS80 (Tengchong and Naqu), InterMet (Lhasa and Linzhi) and RS92 (Naqu, Lhasa and Linzhi; ECC only) radiosondes. These data were stored together with profiles of pressure, temperature and other variables observed by the ra-diosonde instrument. The payloads weighed approximately 1 kg and were flown using 1600 g latex balloons filled with hydrogen. Although only ascending data are analysed here, each balloon was equipped with a parachute to enable the po-tential use of data collected during descent and recovery of the instrument package.
2.2 Aura MLS temperature, water vapour and ozone retrievals
Versions 3 and 4 of the MLS retrieval algorithm have been used to process the third and fourth public releases of MLS data respectively (henceforth referred to as v3 and v4). Both versions of the data consist of profiles reported on 12 pres-sure levels per decade between 1000 and 1 hPa, 6 prespres-sure levels per decade between 1 and 0.1 hPa, and 3 pressure lev-els per decade between 0.1 and 0.01 hPa. The MLS mea-surement system uses optimal estimation theory (Rodgers, 2000) to retrieve an atmospheric state vector (Livesey et al., 2013, 2015). Temperature profiles are retrieved using radi-ances near the O2spectral bands at 118 GHz (for the
190 200 210 220 230 240 250 Temperature [K]
316 261 215 178 147 121 10083 68 56 46 38 32 26 22 18 15 12 10
Pressure [hPa]
MLS v3 MLS v4
(a) Temperature
4 2 0 2 4
Difference [K]
100 101 102 103
Water vapour volume mixing ratio [ppmv] 316
261 215 178 147 121 10083 68 56 46 38 32 26 22 18 15 12 10
Pressure [hPa]
(b) Water vapour
40 20 0 20 40
Relative difference [%]
101 102 103 104
Ozone volume mixing ratio [ppbv] 316
261 215 178 147 121 10083 68 56 46 38 32 26 22 18 15 12 10
Pressure [hPa]
(c) Ozone
40 20 0 20 40
Relative difference [%]
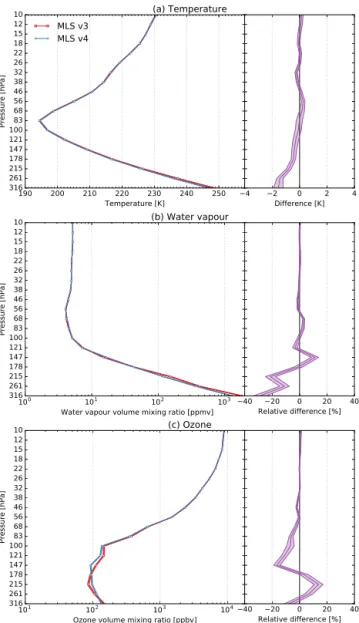
Figure 2.Mean profiles of(a)temperature,(b)water vapour vol-ume mixing ratio and (c)ozone volume mixing ratio from MLS v3 and MLS v4 within one or more of the circular shaded areas outlined in Fig. 1 during the months corresponding to the four mea-surement campaigns (August 2010, August 2011, May–July 2012 and June–July 2014). Differences (v4 minus v3) are shown on the right. Relative differences in water vapour and ozone are calculated relative to v3 mixing ratios. Uncertainty bounds represent combined measurement (estimated retrieval precision) and statistical (twice the standard error of the mean) uncertainties.
at the 19 standard MLS pressure levels between 316 and 10 hPa (see Fig. 2). Although MLS retrievals of temperature and ozone at pressures greater than 261 hPa are currently not recommended for use in scientific studies, we evaluate and briefly discuss the performance of retrievals of both variables at 316 hPa.
Uncertainties in MLS measurements are estimated by combining the precisions of the radiance observations with uncertainties in the a priori estimates as described by
Rodgers (1976). These uncertainty estimates represent the diagonal elements of the solution covariance matrix and are provided for each profile in the MLS Level 2 data files. Pos-itive values of precision in MLS products indicate that re-trievals depend mainly on observed radiances rather than a priori estimates (precisions are explicitly set to negative by the software to flag retrievals that are significantly affected by their a priori estimates). The root mean square (rms) preci-sion of individual MLS temperature profiles over this region (see domain outlined in Fig. 1) during the four measurement campaigns was 0.5–1.3 K in v3 and 0.5–1.0 K in v4 for the 19 pressure levels included in this validation. The corresponding rms precision of individual water vapour volume mixing ratio profiles was 4–39 % in v3 and 4–8 % in v4, and the rms pre-cision of individual ozone volume mixing ratio profiles be-tween 10 and 261 hPa was 1–124 % in v3 (100 % at 316 hPa) and 1–28 % in v4 (490 % at 316 hPa). In most cases, MLS precisions at a given level are fairly constant in mixing ratio space. Fractional precisions will therefore vary substantially for species with large fluctuations in the horizontal or time dimensions (including water vapour and ozone in the upper troposphere).
Figure 2 shows mean profiles of temperature, water vapour and ozone from v3 and v4 within 1000 km of one or more of the launch sites (circular shaded areas in Fig. 1). Differences in mean profiles of temperature, water vapour and ozone based on these two versions of MLS data are small, par-ticularly at stratospheric pressure levels (10–68 hPa). Mean temperatures in the upper troposphere (121–261 hPa) are colder in v4 than in v3 by 0.28–1.43 K (all differences are significant when both measurement and statistical uncer-tainty are accounted for). The mean v4 temperature profile is also colder than v3 at 31–38 hPa (by approximately 0.2 K) and warmer than v3 at 56 hPa (0.27±0.13 K) and 10 hPa (0.15±0.11 K). Mean water vapour mixing ratios in the up-per troposphere (215–316 hPa) are smaller in v4 than in v3 (with a maximum relative bias of−29±5 % at 316 hPa),
but slightly larger in v4 than in v3 at 147 hPa (11±3 %).
Differences in the remainder of the profile are within±3 %.
The most significant change in ozone is a reduction in verti-cal gradients in the upper troposphere and lower tropopause layer (100–316 hPa) in v4 relative to v3. This vertical ho-mogenization results in better qualitative agreement with the vertical structure of mean ozonesonde profiles from inde-pendent observations over Lhasa and Kunming during boreal summer (Bian et al., 2012) and includes statistically signifi-cant decreases of 6–17 % in mean ozone mixing ratios in the tropopause layer (83–147 hPa) and statistically significant in-creases of 4–14 % in the upper troposphere (178–261 hPa).
pri-marily reflect changes in the MLS quality screening crite-ria, which have been updated to account for changes in the way that clouds are handled during the retrieval step. One of the primary goals of MLS v4 was to improve the be-haviour of MLS upper tropospheric composition retrievals in the presence of clouds. This was accomplished by redefining the manner in which clouds were represented in the MLS forward model and redesigning the method by which the strongest cloud signals in the MLS radiances are flagged and excluded from the retrievals. These changes significantly re-duce the sensitivity of the MLS composition observations to cloud scattering signals. Relative differences between v3 and v4 are effectively unchanged when the comparison is limited to retrievals that meet quality control criteria in both v3 and v4.
2.3 Validation methodology
Differences between sonde measurements and MLS re-trievals can arise from several factors, including differences in vertical resolution or interpolation techniques, measure-ment errors in the sonde and MLS profiles, spatio-temporal inhomogeneities due to synoptic variability and smoothing associated with the horizontal extent of the MLS footprint. The estimated response time of the CFH and ECC instru-ments are both of the order of 10 s to 1 min. At typical as-cent rates of 5–7 m s−1, this corresponds to a vertical resolu-tion of 50–400 m. By contrast, the vertical resoluresolu-tion of MLS profiles is of the order of a few kilometres (3.6–5.0 km for temperature, 2.0–3.7 km for water vapour and∼2.5 km for
ozone). The radiosonde profiles must therefore be resampled to match the lower vertical resolution of the MLS profiles. Here, we resample the radiosonde profiles of temperature, water vapour and ozone by applying the MLS forward model smoothing operator and appropriate averaging kernels (Read et al., 2006; Livesey et al., 2013, 2015). This approach to resampling the sonde profiles at MLS resolution differs no-tably from the linear interpolation method used by Yan et al. (2015).
First, the resolution of the observed in situ profile is de-graded to the resolution of the MLS product using the equa-tion
Xs=XsηT ηηT
−1
, (1)
where Xs is the sonde profile at its original resolution,
ηT ηηT−1
is the forward model smoothing operator (with
ηdependent on the sonde and MLS pressure profiles as de-scribed by Read et al., 2006) andXsis the sonde profile
sam-pled at MLS resolution. The reduced-resolution sonde profile is then convolved with the averaging kernel using the equa-tion
ˆ
Xs=Xap+Xs−XapA, (2)
whereXapis the a priori profile for collocated retrieval and
Ais the averaging kernel. The resulting profileXˆs is
appro-priate for direct comparison with the collocated MLS profile. Forward smoothing and convolution of water vapour profiles are done using the logarithm of water vapour volume mixing ratio as recommended by Read et al. (2007), while forward smoothing and convolution of temperature and ozone pro-files are done using temperature and ozone volume mixing ratio directly (see also Livesey et al., 2015, and references therein). MLS averaging kernels differ by variable and data version. Sonde profiles are convolved with v3 averaging nels for validating v3 retrievals and with v4 averaging ker-nels for validating v4 retrievals. The comparisons presented below use the standard publicly released averaging kernels, which are derived for the equator. The results are effectively unchanged when these are replaced with averaging kernels derived specifically for the Asian monsoon region.
Appropriate collocation criteria for MLS validation may vary by region, season or variable of interest and should be evaluated independently for each validation campaign. Vömel et al. (2007a) used CFH measurements to validate Aura MLS version 1 and 2 observations of water vapour and found that their results were largely insensitive to the choice of distance thresholds up to 900 km and time difference thresholds up to 12 h. We begin by choosing the geographi-cally closest MLS retrievals of temperature, water vapour and ozone within±6 h of balloon launch that satisfy the quality control criteria outlined in Sect. 2.2. If any of these retrievals are within 1000 km of the launch site, then we choose the geographically closest retrieval for comparison. If not, then we extend the time window to±12 h and repeat the process.
This two-step selection process allows us to preferentially se-lect retrievals from orbits that are close in time to the in situ measurements, limiting spurious effects caused by sampling different parts of the diurnal cycle (although sensitivity anal-ysis indicates that these effects are small) while maximizing the validation sample size. Our conclusions are qualitatively robust to reasonable changes in these criteria: sensitivity to choices of smaller distance or time thresholds is mainly lim-ited to data yields, with no major changes in bias statistics. Application of the combined collocation and quality control criteria eliminates only two ozone profiles from the analysis, and those two profiles are eliminated only from the v3 valida-tion (both profiles are successfully matched to valid v4 ozone retrievals). The vast majority of profiles are matched within
±6 h (76–85 %, depending on the variable and data version),
with a mean time difference for all matched profiles of ap-proximately 3.5 h. Distances between the launch site and the nominal centre of the matched MLS footprint range from 37 to 983 km, with a mean of approximately 500 km.
vari-190 200 210 220 230 240 250 Temperature [K]
316 261 215 178 147 121 10083 68 56 46 38 32 26 22 18 15 12 10
Pressure [hPa]
Lhasa, Tibet (91.14° E, 29.66° N) 06:47:52 UTC 18 May 2012 Aura MLS (93.64° E, 29.66° N) 07:11:29 UTC 18 May 2012
Distance: 242.4 km
(a)
RS92
RS92 (v3 averaging kernels) RS92 (v4 averaging kernels) MLS v3
MLS v4
10 5 0 5 10
Temperature bias [K] (b)
Figure 3. (a)RS92 and MLS v3 and v4 temperature profiles mea-sured at Lhasa, Tibet on 18 May 2012. The satellite overpass was offset from the launch site by 242 km (0◦latitude, 2.5◦longitude). The balloon was launched 24 min prior to the overpass and reached 191 hPa at the time of the overpass.(b)Absolute biases (in K) be-tween the MLS v3/v4 profiles and the sonde profile interpolated to MLS pressure levels using the v3/v4 MLS forward functions and averaging kernels. Error bars represent the MLS measurement un-certainty.
ations of 2–3 orders of magnitude in typical concentrations of these species within the upper troposphere and lower–middle stratosphere and facilitates comparison with previous valida-tion studies. We include a brief summary of absolute ozone biases for context, as many of the sources of error for MLS ozone retrievals act on absolute mixing ratios rather than rel-ative mixing ratios.
Relative differences are defined with respect to the sonde measurement and are calculated using the equation
δ(p)=XM(p)− ˆXs(p) ˆ
Xs(p)
, (3)
whereXM(p)is the MLS retrieval at a given pressure level
andXˆs(p)is the sonde measurement convolved to that level
using Eqs. (1)–(2). We report three bias statistics at each level for each variable: the arithmetic mean bias, the median bias and the root mean square (rms) bias. The range of bi-ases at each level is indicated by twice the standard error of the mean bias (an approximate 95 % confidence interval around the mean) and the interquartile range (which spans the middle 50 % of biases at each level). For water vapour and ozone, non-robust statistical measures (mean, standard error and rms) are calculated using absolute differences and then normalized by the mean of the convolved sonde obser-vations at each level.
3 Results 3.1 Temperature
Figure 3 shows temperature profiles and biases based on RS92 radiosonde measurements and MLS v3 and v4 re-trievals collected near Lhasa on 18 May 2012. The balloon was launched 24 min prior to the MLS retrieval and had reached 191 hPa at the time of the MLS overpass. The cen-tre of the MLS footprint was located 242 km due east of the radiosonde launch site. Application of the forward smooth-ing function and the v3 or v4 averagsmooth-ing kernel eliminates much of the fine structure in the radiosonde profile, but the resulting low-resolution profiles are consistent with the verti-cal structure of the in situ measurements at kilometre sverti-cales. Both v3 and v4 MLS retrievals are colder than the RS92 mea-surements in the middle stratosphere (10–32 hPa) and in the lower stratosphere and tropopause layer (56–100 hPa), while the v4 retrieval is substantially colder than both RS92 mea-surements and the MLS v3 retrieval in the upper troposphere (215–316 hPa). Differences between v3 biases and v4 biases are due in part to differences in the MLS retrievals and in part to differences in the RS92 profile convolved to MLS pres-sure levels. Both of these factors potentially reflect changes in the averaging kernel and the a priori profile (see Sect. 2.3), while the former also reflects changes in how the retrieval algorithm processes the observed radiances. The following discussion is based on a statistical analysis of 82 profiles, in-cluding the profile shown in Fig. 3.
Figure 4 shows mean, median and rms biases for MLS v3 and v4 temperature retrievals relative to RS80/RS92 temper-ature measurements. Bias statistics at each level are based on the subset of radiosondes that reach that level, with sam-ple sizes that range from 43 measurements at 10 hPa to 82 measurements at 316 hPa. Mean and median temperature bi-ases agree well at most levels, although cold bibi-ases near the tropopause (68–83 hPa) are slightly larger in the median than in the mean. Both v3 and v4 agree well with the sonde profiles in the same portions of the profile, with layers of near-zero mean biases at 18, 46 and 100–121 hPa alternating with layers of cold biases centred at 10–12 hPa (−1.5±0.5 K in v3;−1.3±0.5 K in v4), 26–32 hPa (−1.5±0.3 K in v3;
−1.7±0.3 K in v4), 68–83 hPa (−1.8±0.4 K in both v3 and v4) and 147–261 hPa (−2.3±0.3 K in v3;−2.6±0.4 K in v4). Vertical oscillations in the bias profile are a well-known feature of previous versions of MLS temperature retrievals (Schwartz et al., 2008), although their underlying causes are still not well understood (Livesey et al., 2013).
10 8 6 4 2 0 2 4 6 8 10 Temperature bias [K]
316 261 215 178 147 121 10083 68 56 46 38 32 26 22 18 15 12 10
Pressure [hPa]
(a) MLS v3
Observed biases Mean bias Median bias RMS bias
10 8 6 4 2 0 2 4 6 8 10
Temperature bias [K] 316
261 215 178 147 121 10083 68 56 46 38 32 26 22 18 15 12 10
Pressure [hPa]
(b) MLS v4
Observed biases Mean bias Median bias RMS bias (v4) RMS bias (v3)
Figure 4.Mean, median and root mean square biases for(a)MLS v3 and(b)MLS v4 temperature profiles relative to RS80 and RS92 temperature profiles interpolated to MLS pressure levels using the respective MLS forward function and averaging kernel. Uncertainty bounds on the mean bias (blue shaded envelope bounded by thin blue lines) represent twice the standard error of the mean, while error bars on the median bias (red error bars) indicate the interquartile range (IQR). Results for individual profiles are shown as grey points.
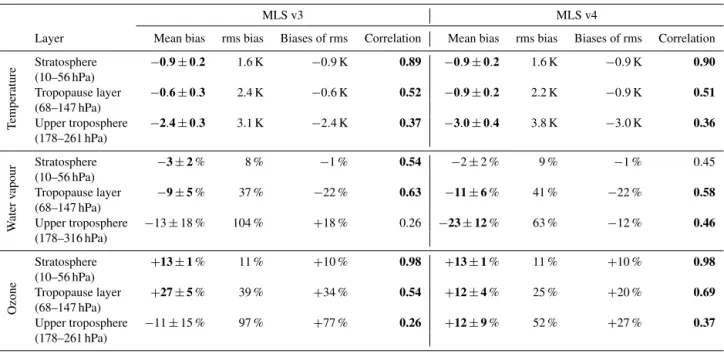
Table 2.Statistical summary of the validation results for MLS v3 (left) and v4 (right) for three atmospheric layers. Layer averages are pressure weighted. The biases of the rms are calculated as the rms MLS value minus the rms sonde value (normalized by the rms sonde value for water vapour and ozone). Correlations are Pearson’sr, tested at the 95 % confidence level using Student’sttest.
MLS v3 MLS v4
Layer Mean bias rms bias Biases of rms Correlation Mean bias rms bias Biases of rms Correlation
T
emperature
Stratosphere −0.9±0.2 1.6 K −0.9 K 0.89 −0.9±0.2 1.6 K −0.9 K 0.90 (10–56 hPa)
Tropopause layer −0.6±0.3 2.4 K −0.6 K 0.52 −0.9±0.2 2.2 K −0.9 K 0.51 (68–147 hPa)
Upper troposphere −2.4±0.3 3.1 K −2.4 K 0.37 −3.0±0.4 3.8 K −3.0 K 0.36 (178–261 hPa)
W
ater
v
apour
Stratosphere −3±2% 8 % −1 % 0.54 −2±2 % 9 % −1 % 0.45
(10–56 hPa)
Tropopause layer −9±5% 37 % −22 % 0.63 −11±6% 41 % −22 % 0.58
(68–147 hPa)
Upper troposphere −13±18 % 104 % +18 % 0.26 −23±12% 63 % −12 % 0.46
(178–316 hPa)
Ozone
Stratosphere +13±1% 11 % +10 % 0.98 +13±1% 11 % +10 % 0.98
(10–56 hPa)
Tropopause layer +27±5% 39 % +34 % 0.54 +12±4% 25 % +20 % 0.69
(68–147 hPa)
Upper troposphere −11±15 % 97 % +77 % 0.26 +12±9% 52 % +27 % 0.37
(178–261 hPa)
either v3 or v4. Pressure-weighted mean and rms temperature biases in the stratospheric layer are effectively unchanged be-tween v3 and v4. The magnitude of the pressure-weighted mean temperature bias in the tropopause layer has increased slightly from v3 to v4, despite a slight reduction in the rms bias in this layer. The magnitude of the pressure-weighted mean temperature bias in the upper troposphere has also in-creased slightly; however, unlike the tropopause layer, this increase in mean bias is not balanced by a decrease in the rms bias, which is 0.7 K larger in v4 than in v3. This increase
in rms biases (and the similar increase in IQR) indicates in-creased noise in upper tropospheric temperature retrievals in v4 relative to v3. Biases between the rms MLS and sonde temperatures are the same as the mean biases for all three layers, within uncertainties.
0.0 0.1 0.2
0.3 0.4
0.5
0.6
0.7
0.8
0.9
0.95 Correlation
0 1 2
Normalized standard deviation
0 1 2
0.0 0.1 0.2
0.3 0.4
0.5
0.6
0.7
0.8
0.9
0.95 Correlation
0 1 2
0 1 2
1.500 2.500
0.500 1.000
2.000
UT TL
SS UT
TL
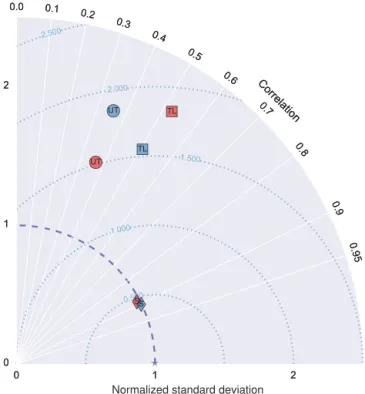
Figure 5.Modified Taylor diagram summarizing the performance of MLS v3 (red) and v4 (blue) retrievals relative to sonde mea-surements in three atmospheric layers: the upper troposphere (UT; circles; 178–261 hPa), tropopause layer (TL; squares; 68–147 hPa) and the stratosphere (S; diamonds; 10–56 hPa). Layer averages are pressure weighted, as in the text. Blue dotted lines mark isolines of root mean square error (RMSE) relative to the corresponding sonde measurements (purple star).
of radiosonde profiles. Figure 6 shows mean and rms temper-ature biases relative to collocated IMet and RS92 radioson-des, with sample sizes ranging from 10 samples (10–12 hPa) to 17 samples (32–316 hPa). The two bias estimates are qual-itatively identical; the only notable difference is that the mag-nitudes of mean and rms biases relative to IMet are slightly larger than the magnitudes of mean and rms biases relative to RS92 in the tropopause layer (68–100 hPa) for both v3 and v4 (note that this difference is consistent with the ∼0.5 K magnitude of previously reported biases between IMet and RS92 temperature measurements over California, but is op-posite in sign and less persistent in altitude; Hurst et al., 2011). The overall agreement between bias estimates relative to IMet and bias estimates relative to RS92 indicates that the temperature validation presented here is robust to the choice of radiosonde instrumentation.
3.2 Water vapour
Figure 7 shows profiles of water vapour volume mixing ra-tio from 18 May 2012 based on CFH measurements and MLS v3 and v4 retrievals collected near Lhasa on 18 May 2012. These water vapour profiles correspond to the
temper-ature profiles shown in Fig. 3. Application of the forward smoothing function and averaging kernel again eliminate the fine-scale structure in the CFH profile. The resulting low-resolution profiles are consistent with the kilometre-scale vertical structure of the CFH profile in the stratosphere (18– 83 hPa), but are unable to accurately capture several deep layers of relatively dry and moist air below the tropopause (100–261 hPa). Biases in MLS v3 and v4 are small (within approximately ±20 %) between 18 and 100 hPa. The large
moist bias (70–80 %) centred at 147 hPa may reflect weather-related horizontal gradients in water vapour in the upper tro-posphere and tropopause layer, which may be associated with horizontal variations in convective activity (current or pre-vious) or radiatively driven ascent. This spatial variability should average out at larger sample sizes, but its impact will still be reflected in the spread around the mean and median biases at these levels. We discuss this topic in more detail in Sect. 4. The large dry biases at 261 and 316 hPa reflect the impact of a sharp increase in the CFH water vapour measure-ments at approximately 320 hPa (not shown) on the values convolved to these two levels using Eqs. (1) and (2).
Figure 8 shows mean, median and rms biases for MLS v3 and v4 retrievals of water vapour volume mixing ratio rela-tive to CFH measurements. The number of samples used to calculate these statistics varies from two samples at 18 hPa to 30 samples at 121–316 hPa. The number of samples is 10 or larger from 32 to 316 hPa. Mean biases are within±20 % at
all levels above 100 hPa. A statistically significant dry bias is identified at 22–32 hPa (−9±4 % in v3;−8±4 % in v4) and
a statistically significant moist bias is identified at 68–83 hPa (6±4 % in v3; 12±5 % in v4). Mean biases between 121 and 261 hPa are generally negative in both v3 and v4, with the exception of v3 at 215 hPa. Pressure-weighted mean bi-ases in this layer are−23±15 % in v3 and−32±11 % in
v4. Mean biases at 316 hPa are near zero in both v3 and v4. Biases of rms in water vapour volume mixing ratio through most of the UTLS are similar between v3 and v4. Biases of rms are low in the stratosphere, increase gradually through the tropopause layer, then increase sharply into the upper tro-posphere, particularly in v3. Substantial reductions in the rms bias, standard error and IQR at 316 hPa in v4 relative to v3 in-dicate that retrieved values at this level are substantially less noisy in v4. By contrast, slight increases in rms bias through the tropopause layer and lower stratosphere (56–147 hPa) suggest that increased data yields in v4 (see Sect. 2.2) may slightly increase overall noise levels in this vertical range.
10 8 6 4 2 0 2 4 6 8 10 Temperature bias [K]
316 261 215 178 147 121 10083 68 56 46 38 32 26 22 18 15 12 10
Pressure [hPa]
(a) MLS v3
Mean bias, IMet RMS bias, IMet Mean bias, RS92 RMS bias, RS92
10 8 6 4 2 0 2 4 6 8 10
Temperature bias [K] 316
261 215 178 147 121 10083 68 56 46 38 32 26 22 18 15 12 10
Pressure [hPa]
(b) MLS v4
Figure 6.Mean and root mean square biases for(a)MLS v3 and(b)MLS v4 temperature retrievals relative to 17 temperature profiles at Lhasa and Linzhi measured using both InterMet (IMet) and RS92 radiosondes. Uncertainty bounds on the mean bias represent twice the standard error of the mean.
100 101 102 103 104
Water vapour volume mixing ratio [ppmv] 316
261 215 178 147 121 10083 68 56 46 38 32 26 22 18 15 12 10
Pressure [hPa]
Lhasa, Tibet (91.14° E, 29.66° N) 06:47:52 UTC 18 May 2012 Aura MLS (93.64° E, 29.66° N) 07:11:29 UTC 18 May 2012
Distance: 241.4 km
(a)
CFH
CFH (v3 averaging kernels) CFH (v4 averaging kernels) MLS v3
MLS v4
50 0 50
Relative difference [%] (b)
Figure 7.As in Fig. 3, but for CFH, MLS v3 and MLS v4 profiles of water vapour volume mixing ratio.
in v3, consistent with v4 retrievals in the upper troposphere for this region and season, being systematically drier than v3 retrievals (Fig. 2b). However, both the rms bias and the bias between the MLS and sonde rms values are substantially duced in v4 relative to v3, further indicating that MLS re-trievals of water vapour in the upper troposphere are much less noisy in v4 than in v3, despite the greater data yields in v4. Median biases in water vapour volume mixing ratio for v4 (Fig. 8b) are very close to the mean biases at pressures less than or equal to 100 hPa, but diverge slightly from the mean biases at several levels with pressures greater than 100 hPa, indicating that the mean bias may slightly overestimate the dry bias in this layer. Approximately 70 % of the observed biases between 121 and 261 hPa are negative for both v3 and v4, indicating that MLS water vapour retrievals in the
up-per troposphere over the eastern Tibetan Plateau are typically drier than collocated CFH measurements in both versions.
3.3 Ozone
Figure 10 shows profiles of ozone from ECC measurements and v3 and v4 MLS retrievals collected near Lhasa on 18 May 2012. These ozone profiles correspond to the temper-ature profiles shown in Fig. 3 and the water vapour profiles shown in Fig. 7. The ozone profile, based on ECC measure-ments convolved to MLS pressure levels using the v3 av-eraging kernels, is almost identical to the one convolved to MLS pressure levels using the v4 averaging kernels, and both reduced-resolution profiles are consistent with the vertical structure of the underlying in situ measurements. By contrast, the v3 and v4 retrievals differ substantially from each other between 68 and 316 hPa, with biases of up to±40 % relative
to the ECC measurements that often change sign between v3 and v4. One of the goals of the MLS v4 development was to reduce the degree of unrealistic vertical structure reported in v3 UTLS ozone profiles. This was accomplished by split-ting the retrieval of ozone away from that of other species (notably, carbon monoxide and nitric acid) and neglecting channels that the retrievals were unable to fit accurately.
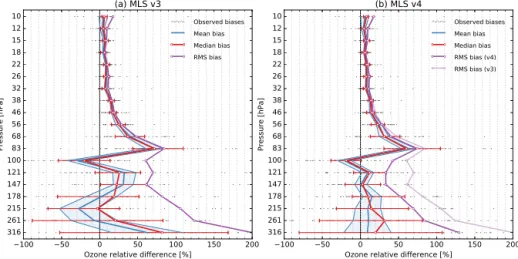
Figure 11 shows mean, median and rms biases for MLS v3 and v4 retrievals of ozone volume mixing ratio relative to ECC measurements. The number of samples used to calcu-late these statistics varies from a minimum of 38 samples at 10 hPa (37 for v3) to a maximum of 69 samples at 316 hPa (67 for v3). Mean and median biases in ozone volume mix-ing ratio are positive or statistically indistmix-inguishable from zero throughout the UTLS except for at 100 hPa (where mean biases are−30±13 % in v3 and−21±9 % in v4 and
me-dian biases are−20 % in v3 and−18 % in v4). Positive
100 50 0 50 100 150 200 Water vapour relative difference [%]
316 261 215 178 147 121 100 83 68 56 46 38 32 26 22 18 15 12 10 Pressure [hPa]
(a) MLS v3
Observed biases Mean bias Median bias RMS bias
100 50 0 50 100 150 200
Water vapour relative difference [%] 316 261 215 178 147 121 100 83 68 56 46 38 32 26 22 18 15 12 10 Pressure [hPa]
(b) MLS v4
Observed biases Mean bias Median bias RMS bias (v4) RMS bias (v3)
Figure 8.As in Fig. 4, but for relative biases between CFH and(a)MLS v3 and(b)MLS v4 profiles of water vapour volume mixing ratio. The mean and rms biases (and associated uncertainties) are calculated from absolute differences and then normalized relative to the mean CFH-derived mixing ratio at each level. The median bias and IQR are calculated using relative differences from each validation profile.
0.0 0.1 0.2
0.3 0.4 0.5 0.6 0.7 0.8 0.9 0.95 Correlation
0 1 2
Normalized standard deviation
0 1 2
0.0 0.1 0.2
0.3 0.4 0.5 0.6 0.7 0.8 0.9 0.95 Correlation
0 1 2
0 1 2 1.000 1.500 0.500 2.000 2.500 TL S TL S UT UT
Figure 9.As in Fig. 5, but for water vapour. The UT in this case is defined as 178–316 hPa, rather than 178–261 hPa.
that MLS v3 and v4 generally overestimate ozone concen-trations in this region during boreal summer. The maximum biases are located at 83 hPa (72±11 % in v3; 63±10 % in
v4). This bias profile differs from bias profiles generated by comparisons with most ozonesonde profiles in this latitude range (Jiang et al., 2007) and by comparisons with other satellite data sets (Tegtmeier et al., 2013) and may be re-gionally/seasonally specific. In particular, the proximity of the balloon launch sites to the centre of the boreal summer
101 102 103 104
Ozone volume mixing ratio [ppbv] 316 261 215 178 147 121 10083 68 56 46 38 32 26 22 18 15 12 10 Pressure [hPa]
Lhasa, Tibet (91.14° E, 29.66° N) 06:47:52 UTC 18 May 2012 Aura MLS (93.64° E, 29.66° N) 07:11:29 UTC 18 May 2012
Distance: 241.4 km
(a)
ECC
ECC (v3 averaging kernels) ECC (v4 averaging kernels) MLS v3
MLS v4
50 0 50 100
Relative difference [%] (b)
Figure 10.As in Fig. 3, but for ECC, MLS v3 and MLS v4 profiles of ozone volume mixing ratio.
lower stratospheric “ozone valley” (Zhou et al., 1995; Tobo et al., 2008) may contribute to the large positive biases at 83 hPa. We discuss this feature further in Sect. 4.
100 50 0 50 100 150 200 Ozone relative difference [%]
316 261 215 178 147 121 100 83 68 56 46 38 32 26 22 18 15 12 10
Pressure [hPa]
(a) MLS v3
Observed biases Mean bias Median bias RMS bias
100 50 0 50 100 150 200
Ozone relative difference [%] 316
261 215 178 147 121 100 83 68 56 46 38 32 26 22 18 15 12 10
Pressure [hPa]
(b) MLS v4
Observed biases Mean bias Median bias RMS bias (v4) RMS bias (v3)
Figure 11.As in Fig. 4, but for relative biases between ECC and(a)MLS v3 and(b)MLS v4 profiles of ozone volume mixing ratio.
0.0 0.1 0.2
0.3 0.4
0.5
0.6
0.7
0.8
0.9
0.95 Correlation
0 1 2 3 4 5
Normalized standard deviation
0 1 2 3 4
50.0 0.1 0.2 0.3
0.4 0.5
0.6
0.7
0.8
0.9
0.95 Correlation
0 1 2 3 4 5
0 1 2 3 4 5
2.000
1.000
3.000 5.000
4.000
UT
SS TL
TL UT
Figure 12.As in Fig. 5, but for ozone.
v3 to slightly positive in v4, along with a reduction in the as-sociated standard error. This is consistent with smaller fluc-tuations in the vertical profile of the mean bias in v4 rela-tive to v3, particularly at pressures greater than 100 hPa. Me-dian biases are similar to mean biases through most of the UTLS. The consistency between mean and median biases in the stratosphere indicates that high biases in MLS ozone re-trievals between 18 and 83 hPa are robust to statistical as-sumptions: almost all (∼92 %) of the calculated biases in
this layer are positive.
The vertical structure of rms biases in ozone mixing ra-tio largely mirrors the vertical structure of mean biases. The
pressure-weighted mean rms biases in the upper troposphere and tropopause layer are smaller in v4 than in v3, with partic-ularly pronounced improvements in the upper troposphere. Despite increased data yields (see Sect. 2.2), noise in up-per tropospheric ozone retrievals appears to be substantially reduced in v4 relative to v3. Although ozone retrievals at 316 hPa are still not recommended for scientific use (Livesey et al., 2015), our validation results indicate that these re-trievals are much improved in v4.
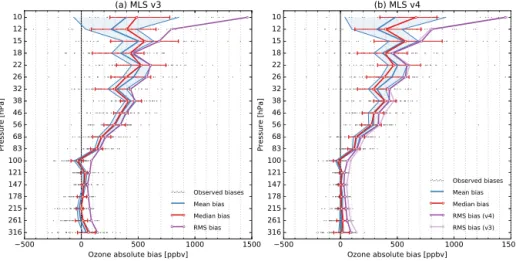
MLS ozone retrievals are performed with respect to vol-ume mixing ratio (unlike water vapour retrievals, which are performed with respect to the logarithm of volume mixing ratio). We therefore include a statistical evaluation of ab-solute biases in MLS v3 and v4 retrievals of ozone vol-ume mixing ratio (Fig. 13) for context. Like the relative bias profiles, the absolute bias profiles are dominated by the high biases in the stratosphere, although the largest abso-lute biases are located at higher altitudes (38 hPa and above) than the largest relative biases (83 hPa). Pressure-weighted mean biases in the stratosphere are 378±56 ppbv in v3 and
368±54 ppbv in v4, pressure-weighted mean biases in the tropopause layer are 53±9 ppbv in v3 and 35±8 ppbv in v4, and pressure-weighted mean biases in the upper troposphere are−8±11 ppbv in v3 and 8±7 ppbv in v4.
4 Discussion
Aura is a sun-synchronous satellite, so that MLS observes the validation domain in the early morning (∼01:45 local time, LT; descending passes) and early afternoon (∼13:45 LT;
calcu-500 0 500 1000 1500 Ozone absolute bias [ppbv]
316 261 215 178 147 121 100 83 68 56 46 38 32 26 22 18 15 12 10
Pressure [hPa]
(a) MLS v3
Observed biases Mean bias Median bias RMS bias
500 0 500 1000 1500
Ozone absolute bias [ppbv] 316
261 215 178 147 121 100 83 68 56 46 38 32 26 22 18 15 12 10
Pressure [hPa]
(b) MLS v4
Observed biases Mean bias Median bias RMS bias (v4) RMS bias (v3)
Figure 13.As in Fig. 4, but for absolute biases between ECC and(a)MLS v3 and(b)MLS v4 profiles of ozone volume mixing ratio.
lated for ascending retrievals and mean biases calculated for descending retrievals, with the exception of v3 temper-ature at two levels in the upper troposphere. Cold biases in v3 temperature retrievals at 178 hPa are reduced during the daytime (−1.1±0.5 K) relative to night-time (−2.4±0.7). This difference in mean biases persists up to 83 hPa, al-though the uncertainty windows overlap for pressures less than 178 hPa. By contrast, cold biases at 261 hPa are en-hanced during the daytime (−3.5±0.9 K) relative to night-time (−1.8±0.6). Cold biases at 316 hPa are also enhanced for daytime retrievals (−4.3±1.5 K) relative to night-time re-trievals (−0.2±1.2 K), with the caveat that these data are not recommended for use in scientific studies. Convective activ-ity over the south-eastern Tibetan Plateau peaks in the late af-ternoon (Fujinami et al., 2005), so that these differences may be caused by convective activity or cloud contamination that is undetected by the quality control criteria. Alternatively, they may be attributable to systematic differences between the conditions over Linzhi in 2014 (where most of the sondes were launched at times corresponding to descending passes) and the other measurement sites in 2010–2012 (where most of the sondes were launched at times corresponding to as-cending passes) or to biases in radiosonde temperature mea-surements caused by solar heating of the sensor (the so-called “radiation error”; Nash et al., 2011). Qualitatively similar dif-ferences are identified in the v4 temperature validation, but these differences are not statistically significant.
The standard deviation, interquartile range and rms of tem-perature, water vapour and ozone biases generally increase with increasing pressure, indicating that the spread in the calculated biases is greatest in the upper troposphere. For example, standard deviations in 261 hPa temperatures based on radiosonde observations range from 0.8 K (Tengchong) to 2.0 K (Naqu). Standard deviations in 261 hPa tempera-tures based on retrievals within 200 km of the measurement sites during the measurement campaigns are much larger, ranging from 2.5 K (Naqu) to 5.5 K (Lhasa) in v3 and from
3.0 K (Naqu) to 4.7 K (Tengchong) in v4. Further analysis of our validation results shows strong correlations between the magnitude of the calculated bias and the value retrieved by MLS in the upper troposphere and tropopause layer, partic-ularly for temperature and ozone (not shown). These corre-lations are uniformly positive, indicating that the variance in the collocated MLS retrievals is larger than the variance in the in situ measurements (i.e. that the in situ measurements are more tightly clustered around the mean value). The corre-lation coefficients between temperature retrievals and biases and between ozone retrievals and biases increase with in-creasing pressure, indicating that larger variance in the MLS retrievals is the primary source of the larger spread in the cal-culated biases. The primary implication is that MLS-based estimates of temperature, water vapour and ozone in the up-per troposphere are more reliable at monthly and seasonal timescales than at event timescales, where excessive noise can result in biases at several layers within the UTLS.
unrepresented in the in situ data (such as active convection, which precludes radiosonde launch) may manifest as system-atic biases.
The UTLS over the summertime Asian monsoon contains sharp horizontal gradients in temperature, water vapour and ozone (Randel and Park, 2006; Park et al., 2007). Prefer-ential sampling of collocated MLS retrievals upgradient of the measurement sites would result in an apparent high bias, while preferential sampling of retrievals downgradient of the measurement sites would result in an apparent low bias. For example, the in situ measurements used to validate MLS re-trievals in this study were collected near the “ozone valley” that develops in the UTLS during the Asian summer mon-soon (Zhou et al., 1995; Tobo et al., 2008). This regional-scale minimum in column ozone is a result of repeated injec-tion of ozone-poor air by monsoon convecinjec-tion (potentially augmented by chemical depletion in the tropopause layer) and propagates upward as part of the large-scale ascent asso-ciated with the monsoon anticyclone.
Figure 14 shows time-mean gridded spatial distributions of ozone at 83 hPa based on MLS v4 retrievals during the four measurement campaigns. The time-mean location and mag-nitude of the ozone minimum varied substantially among the measurement campaigns, but the local minimum was con-sistently located nearby to the measurement sites. Slightly more than a third of the MLS retrievals collocated with our ozonesonde profiles were based on observations at locations with similar time mean values to the measurement sites, but more of the retrievals were located upgradient (43 % at loca-tions with higher time-mean ozone concentraloca-tions) than were located downgradient (22 % at locations with lower time-mean ozone concentrations). The time-mean difference between the mean values at the upgradient sites and the time-mean values at the launch sites (+26 %) was also more than
double the mean difference between the time-mean values at the downgradient sites and the time-mean values at the launch sites (−12 %). These results suggest that some
por-tion of the high bias in MLS ozone at 83 hPa may be due to spatial sampling biases.
To more fully evaluate the possibility that preferential spa-tial sampling produces a high bias in MLS ozone at 83 hPa, we interpolate time-mean gridded MLS profiles to each mea-surement site using bilinear interpolation (the results are vir-tually identical when higher-order interpolation schemes are used). We then compare these time-mean interpolated pro-files with the average values of the in situ observations col-lected during the associated measurement campaign. The re-sults are shown in Fig. 15. The shape of the bias profile is qualitatively robust. Moreover, the mean bias at 83 hPa ap-pears to accurately capture the local biases at Tengchong and Linzhi but underestimates the local biases at Naqu and Lhasa. Weighting the results by the number of profiles at each site, the mean interpolated bias is 87 % for v3 and 82 % for v4. These values are larger than the mean biases calcu-lated in Sect. 3.3 (70±11 % for v3 and 66±10 % for v4).
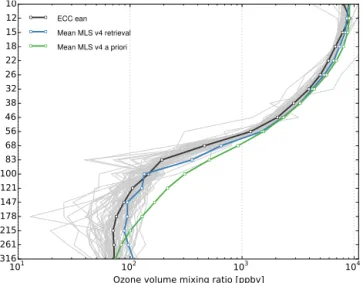
We therefore find little evidence that systematic errors arising from preferential spatial sampling could cause us to overesti-mate the high bias in MLS ozone mixing ratios at 83 hPa. A more plausible explanation may be propagation of informa-tion from the a priori profile into the retrieval, in particular through the smoothing constraints in the MLS retrieval algo-rithms, which favour retrieved profiles with shapes (charac-terized by the vertical second derivative) close to that of the a priori. The MLS a priori profiles (which are taken from monthly zonal mean model output) begin to increase at a lower altitude with a more gradual vertical gradient in the tropopause layer than is typically observed over this region during the monsoon (Fig. 16; see also Bian et al., 2012; Yan et al., 2015). This hypothesis is provisionally supported by a significant reduction in biases at 83 hPa calculated using ob-servations made at Lhasa and Linzhi before monsoon onset (44±14 % in v3; 26±15 % in v4) relative to during the mon-soon (82±15 % in v3; 78±12 % in v4), as well as the fact that (to our knowledge) no previous MLS ozone validation effort has identified such a sharp peak in the ozone bias profile at 83 hPa. Sensitivity testing has shown that MLS retrievals are largely insensitive to constant offsets in the a priori profiles; however, the impacts of shifting tropopause-related gradients and other sharp features vertically within the a priori profiles have not yet been examined.
Temperature within the Asian monsoon anticyclone is warm relative to the zonal mean in the upper troposphere and cold relative to the zonal mean in the tropopause layer (Park et al., 2007). A broad temperature maximum was lo-cated to the west of the measurement sites in the upper tropo-sphere (178–261 hPa), but time-mean temperature contours above the measurement sites were approximately zonal at 147 hPa and above. Despite some regional differences, biases between time-mean temperature profiles interpolated to each measurement site and mean temperature profiles based on ra-diosonde observations at the corresponding measurement site (not shown) are comparable in both structure and magnitude to the mean and median biases shown in Fig. 4. The ver-tical structure of temperature biases before monsoon onset is similar to that during the monsoon; however, cold biases in the stratosphere are slightly enhanced (by∼0.5–1 K)
be-fore monsoon onset relative to during the monsoon, while cold biases in the upper troposphere are slightly enhanced (by∼1–1.5 K) during the monsoon relative to before
mon-soon onset. At 100–121 hPa, cold biases before the monmon-soon (−0.8±0.6 K in v3;−1.3±0.5 K in v4) are replaced by warm biases during the monsoon (0.9±0.6 K in v3; 0.7±0.6 K in v4). These quantitative changes in temperature bias oppose the changes in temperature structure that accompany mon-soon onset (warming in the upper troposphere and cooling near the tropopause) and indicate that MLS underestimates seasonal changes in UTLS temperature associated with the establishment of the Asian monsoon anticyclone.
Figure 14.Balloon launch locations (red stars), centres of footprints of MLS observations collocated to balloons launched at each location (red circles) and mean spatial distributions of ozone volume mixing ratio at the 83 hPa level during the measurement campaigns at(a) Teng-chong, Yunnan in August 2010,(b)Naqu, Tibet in August 2011,(c)Lhasa, Tibet in May–July 2012 and(d)Linzhi, Tibet in June–July 2014. The gridded values are inverse-distance weighted averages on a 5◦longitude by 2.5◦latitude grid, with weighted contributions from all valid measurements within 10◦longitude and 10◦latitude of the grid cell centre.
50 0 50 100 150
Ozone relative difference [%] 316
261 215 178 147 121 100 83 68 56 46 38 32 26 22 18 15 12 10
Pressure [hPa]
(a) MLS v3
Mean bias Tengchong Naqu Lhasa Linzhi
50 0 50 100 150
Ozone relative difference [%] 316
261 215 178 147 121 100 83 68 56 46 38 32 26 22 18 15 12 10
Pressure [hPa]
(b) MLS v4
Figure 15.Relative differences between ECC ozonesonde observa-tions and retrievals of ozone volume mixing ratio from(a)MLS v3 and (b)MLS v4. Grey lines and shading represent the mean bias and twice the standard error of the mean bias from the core vali-dation analysis, as shown in Fig. 11. Coloured lines represent rela-tive differences between mean ozonesonde observations convolved to MLS pressure levels and time-mean gridded MLS observations during each study period (see, e.g. Fig. 14) interpolated to the re-spective ozonesonde launch site.
the upper troposphere and tropopause layer that transitions to an approximate south–north gradient in the stratosphere. The maximum in the upper troposphere is generally centred over the Bay of Bengal, south of the measurement sites, while
101 102 103 104
Ozone volume mixing ratio [ppbv] 316
261 215 178 147 121 10083 68 56 46 3832 2622 18 15 12 10
ECC ean
Mean MLS v4 retrieval
Mean MLS v4 a priori
Figure 16.Vertical profiles of ozone mixing ratio from ECC profiles convolved to MLS pressure levels (mean in dark grey; individual profiles in light grey), MLS v4 retrievals in the validation domain (blue) and MLS v4 a priori profiles in the validation domain (green).
mean and median bias profiles discussed in Sect. 3.2. With the exception of 316 hPa in v3, standard deviations in MLS retrievals within 200 km of the measurement sites are com-parable to (and sometimes even smaller than) standard de-viations in the CFH measurements convolved to MLS pres-sure levels. Combined with the lack of strong correlations between water vapour retrievals and biases, this quantitative similarity indicates that the increase in the spread of water vapour biases with increasing pressure may be attributable to real variability with timescales/space scales similar to or smaller than the collocation criteria, rather than noise in the retrievals. We conclude that MLS provides a reliable repre-sentation of water vapour mixing ratios in the UTLS over this region with respect to both mean values (mean biases within
±20 %) and variance (although MLS v4 may underestimate the real variability of water vapour in the upper troposphere between 215 and 261 hPa, where standard deviations in MLS retrievals are less than 50 % of the standard deviations in the CFH measurements). Retrievals of water vapour mixing ra-tios at 316 hPa are generally improved in v4 relative to v3, particularly in terms of variance (which is comparable to derived variance in v4, but approximately double CFH-derived variance in v3). We find no significant differences in water vapour biases before monsoon onset relative to during the monsoon.
MLS v3 temperature and ozone retrievals at 316 hPa are not recommended for scientific use due to excessive noise, large biases and insufficient validation (Livesey et al., 2013, 2015); we now revisit these recommendations in the con-text of our results. The results of our validation analysis (Fig. 4) show a slight decrease in the mean (−2.9±1.1 to
−2.7±1.5 K) and median (−2.8 to−1.8 K) temperature bi-ases at 316 hPa in v4 relative to v3, although these changes are not statistically significant. By contrast, there are strong indications that v4 temperature retrievals are noisier than v3 temperature retrievals at this level, as indicated by increases in the rms bias (from 5.9 to 7.5 K), the standard error of the mean bias (from 0.6 to 0.8 K) and the extent of the interquar-tile range around the median bias (from 6.2 to 10.5 K). Users of v4 should continue to avoid the use of temperature re-trievals at 316 hPa in scientific studies. Moreover, enhanced noise in v4 temperature retrievals (relative to v3) extends up-ward to 178 hPa, indicating that users of MLS retrievals of upper tropospheric temperature should exercise care before using v4 (especially for studies of individual events). By con-trast, our validation of MLS ozone retrievals (Fig. 11) shows a sharp reduction in the mean bias of ozone volume mixing ratio at 316 hPa in v4 (10±30 %) relative to v3 (67±47 %), along with reductions in rms (from 204 % in v3 to 128 % in v4) and median (from 82 % in v3 to 29 % in v4) biases. Although ozone retrievals at this level remain noisy and ad-ditional evaluation is still needed, our results indicate that v4 represents a substantial improvement in ozone retrievals at 316 hPa (and throughout the upper troposphere) relative to v3.
Yan et al. (2015) presented a preliminary validation of MLS v2 and v3 water vapour and ozone retrievals using many of the soundings collected at Tengchong, Naqu and Lhasa. Our methodology differs from theirs in several re-spects, most notably in the approach used for convolving the sonde profiles to MLS levels (where we use the MLS averaging kernels and forward smoothing function as op-posed to linear interpolation) and in the criteria used to select coincident MLS retrievals for validation. Moreover, the in-clusion of additional soundings (particularly those collected at around midnight local time over Linzhi) substantially re-duces uncertainty windows around the mean and median biases and allows for a more comprehensive validation of retrievals collected during both ascending and descending satellite overpasses. The key features of the water vapour and ozone bias profiles are robust despite these differences in methodology, particularly the high biases in lower strato-spheric ozone.
5 Summary and outlook
Aura MLS v3 and v4 retrievals of temperature, water vapour and ozone provide valuable information about the thermal structure and composition of the upper troposphere and stratosphere in the Asian monsoon anticyclone. We have pre-sented a validation of these data in the UTLS (10–316 hPa) using in situ measurements collected using balloon-borne in-struments over the Tibetan Plateau (Naqu, Lhasa and Linzhi) and adjacent regions (Tengchong, Yunnan) during four recent summers.
Temperature biases are largely similar between v3 and v4, with slightly smaller cold biases in v4 in the tropopause layer (68–147 hPa) and lower–middle stratosphere (10–56 hPa), but slightly larger cold biases in v4 in the upper tropo-sphere (178–261 hPa). Vertical oscillations in the tempera-ture bias profile that have existed since the initial public release (Schwartz et al., 2008) persist in v4. Retrievals at 316 hPa remain unsuitable for use in scientific studies, while increased variance in v4 throughout the upper troposphere (178–261 hPa) may create issues for studies focused on in-dividual events or using small sample sizes. Variances in MLS retrievals are several Kelvin larger than variances de-rived from radiosonde profiles, especially in the upper tropo-sphere, reflecting the effects of noise on the retrievals. The upper troposphere over the validation domain is systemati-cally colder by 0.2–0.8 K in v4 relative to v3, while changes to the retrieval algorithm and quality control criteria increase the data yield in this region by about 10 %.
v4 retrievals of water vapour through much of the upper tro-posphere are 30–40 % drier than collocated CFH measure-ments. This dry bias is more vertically homogeneous than previous estimates from other regions based on comparison with CFH measurements (which found mean moist biases at 261 hPa Read et al., 2007; Vömel et al., 2007a) and consid-erably larger than estimates based on comparison with other satellite retrievals in the tropical or extratropical mean (Heg-glin et al., 2013). Biases of rms and other variance estimates are slightly larger between 56 and 178 hPa in v4 than in v3, perhaps due to large increases (∼32 %) in data yield from v3
to v4. By contrast, variance is substantially reduced at 261 and 316 hPa and is now largely consistent with estimates of variance derived from the CFH measurements.
Ozone retrievals are substantially improved in v4 relative to v3, particularly in the upper troposphere and tropopause layer: biases in ozone retrievals in the tropopause layer are significantly smaller, variance is reduced below 68 hPa (along with a 29 % increase in data yield), and sharp gradi-ents in the vertical profile of ozone biases in the upper tro-posphere are largely eliminated. The most influential change in ozone is a reduction of the vertical gradient of ozone mix-ing ratio between 100 and 316 hPa, which includes decreases in ozone mixing ratios in the tropopause layer (83–147 hPa) and in the lower part of the upper troposphere (261–316 hPa). Despite these improvements, MLS ozone retrievals are bi-ased high relative to ECC measurements through most of the stratosphere (18–83 hPa) and biased low relative to ECC measurements at 100 hPa. Of particular note, the bias pro-file contains a pronounced peak of about +70 % at 83 hPa, which is not seen in biases relative to measurements made at most other ozonesonde sites (Jiang et al., 2007) or retrievals made by other satellite instruments (Tegtmeier et al., 2013). This large positive bias at 83 hPa may therefore be specific to ozone retrievals in the vicinity of the Asian monsoon anti-cyclone. Detailed analysis indicates that this bias is unlikely to result from preferential sampling of higher ozone mixing ratios upgradient from the nearby “ozone valley”. We pro-pose instead that this persistent high bias may propagate into the retrieval via smoothing towards the a priori profile, which does not adequately represent the very sharp vertical gradient in ozone concentrations near the tropopause over this region.
Overall, our validation indicates that v4 represents an im-provement on v3. This imim-provement is particularly apparent for ozone, but is also manifest in increased data yields and small improvements in the bias profiles for temperature (at 147 hPa and above) and water vapour. Temperature retrievals in the upper troposphere (178–261 hPa) are more problem-atic, as v4 shows a larger cold bias and larger variance than v3 at these levels.
Several aspects of our results differ from previously pub-lished estimates of global and tropical biases in MLS re-trievals, including the structure and magnitude of high bi-ases in ozone through much of the stratosphere (which are substantially larger than previous estimates, particularly at 68–83 hPa Jiang et al., 2007; Tegtmeier et al., 2013), the magnitude of dry biases in the upper troposphere (which are slightly larger and more vertically homogeneous than pre-vious estimates; Read et al., 2007; Hegglin et al., 2013) and the magnitude of cold biases in the upper troposphere (which are also larger than previous estimates, particularly in v4 Schwartz et al., 2008; Livesey et al., 2015). Of these, the unusually large high bias in ozone at 83 hPa and the unusu-ally large cold bias in the upper troposphere are exacerbated following monsoon onset. Conditions in the Asian monsoon anticyclone pose unique challenges for remote sensing that impact the quality of MLS retrievals in this region. These results provide valuable context that will help to facilitate fu-ture studies of the thermal strucfu-ture and composition of the UTLS in the Asian monsoon anticyclone and are expected to contribute to future improvements in the MLS retrieval algorithm and data products in this critical region of the at-mosphere.
6 Data availability
Appendix A: Quality control criteria
In addition to the collocation criteria (within 1000 km and
±12 h), we have selected only high-quality MLS retrievals
for validation. Livesey et al. (2013) and Livesey et al. (2015) recommended quality control criteria for v3 and v4 respec-tively. We slightly modify their recommendations to ensure that all profiles selected for comparison are valid through-out the 316–10 hPa vertical range. These modifications re-sult in more restrictive criteria, at the potential cost of select-ing retrievals that are farther from the balloonsonde launch site than the closest viable retrieval at some levels. The qual-ity control criteria we use are reproduced below for con-venience; readers requiring further details should refer to Livesey et al. (2013) or Livesey et al. (2015).
A1 Temperature
For v3 temperature, the Convergence flag must be less than 1.2, theQualityflag must be greater than 0.65, the Statusflag must be even, the fifth (low cloud) bit of the Statusflag must not be set for either of the following two retrievals in the orbit andL2gpPrecisionmust be posi-tive at all levels between 316 and 10 hPa.
For v4 temperature, theConvergenceflag must be less than 1.03, the Qualityflag must be greater than 0.9, the Statusflag must be even, the MLS-retrieved ice water con-tent (IWC) at 215 hPa must be less than 0.005 mg m−3and L2gpPrecisionmust be positive at all levels between 316 and 10 hPa and must be less than or equal to 0.7 at 261 hPa and 0.825 at 215 hPa.
A2 Water vapour
For v3 water vapour, theConvergenceflag must be less than 2.0, the Qualityflag must be greater than 1.3, the Statusflag must be even, the fourth (high cloud) and fifth (low cloud) bits of the Status flag must not be set and L2gpPrecisionmust be positive at all levels between 316 and 10 hPa.
For v4 water vapour, theConvergenceflag must be less than 2.0, theQualityflag must be greater than 1.45, the Statusflag must be even andL2gpPrecisionmust be positive at all levels between 316 and 10 hPa.
A3 Ozone
For v3 ozone, the Convergence flag must be less than 1.18, the Quality flag must be greater than 0.6, the Statusflag must be even,L2gpPrecisionmust be pos-itive at all levels between 316 and 10 hPa andL2gpValue must be greater than−0.3×10⁻⁶at 316 hPa and greater than −0.15×10⁻⁶ at all other levels. Occasional negative
val-ues in the ozone retrievals are caused by low signal-to-noise ratios (likely due to low ozone mixing ratios in the tropo-sphere). The inclusion of these negative values is necessary to avoid high biases in measures of the statistical centre and low biases in measures of statistical spread (Livesey et al., 2015).