HESSD
7, 2709–2726, 2010Controls on open water evaporation
R. J. Granger and N. Hedstrom
Title Page
Abstract Introduction
Conclusions References
Tables Figures
◭ ◮
◭ ◮
Back Close
Full Screen / Esc
Printer-friendly Version Interactive Discussion
Discussion
P
a
per
|
Dis
cussion
P
a
per
|
Discussion
P
a
per
|
Discussio
n
P
a
per
Hydrol. Earth Syst. Sci. Discuss., 7, 2709–2726, 2010 www.hydrol-earth-syst-sci-discuss.net/7/2709/2010/ doi:10.5194/hessd-7-2709-2010
© Author(s) 2010. CC Attribution 3.0 License.
Hydrology and Earth System Sciences Discussions
This discussion paper is/has been under review for the journal Hydrology and Earth System Sciences (HESS). Please refer to the corresponding final paper in HESS if available.
Controls on open water evaporation
R. J. Granger and N. Hedstrom
National Water Research Institute, Environment Canada, Saskatoon, Canada
Received: 20 January 2010 – Accepted: 23 January 2010 – Published: 4 May 2010
Correspondence to: R. J. Granger ([email protected])
HESSD
7, 2709–2726, 2010Controls on open water evaporation
R. J. Granger and N. Hedstrom
Title Page
Abstract Introduction
Conclusions References
Tables Figures
◭ ◮
◭ ◮
Back Close
Full Screen / Esc
Printer-friendly Version Interactive Discussion
Discussion
P
a
per
|
Dis
cussion
P
a
per
|
Discussion
P
a
per
|
Discussio
n
P
a
per
|
Abstract
The paper presents the initial results of a field study of boundary layer behaviour and open water evaporation carried out on two small- to medium-sized lakes in Western and Northern Canada. Meteorological and boundary layer measurements were made over the water surfaces and over the upwind land surface, allowing for an examination
5
of the effect of lake-land contrasts of temperature on the wind speed over the open water and on the evaporation rates. Lake evaporation was measured directly using eddy covariance equipment.
The study showed that, for time periods shorter than daily, the open water evapora-tion bears no relaevapora-tionship to the net radiaevapora-tion. The wind speed is the most significant
10
factor governing the evaporation rates, followed by the land-water temperature con-trast and the land-water vapour pressure concon-trast. The effect of the stability on the wind field is demonstrated; stability over the water and adjacent land surfaces are, for the most part, out of phase. The derived relationships will be used to develop a model for estimating the hourly evaporation rates from open water.
15
Examination of the seasonal trends shows that the open water period can be sepa-rated into two distinct evaporative regimes: the warming period in the Spring, when the land temperature is greater than the water temperature, the turbulent fluxes over water are suppressed; and the cooling period, when the water temperature is greater than the air temperature, and the turbulent fluxes over water are enhanced.
20
1 Introduction
Evaporation from open water bodies is an important component of the energy and hydrologic cycles for many watersheds. Since most hydrological and meteorological models operate with time steps of the order of an hour, a reliable approach to the calculation of hourly lake evaporation is necessary to both objectives.
HESSD
7, 2709–2726, 2010Controls on open water evaporation
R. J. Granger and N. Hedstrom
Title Page
Abstract Introduction
Conclusions References
Tables Figures
◭ ◮
◭ ◮
Back Close
Full Screen / Esc
Printer-friendly Version Interactive Discussion
Discussion
P
a
per
|
Dis
cussion
P
a
per
|
Discussion
P
a
per
|
Discussio
n
P
a
per
However, evaporation from open water remains largely unmeasured as a course of routine and is still estimated with limited confidence. This is particularly true for sub-daily time periods, where the factors governing the boundary layer dynamics, the thermal lag between the water and land surfaces, and the evaporation rates are not well understood.
5
Some analytical and field studies have provided limited insight into the controls on open water evaporation. Weisman and Brutsaert (1973) applied analytical solutions to the advection problem over open water for the unstable case and showed that an appropriate formulation of the transfer processes, occurring in the advective boundary layer, is required. Blanken et al. (2000), in a study of evaporation over Great Bear Lake,
10
showed that for daily periods, open water evaporation is governed by the wind speed and the vapour gradient over the water. Granger (2000) showed that lake evaporation is largely uncoupled from (or unsynchronized with) the land surface evapotranspiration. The land surface processes closely follow the pattern of energy supply. The partition-ing of the net radiation is straightforward; the soil heat flux tends to be relatively small
15
for most situations and the turbulent fluxes of sensible and latent heat, for the most part, behave in a similar manner. The partitioning of energy on a lake surface, on the other hand, is more complex. Because of radiation penetration, heat storage effects can be significant. The turbulent fluxes of sensible and latent heat are not necessarily in phase with the radiant energy supply, but are governed by the gradients of
tempera-20
ture and humidity in the boundary layer. These gradients are controlled both by water surface temperatures (affected by radiation and intermittent mixing of the water) and by the processes occurring at the upwind land surface (heating or cooling of the air and evapotranspiration). For these reasons, land surface data alone are insufficient to parameterize the lake evaporation. Information about the lake surface is also required.
25
HESSD
7, 2709–2726, 2010Controls on open water evaporation
R. J. Granger and N. Hedstrom
Title Page
Abstract Introduction
Conclusions References
Tables Figures
◭ ◮
◭ ◮
Back Close
Full Screen / Esc
Printer-friendly Version Interactive Discussion
Discussion
P
a
per
|
Dis
cussion
P
a
per
|
Discussion
P
a
per
|
Discussio
n
P
a
per
|
solutions did not work as well: an analysis of the advection under stable boundary layer conditions, such as those encountered over a lake during daytime heating of the adjacent land surface, is required.
Assouline and Mahrer (1993) and Liu et al. (2009) also showed that the open water evaporation is greatly affected by the stability of the overlying air, which is governed by
5
the land-water temperature contrast.
The purpose of the present study was to demonstrate how the advective boundary layer over a lake, as well as the open water evaporation are affected by such pa-rameters as net radiation, wind speed over the water, water surface temperature, the temperature and vapour pressure gradients over the water, atmospheric stability and
10
upwind fetch distance.
2 Study sites
Two lakes, providing a range of fetch distances from 150 m to 11 000 m, were chosen for the study. The largest of these is Crean Lake, located within the Prince Albert National Park in Saskatchewan. A small island, near the centre of the lake provided a stable
15
and secure platform for the instrumentation, with access to nearly the full spectrum of wind directions and a range of fetch distances from 3600 m to 11 000 m. Observations at Crean Lake were obtained for the open water seasons from 2005 to 2008.
Landing Lake, near Yellowknife, NWT, provided fetch distances ranging from 150 m to 900 m. Observations at Landing Lake were obtained for the period 2007 to 2008.
20
For each lake, the instrumentation included a direct measurement of evaporation (using eddy covariance equipment), short-wave and net all-wave radiation, at least two levels of air temperature, humidity and wind speed, wind direction, as well as the infrared water surface temperature. A water temperature profile was established near the centre of each lake. In each case, an instrumented tower over the adjacent land
25
HESSD
7, 2709–2726, 2010Controls on open water evaporation
R. J. Granger and N. Hedstrom
Title Page
Abstract Introduction
Conclusions References
Tables Figures
◭ ◮
◭ ◮
Back Close
Full Screen / Esc
Printer-friendly Version Interactive Discussion
Discussion
P
a
per
|
Dis
cussion
P
a
per
|
Discussion
P
a
per
|
Discussio
n
P
a
per
were monitored. All parameters were recorded on half-hour intervals. Figure 1 shows the two study lakes, with the locations of the instrumentation.
3 Data analysis
The turbulent fluxes of latent and sensible heat over the water surface were measured directly with an eddy covariance system consisting of a three-dimensional ultra-sonic
5
anemometer and a krypton hygrometer. Some corrections were applied to the eddy covariance measurements; these included coordinate rotation (Kaimal and Finnigan, 1994), the WPL adjustment (Webb et al., 1980), adjustments for sonic path length, high frequency attenuation and sensor separation (Massman, 2000; Horst, 1997) and oxygen extinction for the krypton hygrometer. Data from the meteorological tower over
10
the water surfaces allowed for a second, independent determination of lake evapora-tion using profile measurements of wind speed, air temperature and vapour pressure. Granger and Hedstrom (2006) showed that there is good agreement between the two methods. This allowed for both quality control and gap-filling of the direct eddy flux measurements of evaporation. Wind speed, temperature and humidity data from the
15
land tower allowed for the parameterization of the contrast between the land and wa-ter surfaces. In all cases, daily and seasonal values were obtained by summing the half-hourly rates.
3.1 Controls on evaporation
Three conditions must be met for evaporation to occur from a natural surface; these
20
are:
– there must be a supply of water at the surface;
HESSD
7, 2709–2726, 2010Controls on open water evaporation
R. J. Granger and N. Hedstrom
Title Page
Abstract Introduction
Conclusions References
Tables Figures
◭ ◮
◭ ◮
Back Close
Full Screen / Esc
Printer-friendly Version Interactive Discussion
Discussion
P
a
per
|
Dis
cussion
P
a
per
|
Discussion
P
a
per
|
Discussio
n
P
a
per
|
– there must be a transport mechanism to carry the water vapour away from the surface.
Understanding how these conditions are controlled is necessary for the correct param-eterization of the evaporation process. For land surface evaporation, most models in fact represent all three conditions; the moisture availability is parameterized using soil
5
moisture or a “stomatal resistance”, the net radiation absorbed at the surface is the available energy, and a vapour transfer function based on wind speed is applied. For lakes, however, the supply of water at the surface is non-varying, and as such is not a useful parameter. Also, since the net radiation penetrates the water surface, the en-ergy is absorbed at depth and is not immediately available for the phase change at
10
the surface: there can be very little relationship between the available energy and the turbulent exchanges of heat and water vapour in this case. This leaves only the vapour transport mechanism to work with in the development of an open water evaporation model.
The transport mechanism is governed by the vapour pressure gradient above the
15
surface and the efficiency of the exchange is controlled by the wind speed and the stability. Since all small- to medium-sized lakes, and most open water surfaces, expe-rience advective situations, the vertical humidity gradient is controlled by the horizontal gradients of temperature and moisture, or the lake-land contrast. Most lakes are not uniform in shape, so the fetch distance and wind direction may also be significant.
20
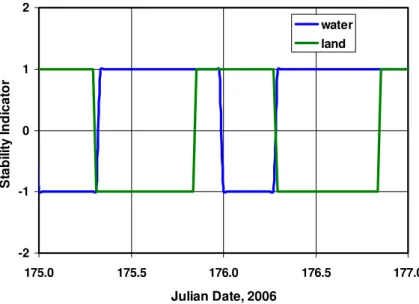
To demonstrate whether the upwind land surface and the water surface are respond-ing in the same way to the environmental forcrespond-ing, one can examine the behaviour of the thermal boundary layer over the two surfaces. Figure 2 presents the diurnal vari-ation of stability over the two surfaces at Crean Lake: in the figure a value of +1 is assigned if the stratification is stable (temperature increasing with height) and a value
25
of−1 if the boundary layer is unstable (temperature decreasing with height). Figure 2
HESSD
7, 2709–2726, 2010Controls on open water evaporation
R. J. Granger and N. Hedstrom
Title Page
Abstract Introduction
Conclusions References
Tables Figures
◭ ◮
◭ ◮
Back Close
Full Screen / Esc
Printer-friendly Version Interactive Discussion
Discussion
P
a
per
|
Dis
cussion
P
a
per
|
Discussion
P
a
per
|
Discussio
n
P
a
per
and that over the water surface is the result of very different thermal inertias; the land surface responds very quickly to the radiative heating and cooling, while with radiation penetration, the water surface is much less responsive to the radiative forcing.
The relationships between the hourly evaporation rates over water and several mete-orological parameters were examined. Figure 3 presents these relationships for (a) net
5
radiation over the water, (b) wind speed over the water, (c) land-water temperature contrast, and (d) water-land vapour pressure contrast. Figure 3a shows that, unlike evaporation from land surfaces, the hourly open water evaporation rate bears little or no relationship to the net radiation. The hourly open water evaporation rate is most strongly affected by the wind’s speed over the water. Although the vapour transfer
10
function is defined by the vapour pressure gradient, the land-water temperature gra-dient actually shows a stronger relationship: this is likely due to the strong effect of stability on the evaporation rates.
Since many of the current evaporation models use net radiation as one of the con-trolling parameters, it is useful to demonstrate how the relationship between
evapora-15
tion and net radiation is affected by the time scale and by water depth. Crean Lake is a relatively deep lake, the portion of the Lake that was studied is typically 21 to 25 m deep. Landing Lake is a relatively shallow lake, with an average depth of 3 to 4 m. For each lake the correlation coefficients were determined for the relationship be-tween evaporation and net radiation for daily, weekly and monthly periods. For Crean
20
Lake, the relationship showedR2values of 0.003, 0.004 and 0.023, respectively. Thus, for a deep lake, even at the monthly time scale, one sees very little relationship be-tween evaporation and net radiation. This suggests that modelling approaches such as the Priestley-Taylor technique, which uses only net radiation and a correction factor, will be of little use in estimating evaporation from open water bodies such as Crean
25
HESSD
7, 2709–2726, 2010Controls on open water evaporation
R. J. Granger and N. Hedstrom
Title Page
Abstract Introduction
Conclusions References
Tables Figures
◭ ◮
◭ ◮
Back Close
Full Screen / Esc
Printer-friendly Version Interactive Discussion
Discussion
P
a
per
|
Dis
cussion
P
a
per
|
Discussion
P
a
per
|
Discussio
n
P
a
per
|
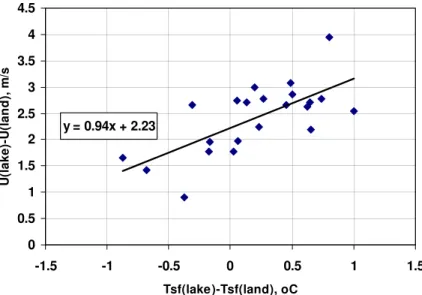
The open water evaporation is most closely controlled by the wind speed over the water (Fig. 3b). Although wind speed is a standard, routinely observed parameter over land surfaces, it is not commonly measured over water surfaces. To examine how the wind speed over water may be affected by atmospheric stability, the lake-land wind speed contrast was compared to the lake-land temperature contrast for 5-day periods
5
at Crean Lake in 2006. These are presented in Fig. 4, while Fig. 6 shows that the wind speed over water is affected by the stability over the water; in unstable situations (lake-land temperature>0) the wind speed increases as the air passes from the land to the water. However, this relationship is also likely affected by the distance from the upwind shore. To test this, the data for both lakes and for all seasons were separated
10
into stable and unstable cases, and sorted according to the upwind fetch distance; the following relationships were developed to relate the wind speed over water to that over land:
Uwater=Uland·(b+c·(Tland−Twater)) (1)
Tland is the air temperature over the adjacent land surface and Twater is the surface
15
temperature of the water. The coefficients, band c, are related to the fetch distance, X (m):
For Stable conditions:
b=1.0+0.0001247·X
c=−0.0125−4.87×10⁻⁶
·X (2)
For Unstable conditions:
20
b=1.0+0.0001247·X
c=−0.0125−2.33×10⁻⁵
·X (3)
HESSD
7, 2709–2726, 2010Controls on open water evaporation
R. J. Granger and N. Hedstrom
Title Page
Abstract Introduction
Conclusions References
Tables Figures
◭ ◮
◭ ◮
Back Close
Full Screen / Esc
Printer-friendly Version Interactive Discussion
Discussion
P
a
per
|
Dis
cussion
P
a
per
|
Discussion
P
a
per
|
Discussio
n
P
a
per
3.2 Seasonal evaporation
Figure 5 shows the seasonal evaporation, radiation and turbulent heat exchange rates as well as the temperature contrast between the water surface and adjacent land sur-face at Crean Lake for the 2007 open water period. The energy terms are expressed
inmm equivalent of evaporation. For the sake of clarity, the temperature values are
5
five-day running averages. The figure shows that for the warming period, the land tem-perature is greater than the water temtem-perature, resulting in stable conditions over the water; whereas for the cooling period the inverse is true. The trends shown in Fig. 5 are similar to those for the other years. The figure shows that the lake evaporation is strongly affected by the thermal contrast between the water and the adjacent land
10
surface. In the Spring, the land surface warms more rapidly than the water surface does; this results in a predominantly stable boundary layer over the lake. In stable conditions, turbulence is suppressed, and so are the exchanges of water vapour and heat. Figure 5 shows that although evaporation occurs during this period, there is very little turbulent heat exchange between the lake and the atmosphere. At Crean lake,
15
for the three study years, the average evaporation rate during the warming period was 1.85 mm/d. The land surface reaches its maximum seasonal temperature generally a few days before the water, and it cools more rapidly than the water does. After this point, an unstable boundary layer (temperature decreasing with height) develops over the water: the instability enhances turbulence and the exchanges of water vapour and
20
heat. For the three study seasons, the average evaporation rate during the cooling pe-riod was 3.05 mm/d. This pattern of temperatures was also demonstrated by Bussi `eres and Granger (2007), who derived seasonal curves of water temperature for large lakes and suggested that these will have an effect on the evaporation rates.
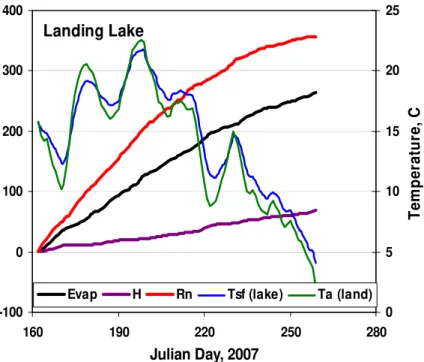
Figure 6 shows the seasonal evaporation, radiation and turbulent heat exchange
25
HESSD
7, 2709–2726, 2010Controls on open water evaporation
R. J. Granger and N. Hedstrom
Title Page
Abstract Introduction
Conclusions References
Tables Figures
◭ ◮
◭ ◮
Back Close
Full Screen / Esc
Printer-friendly Version Interactive Discussion
Discussion
P
a
per
|
Dis
cussion
P
a
per
|
Discussion
P
a
per
|
Discussio
n
P
a
per
|
alternating periods of stable and unstable conditions. Landing Lake is located north of Great Slave Lake, such that the thermal regime over the area is significantly affected by the proximity of the large lake when southerly flows are occurring. Nonetheless, Fig. 6 does show that the turbulent fluxes are significantly modified when the regime changes from unstable to stable. For example, during the first 9-day period, shown in Fig. 6,
con-5
ditions were unstable, the average evaporation rate observed was 3.86 mm/d. During the next 8-day period, conditions were stable and the average evaporation rate dropped to 2.04 mm/d. During the cooling period, Landing Lake behaved the same as did Crean Lake, with a consistent unstable regime and enhanced turbulent fluxes (3.3 mm/d).
Figure 5 shows that evaporation from Crean Lake represents approximately 2.5 times
10
more energy transfer than does the turbulent heat exchange, while Fig. 5 shows that for Landing Lake the latent heat is 3.8 times the turbulent sensible heat. This sug-gests that, for regions such as the boreal plain and sub-arctic shield where open water represents a significant proportion of the surface area, correct knowledge of the lake evaporation rates are important in the regional energy balance, and indeed for the
15
correct assessment of the meteorology.
4 Summary and Conclusions
Four successful field campaigns were carried out for measuring and modelling evapo-ration from Crean Lake, and two seasonal campaigns were carried out at Landing Lake. Data collection includes both lake and land surface parameters and fluxes. The data
20
allowed for a determination of those factors controlling the hourly rates of evaporation from the lake surfaces. It was shown that for the hourly period, the open water evapo-ration bears no relationship with the supply of radiant energy: the solar radiation is ab-sorbed at depth in the water, and the surface temperature is governed more by the mix-ing and the turbulent atmospheric fluxes. The hourly evaporation rates are more closely
25
HESSD
7, 2709–2726, 2010Controls on open water evaporation
R. J. Granger and N. Hedstrom
Title Page
Abstract Introduction
Conclusions References
Tables Figures
◭ ◮
◭ ◮
Back Close
Full Screen / Esc
Printer-friendly Version Interactive Discussion
Discussion
P
a
per
|
Dis
cussion
P
a
per
|
Discussion
P
a
per
|
Discussio
n
P
a
per
or fetch distance, is also important. Thus, the development of a model for estimating the hourly rates of open water evaporation must take these factors into account. A re-lationship is developed between the over water wind speed to that over the adjacent land; the relationship is governed by the lake-land temperature contrast and the fetch distance.
5
The data have allowed for the identification of two distinct evaporation regimes during the open water season; in the early portion of the summer, when air temperatures are generally greater than the water temperatures, the evaporation rates are suppressed; after the temperature maxima are reached, during the cooling down portion of the summer, water temperatures are generally greater than the land temperatures, and
10
lake evaporation is enhanced. For the 2007 open water season, the latent heat ex-change over Crean Lake represented approximately 2.5 times more energy transfer than did the turbulent sensible heat; at Landing Lake this ratio was 3.8. The clear pre-dominance of the latent heat exchange over water does demonstrate that knowledge of lake evaporation rates is important in assessing the regional energy balance.
15
Acknowledgement. The authors wish to express their appreciation for the support provided by the staffof the Prince Albert National Park, for the use of Park facilities and equipment. The authors also acknowledge the financial support provided by Environment Canada, and the IP3 and IPY research programs. The provision of additional data from the Fluxnet site, as well as by colleagues at Environment Canada (Chris Spence, Garth van der Kamp and Randy Schmidt),
20
is also gratefully acknowledged.
References
Assouline, S. and Mahrer, Y.: Evaporation from Lake Kinneret 1. Eddy correlation system mea-surements and energy budget estimates, Water Resour. Res., 29(4), 901–910, 1993. Blanken, P. D., Rouse, W. R., Culf, A. D., Spence, C., Boudreau, L. D., Jasper, J. N.,
Kochtuba-25
HESSD
7, 2709–2726, 2010Controls on open water evaporation
R. J. Granger and N. Hedstrom
Title Page
Abstract Introduction
Conclusions References
Tables Figures
◭ ◮
◭ ◮
Back Close
Full Screen / Esc
Printer-friendly Version Interactive Discussion
Discussion
P
a
per
|
Dis
cussion
P
a
per
|
Discussion
P
a
per
|
Discussio
n
P
a
per
|
Bussi ´eres, N. and Granger, R. J.: Estimation of water temperature of large lakes in cold climate regions during the period of strong coupling between water and air temperature fluctuations, J. Atmos. Oceanic Technol., 24, 285–296, doi:10.1175/JTECH1973.1, 2007.
Granger, R. J.: Potential for the use of remote sensing with the numerical analysis of advec-tion in the estimate of lake evaporaadvec-tion, in: Applicaadvec-tions of Remote Sensing in Hydrology,
5
edited by: Pietroniro, A., Granger, R. J., and Pultz, T. J., Proceedings of the 4th International Workshop, Santa Fe, NM, 4–7 November 1998, 105–112, 2000.
Granger, R. J. and Hedstrom, N.: Measuring and Modelling Evaporation from Crean Lake, PANP: Interim report, 2005 field season, Report submitted to Prince Albert National Park, 8 pp., 2006.
10
Granger, R. J. and Hedstrom, N.: Modelling hourly rates of lake evaporation, Hydrol. Earth Syst. Sci. Discuss., 7, 2727-2746, doi:10.5194/hessd-7-2727-2010, 2010,
http://www.hydrol-earth-syst-sci-discuss.net/7/2727/2010/.
Horst, T. W.: A simple formula for attenuation of eddy fluxes measured with first order response scalar sensors, Bound.-Lay. Meteorol., 94, 517–520, 1997.
15
Kaimal, J. C. and Finnigan, J. J.: Atmospheric Boundary Layer Flows – their Structure and Measurement, Oxford University Press, New York, 289 pp., 1994.
Liu, H., Zhang, Y., Liu, S., Jiang, H., Sheng, L., and Williams, Q. L.: Eddy covariance measure-ments of surface energy budget and evaporation in a cool season over southern open water in Mississippi, J. Geophys. Res., 114, D04110, doi:10.1029/2008JD010891, 2009.
20
Massman, W. J.: A simple method for estimating frequency response corrections for eddy covariance systems, Agr. Forest Meteorol., 104, 185–198, 2000.
Webb, E. K., Pearman, G. I., and Leuning, R.: Correction of flux measurements for density effects due to heat and water vapour transfer, Q. J. Roy. Meteorol. Soc., 106, 85–100, 1980. Weisman, R. N. and Brutsaert, W.: Evaporation and cooling of a lake under unstable
atmo-25
HESSD
7, 2709–2726, 2010Controls on open water evaporation
R. J. Granger and N. Hedstrom
Title Page
Abstract Introduction
Conclusions References
Tables Figures
◭ ◮
◭ ◮
Back Close
Full Screen / Esc
Printer-friendly Version Interactive Discussion
Discussion
P
a
per
|
Dis
cussion
P
a
per
|
Discussion
P
a
per
|
Discussio
n
P
a
per
(a)
(b)
Fig. 1. Study Lakes showing location of instrument towers and water temperature profiles(a)
HESSD
7, 2709–2726, 2010Controls on open water evaporation
R. J. Granger and N. Hedstrom
Title Page
Abstract Introduction
Conclusions References
Tables Figures
◭ ◮
◭ ◮
Back Close
Full Screen / Esc
Printer-friendly Version Interactive Discussion
Discussion
P
a
per
|
Dis
cussion
P
a
per
|
Discussion
P
a
per
|
Discussio
n
P
a
per
|
-2 -1 0 1 2
175.0 175.5 176.0 176.5 177.0
Julian Date, 2006
S
ta
b
ility
In
d
ic
a
to
r
water land
HESSD
7, 2709–2726, 2010Controls on open water evaporation
R. J. Granger and N. Hedstrom Title Page Abstract Introduction Conclusions References Tables Figures ◭ ◮ ◭ ◮ Back Close
Full Screen / Esc
Printer-friendly Version Interactive Discussion Discussion P a per | Dis cussion P a per | Discussion P a per | Discussio n P a per (a)
y = 0.02x + 90.68 R2 = 0.01
0 50 100 150 200 250 300 350 400
-200 0 200 400 600 800 1000 Net Radiation, W/m²
LE
, W
/m
²
(b)
y = 0.57x2 + 19.16x
R2 = 0.66
0 50 100 150 200 250 300 350 400
0 2 4 6 8 10
Wind Speed, m/s
LE , W /m ² 12 (c)
y = 0.62x2 - 4.18x + 81.82 R2 = 0.20
0 50 100 150 200 250 300 350 400
-15 -10 -5 0 5 10
Land-Water Temperature Contrast, °C
LE
, W
/m
²
(d)
y = -82.53x2 + 193.46x R2 = 0.11
0 50 100 150 200 250 300 350 400
0 0.5 1 1.5
Water-Land Vapour Pressure Contrast, kPA
LE
, W
/m
²
2
HESSD
7, 2709–2726, 2010Controls on open water evaporation
R. J. Granger and N. Hedstrom
Title Page
Abstract Introduction
Conclusions References
Tables Figures
◭ ◮
◭ ◮
Back Close
Full Screen / Esc
Printer-friendly Version Interactive Discussion
Discussion
P
a
per
|
Dis
cussion
P
a
per
|
Discussion
P
a
per
|
Discussio
n
P
a
per
|
y = 0.94x + 2.23
0 0.5 1 1.5 2 2.5 3 3.5 4 4.5
-1.5 -1 -0.5 0 0.5 1 1.5
Tsf(lake)-Tsf(land), oC
U
(l
ake)
-U
(l
an
d
),
m
/s
HESSD
7, 2709–2726, 2010Controls on open water evaporation
R. J. Granger and N. Hedstrom
Title Page
Abstract Introduction
Conclusions References
Tables Figures
◭ ◮
◭ ◮
Back Close
Full Screen / Esc
Printer-friendly Version Interactive Discussion
Discussion
P
a
per
|
Dis
cussion
P
a
per
|
Discussion
P
a
per
|
Discussio
n
P
a
per
Crean Lake
-100 0 100 200 300 400 500 600 700 800
140 190 240 290 340
Julian Day, 2007
C
u
mu
la
ti
v
e
F
lu
x
, mm e
q
.
-5 0 5 10 15 20 25
T
em
p
er
at
u
re,
C
Evap H Rn Tsf (lake) Ta (land)
HESSD
7, 2709–2726, 2010Controls on open water evaporation
R. J. Granger and N. Hedstrom
Title Page
Abstract Introduction
Conclusions References
Tables Figures
◭ ◮
◭ ◮
Back Close
Full Screen / Esc
Printer-friendly Version Interactive Discussion
Discussion
P
a
per
|
Dis
cussion
P
a
per
|
Discussion
P
a
per
|
Discussio
n
P
a
per
|
Landing Lake
-100 0 100 200 300 400
160 190 220 250 280
Julian Day, 2007
0 5 10 15 20 25
T
em
p
er
at
u
re,
C
Evap H Rn Tsf (lake) Ta (land)