Climate and the Timing of Imported Cases as
Determinants of the Dengue Outbreak in
Guangzhou, 2014: Evidence from a
Mathematical Model
Qu Cheng1,2☯, Qinlong Jing3,4☯, Robert C. Spear2, John M. Marshall5, Zhicong Yang3
*, Peng Gong1,6*
1Ministry of Education Key Laboratory for Earth System Modeling, Center for Earth System Science, Tsinghua University, Beijing, People’s Republic of China,2Environmental Health Sciences, School of Public Health, University of California, Berkeley, Berkeley, California, United States of America,3Department of Infectious Diseases, Guangzhou Center for Disease Control and Prevention, Guangzhou, People’s Republic of China,4Department of Medical Statistics and Epidemiology, School of Public Health, Sun Yat-Sen University, Guangzhou, People’s Republic of China,5Divisions of Biostatistics and Epidemiology, School of Public Health, University of California, Berkeley, Berkeley, California, United States of America,6Joint Center for Global Change Studies, Beijing, People’s Republic of China
☯These authors contributed equally to this work.
*[email protected](ZY);[email protected](PG)
Abstract
As the world’s fastest spreading vector-borne disease, dengue was estimated to infect more than 390 million people in 2010, a 30-fold increase in the past half century. Although considered to be a non-endemic country, mainland China had 55,114 reported dengue cases from 2005 to 2014, of which 47,056 occurred in 2014. Furthermore, 94% of the indig-enous cases in this time period were reported in Guangdong Province, 83% of which were in Guangzhou City. In order to determine the possible determinants of the unprecedented outbreak in 2014, a population-based deterministic model was developed to describe den-gue transmission dynamics in Guangzhou. Regional sensitivity analysis (RSA) was adopted to calibrate the model and entomological surveillance data was used to validate the mosquito submodel. Different scenarios were created to investigate the roles of the tim-ing of an imported case, climate, vertical transmission from mosquitoes to their offsprtim-ing, and intervention. The results suggested that an early imported case was the most important factor in determining the 2014 outbreak characteristics. Precipitation and temperature can also change the transmission dynamics. Extraordinary high precipitation in May and August, 2014 appears to have increased vector abundance. Considering the relatively small number of cases in 2013, the effect of vertical transmission was less important. The earlier and more frequent intervention in 2014 also appeared to be effective. If the interven-tion in 2014 was the same as that in 2013, the outbreak size may have been over an order of magnitude higher than the observed number of new cases in 2014.The early date of the first imported and locally transmitted case was largely responsible for the outbreak in 2014, but it was influenced by intervention, climate and vertical transmission. Early detection and
OPEN ACCESS
Citation:Cheng Q, Jing Q, Spear RC, Marshall JM, Yang Z, Gong P (2016) Climate and the Timing of Imported Cases as Determinants of the Dengue Outbreak in Guangzhou, 2014: Evidence from a Mathematical Model. PLoS Negl Trop Dis 10(2): e0004417. doi:10.1371/journal.pntd.0004417
Editor:Samuel V. Scarpino, Santa Fe Institute, UNITED STATES
Received:October 12, 2015
Accepted:January 10, 2016
Published:February 10, 2016
Copyright:© 2016 Cheng et al. This is an open access article distributed under the terms of the Creative Commons Attribution License, which permits unrestricted use, distribution, and reproduction in any medium, provided the original author and source are credited.
response to imported cases in the spring and early summer is crucial to avoid large out-breaks in the future.
Author Summary
Dengue has not been considered to be a major problem in China since it is recognized as an imported disease and only 8,058 cases were reported from 2005 to 2013. However, in 2014 alone, 47,056 new cases were reported. In this study, a mathematical model was developed to determine the possible cause of this outbreak. The most important parame-ters found to underlie the pattern of a small outbreak in 2013 and a much larger one in 2014 was the timing of the first imported and locally transmitted case. The importance of precipitation and temperature was also confirmed by the simulation results under different climate scenarios. The model also suggests that the earlier and more frequent control interventions in 2014 targeting immature mosquitoes, such as emptying water containers, and adult control, were effective in preventing larger outbreaks. Furthermore, more atten-tion should be paid to imported cases occurring between March 1stand July 1stto prevent early and prolonged transmission. Without early detection and response, the final out-break size might otherwise be an order of magnitude or more the size when the imported case occurred outside this time period.
Introduction
Dengue is a febrile illness caused by the dengue virus which is further classified into 4 serotypes (DENV 1–4), and transmitted byAedes aegyptiandAedes albopictusmosquitoes. Classically, dengue virus infection produces mild flu-like fevers but can also result in lethal dengue hemor-rhagic fever (DHF) and dengue shock syndrome (DSS) when infected a second time with a dif-ferent serotype [1]. According to the World Health Organization (WHO), dengue is the fastest growing vector-borne disease in the world with only one thousand cases reported in the 1950s to more than 90 million cases in the 2000s [2]. Estimated from a systematic literature search, there were 96 million apparent dengue infections globally in 2010; however, an additional esti-mated 294 million infections were asymptomatic [3].
Dengue is believed to be an imported disease in mainland China, and 55,114 cases were reported from 2005 to 2014. Approximately 94 percent of the indigenous cases that occurred in this period were reported in Guangdong Province, and 83 percent of these Guangdong cases were in Guangzhou City [4]. In 2014, an unprecedented dengue outbreak hit Guangzhou, with 37,341 new cases contributing to 94 percent of the new cases from 2005 to 2014 in Guangzhou. The annual new cases in Guangzhou were normally lower than 150 except for the 765 in 2006, 1,249 in 2013 and 37,341 in the 2014 outbreak.
Guangzhou differs significantly from other dengue transmission areas withAe.albopictusas the sole vector rather thanAe.aegypti[5]. UnlikeAe.aegypti,Ae.albopictusadapts to the cold winter in temperate and subtropical areas by diapausing, which gives it the ability to expand to higher latitudes. Normally, the adults cannot survive the low temperature in winter, but they can produce diapause eggs when the temperature becomes lower and the day becomes shorter [6,7]. These diapause eggs will not hatch until the next spring, when the temperature and water condition become favorable again. Moreover, the vertical transmission of dengue virus inAe. albopictusis more efficient [8], with approximately 0.5 to 2.9 percent of the eggs laid by Funding:QC received financial support from the
China Scholarship Council. QJ is funded by Guangdong Natural Science Foundation (No. S2013010013637), the Collaborative innovation project of Bureau of Science and Technology of Guagnzhou Municipality (No. 201508020263), the Project of Key Medicine Discipline Construction of Guangzhou Municipality (No. 2013-2015-07), and the Bureau of Health of Guangzhou Municipality (No.20141A011057) for funding. The funders had no role in study design, data collection and analysis, decision to publish, or preparation of the manuscript.
infected mosquitoes being infected [8–10]. When the vertical infected diapause eggs develop to adults in the next spring, they have the ability to infect humans immediately without biting infected humans, even causing a significant outbreak if there were sufficient infected eggs in the past year. This pathway might allow dengue to become endemic in Guangzhou. The other possibility for dengue to be endemic is through overwintering infected adults, especially when global warming increases the temperature in the winter. However, the daily mean temperature from December to February of the 30-yr average (the coldest three months) was 14.8°C, and that of 2013 was 14.4°C. Thus the possibility for infected adults to live through the winter of 2013 is relatively low, considering that the temperature in the winter of 2013 was not abnor-mally high. Mathematical models suggest that vertical transmission can increase the endemic level of the vector population and human population significantly [11]. However,Ae. albopic-tusis less efficient in transmitting dengue virus. Typical explosive DHF epidemics have not been found in the places whereAe.albopicuspredominates overAe.aegypti, such as parts of China, the Seychelles Islands, La Reunion Island, the Maldive Islands, historically in Japan and most recently in Hawaii [12,13].
Another possible causal factor for the 2014 outbreak in Guangzhou was the abnormally high precipitation in May and August which provided more breeding sites and increased the environmental carrying capacity forAe.albopictus[14]. A third possibility was the early start-ing date of the outbreak, with the earlier imported cases occurrstart-ing in the late sprstart-ing and early summer leading to the greater final size of the epidemic as a result of the lengthened infection season before the decrease ofAe.albopictusabundance in the winter [15]. A multivariate Pois-son regression analysis of the Guangzhou outbreak data was recently published that showed the number of imported cases, minimum temperature with a one-month lag and cumulative precipitation with a three month lag predicted the outbreak in 2013 and 2014 [16]. Here we use a mathematical model rather than statistical model to further explore the factors underly-ing these outbreaks since the structure of our model is based on mechanistic factors controllunderly-ing both mosquito population dynamics and the dynamics of viral transmission explicitly and, therefore, should allow greater confidence in making predictions in the presence of environ-mental change [17].
There were 99 dengue transmission models cited in literature from 1970 to July 2012, most based mainly on the Ross-Macdonald model of malaria transmission, the classical theoretical framework for modelling mosquito-borne diseases [18]. However, the core assumptions of some of these models differs from Ross-Macdonald model in various ways. Examples include those explicitly modelling the mosquito immature stage population dynamics [19,20], the tem-perature-dependent extrinsic incubation period (EIP) [21], vertical and mechanical transmis-sion [11,22], spatial heterogeneity [15,23], control strategies [24,25], or multiple dengue virus serotypes [26]. Stochastic models [15] or agent-based models [27] have also been developed to simulate the transmission dynamics of dengue virus. To emphasize local characteristics, we included only immature stage population dynamics, vertical transmission, control strategies, and temperature-dependent adult mosquito mortality rate, biting rate and the EIP. Coinfec-tion, multiple pathogen types, and temporary immunity were not considered here since dengue virus 1 (DENV-1) has been the only predominant serotype found in Guangzhou since the 1990s [4]. Though the test results for 2014 are not ready, in the 1,249 cases of 2013, 1,243 are DENV-1 cases and only 6 are dengue virus 2 (DENV-2) cases. Spatial distributions of the mos-quitoes, and heterogeneous biting were not considered here mainly because of limited data availability.
mosquito index was used to validate the mosquito submodel. Finally, different scenarios were created to investigate the important mechanisms responsible for the unprecedented outbreak of dengue in 2014 in Guangzhou City.
Methods
Ethics statement
The study was reviewed and approved by the Ethics Committee of the Guangzhou Center for Disease Control and Prevention. All the patient data were de-identified and the data were ana-lyzed anonymously.
Study areas
Guangzhou is the capital and largest city of Guangdong Province, with a total area of 7,434 square kilometers [28] and a population of 13 million at the end of 2013 [29]. (Fig 1). It is one of the most urbanized areas and the center of China's economic growth. With the Tropic of Cancer crossing just north of the city, Guangzhou has a humid subtropical climate with hot and wet summers and mild and dry winters. The annual average temperature is approximately 21.5°C. January is the coldest month with an average temperature of 13.0°C while the hottest is July at 28.5°C. Annual rainfall varies from 1,612 to 1,909 mm, with more than 80 percent occurring between April and September [30]. The wet and warm climate is favorable for the growth ofAe.albopictus, which is the secondary vector for dengue virus in the world but the sole vector in Guangzhou [31,32]. Though dengue is not endemic in Guangzhou, more than 0.30 million travelers from dengue endemic countries such as Malaysia, Singapore, Indonesia, Thailand and India visit Guangzhou each year. These countries are also the top choices for out-bound travelers from Guangzhou [33]. Since the natural and socio-economic conditions in Guangzhou are conducive to mosquito growth and reproduction, high densities ofAe. Albopic-tustogether with dengue-infected travelers present a high potential for initiating local spread of the disease [31].
Data collection
Dengue is a notifiable disease in China which means that, once diagnosed, cases must be reported to the web-based National Notifiable Infectious Disease Reporting Information Sys-tem (NIDRIS) within 24 hours. All case reports used in this analysis were diagnosed according to the National Diagnostic Criteria for Dengue Fever (WS216-2008) published by the Chinese Ministry of Health [34]. In addition, active case detections was carried out through field inves-tigations in the communities with confirmed dengue cases [14]. Cases were then divided into indigenous and imported cases based on whether the patient traveled to a dengue endemic area and was bitten by mosquitoes there within 15 days of the onset of illness [14]. A list of daily reported new cases for 2013 and 2014, obtained from Guangzhou Center for Disease Control and Prevention (Guangzhou CDC), was used to calibrate the model. This dataset was published online in the transmission season on the website of the Health Department of Guangdong Province (http://www.gdwst.gov.cn/). There were a total of 1,249 and 37,341 reported cases for 2013 and 2014, respectively.
Monthly mosquito surveillance reports consisting of the Breteau Index (BI) and the Mos-quito Ovitrap Index (MOI) in 2013 and 2014 were also obtained from Guangzhou CDC and used to validate the mosquito submodel (S1 Table). BI is the number of positive containers withAe.albopictuslarva per 100 houses inspected, and is considered to be the best single index forAedesdensity surveillance [14]. MOI is the percentage ofAe.albopictuspositive ovitraps in all ovitraps collected from a specified area, and reflects the abundance of the adults [35].
Daily temperature, rainfall and evaporation data for Guangzhou from 2012 to 2014, which were used as inputs to the model, were downloaded from the China Meteorological Data Shar-ing Service System (CMDSSS) (http://cdc.nmic.cn/). In addition, climate data from 1985 to 2014 were also retrieved from CMDSSS to calculate 30-year daily average values.
Population data for the human submodel was obtained from the Guangdong Statistical Yearbook on China Infobank (http://www.bjinfobank.com/). This data was also used to esti-mate human birth rate and death rates in Guangzhou [36–38].
Model description
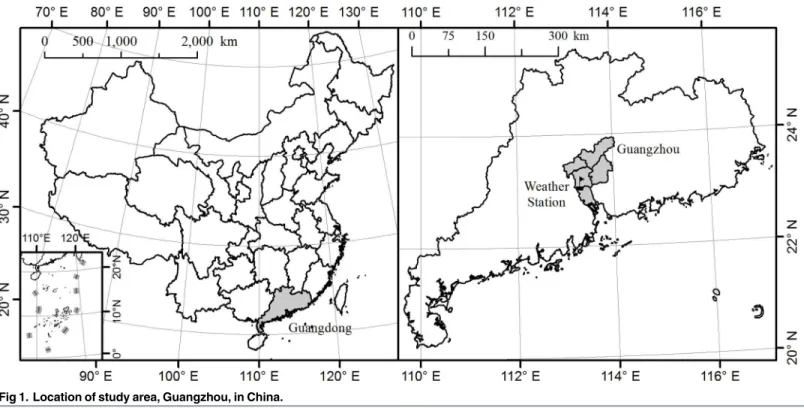
A deterministic mathematical model was developed to interpret the transmission of dengue in Guangzhou city based on the Ross-Macdonald model [39,40], which is a basic framework widely used to study the dynamic transmission of mosquito-borne diseases.Fig 2presents the structure of our model withTable 1showing the definition for each symbol in this figure. Tem-perature can influence the development rate, death rate of immature mosquitoes, average dura-tion of and number of eggs laid each gonotrophic cycle, biting rate and the EIP of dengue virus [41–43]. The form of temperature-dependent functions were based on [20,41], and the coeffi-cients were estimated from experiments onAe.albopictusstrains from Guangzhou and adja-cent areas [42,44]. Density of the larvae also plays an important role in the development rate of eggs and larvae, and the death rate of larvae. The form of density forcing rates were taken from [27]. More detailed information about the parameters, temperature or density forcing func-tions forAe.albopictusdevelopment and death rates, and the differential equations for the model can be found in theS1 File.
temperature-dependent pathogen latency inAe.albopictus. Thirdly, an element to reflect mosquitoes infected by vertical transmission was added, becauseAe.albopictushas the ability to transmit dengue virus vertically through eggs, with a filial infection rates ranging from 0.5 to 2.9% for Dengue-1 virus [8]. Fourthly, we explicitly modeled the water availability by including evapo-ration, rainfall, and maximum and minimum water level (See details inS1 File). The environ-mental carrying capacity for mosquitoes will increase when the water level rises, and the density-dependent death rate will decrease in a short period. Furthermore, a spillover effect is triggered when there is an extreme rainfall event and the water level is close to the maximum water level, resulting in a loss of immature mosquitoes. The ideal death rate of larva and the development rate of eggs and larva depend only on temperature. However, the real death rate also depend on the water-level or density of the larva (SeeS1 Filefor more information). Simi-larly, the control intervention to empty water containers can also remove a fraction 1-μiof
water and immature mosquitoes, while ultra-low-volume (ULV) aerosol applications of insec-ticides can kill a fraction 1-μaof adult mosquitoes. In addition, temperature-dependent biting
rate and the number of eggs per gonotrophic cycle were incorporated to better represent the effects of climate on mosquito population dynamics. Since dengue is still considered as a non-endemic disease in China, which means new autochthonous cases occur only after imported Fig 2. Flow chart for the transmission of dengue virus between mosquitoes and humans.Blue Greek letters indicate constant rates which need to be estimated and black letters for constant rates estimated from [36–38]. Yellow English letters indicate temperature and density-dependent functions. Red symbols indicate only temperature dependency and green rectangles on the left side indicate the state variables affected by the spillover effect.
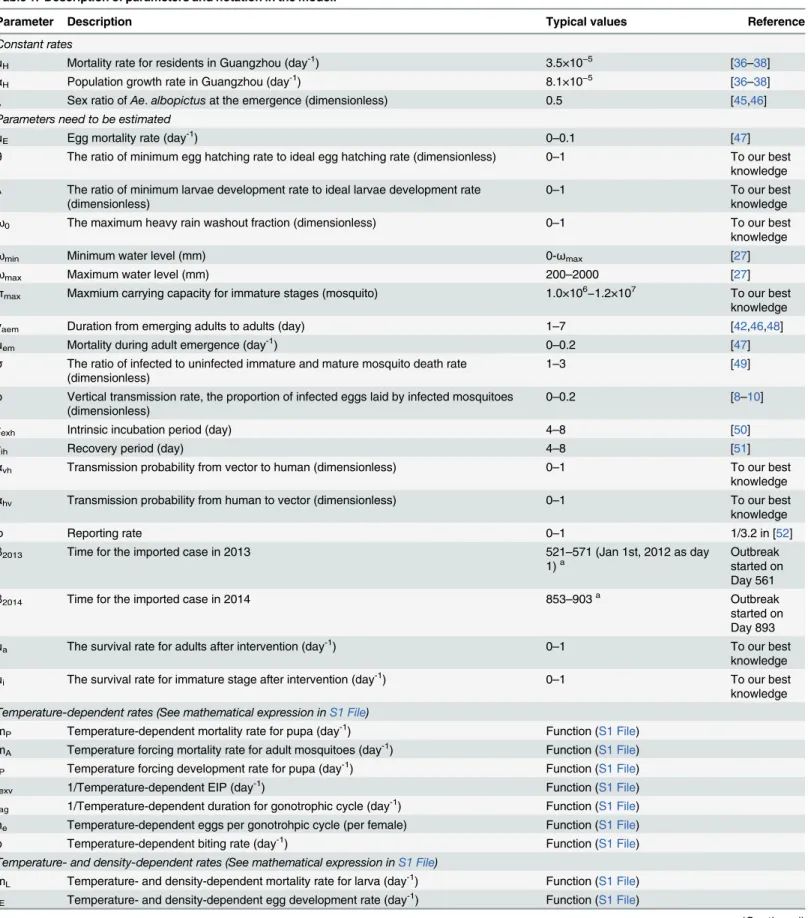
Table 1. Description of parameters and notation in the model.
Parameter Description Typical values Reference
Constant rates
μH Mortality rate for residents in Guangzhou (day-1) 3.5×10⁻⁵ [36–38]
αH Population growth rate in Guangzhou (day-1) 8.1×10⁻⁵ [36–38]
ξ Sex ratio ofAe.albopictusat the emergence (dimensionless) 0.5 [45,46]
Parameters need to be estimated
μE Egg mortality rate (day-1) 0–0.1 [47]
θ The ratio of minimum egg hatching rate to ideal egg hatching rate (dimensionless) 0–1 To our best knowledge
λ The ratio of minimum larvae development rate to ideal larvae development rate (dimensionless)
0–1 To our best
knowledge
ω0 The maximum heavy rain washout fraction (dimensionless) 0–1 To our best
knowledge
ωmin Minimum water level (mm) 0-ωmax [27]
ωmax Maximum water level (mm) 200–2000 [27]
πmax Maxmium carrying capacity for immature stages (mosquito) 1.0×10⁶−1.2×10⁷ To our best knowledge
γaem Duration from emerging adults to adults (day) 1–7 [42,46,48]
μem Mortality during adult emergence (day-1) 0–0.2 [47]
σ The ratio of infected to uninfected immature and mature mosquito death rate (dimensionless)
1–3 [49]
ρ Vertical transmission rate, the proportion of infected eggs laid by infected mosquitoes (dimensionless)
0–0.2 [8–10]
τexh Intrinsic incubation period (day) 4–8 [50]
τih Recovery period (day) 4–8 [51]
αvh Transmission probability from vector to human (dimensionless) 0–1 To our best
knowledge
αhv Transmission probability from human to vector (dimensionless) 0–1 To our best
knowledge
φ Reporting rate 0–1 1/3.2 in [52]
β2013 Time for the imported case in 2013 521–571 (Jan 1st, 2012 as day
1)a
Outbreak started on Day 561
β2014 Time for the imported case in 2014 853–903a Outbreak
started on Day 893
μa The survival rate for adults after intervention (day-1) 0–1 To our best
knowledge
μi The survival rate for immature stage after intervention (day-1) 0–1 To our best
knowledge
Temperature-dependent rates (See mathematical expression inS1 File)
mP Temperature-dependent mortality rate for pupa (day-1) Function (S1 File)
mA Temperature forcing mortality rate for adult mosquitoes (day-1) Function (S1 File)
fP Temperature forcing development rate for pupa (day-1) Function (S1 File)
fexv 1/Temperature-dependent EIP (day-1) Function (S1 File)
fag 1/Temperature-dependent duration for gonotrophic cycle (day-1) Function (S1 File)
ne Temperature-dependent eggs per gonotrohpic cycle (per female) Function (S1 File)
b Temperature-dependent biting rate (day-1) Function (S1 File)
Temperature- and density-dependent rates (See mathematical expression inS1 File)
mL Temperature- and density-dependent mortality rate for larva (day-1) Function (S1 File)
fE Temperature- and density-dependent egg development rate (day-1) Function (S1 File)
cases, an imported case input was added to the system at dayβ2013andβ2014(January 1st, 2012
as day 1) to initiate the outbreak in 2013 and 2014, respectively. Instead of using the date of the first reported imported case, we treated the timing of the first imported case as a parameter, since the outbreak may be started by an unreported or asymptomatic case. We only added the first imported case to the system and left out all the other subsequent imported cases, because it was a small number when compared with the number of infectious people after the rapid local transmission began, and was reasonable to be ignored. And becauseAe.albopictuswill survive adverse winter temperatures as diapausing eggs, the development rate from eggs to larva is assumed to be zero from late October to early March [53]. The reporting rateφwas
also included to account for the asymptomatic and unreported dengue infections.
In summary, a SEI model was used for the vector submodel and SEIR (Susceptible, Exposed, Infected and Recovered) model for the human submodel (Fig 2). Five different life stages for mosquitoes were considered: three aquatic stages (E, eggs; L, larva; P, pupa), one emerging adult stage (Ae), and one biting and reproductive adult stage (A). Subscripts u and i were used to represent uninfected and vertical infected aquatic phases and emerging adults; while s, e, and i were used to denote the populations of susceptible, exposed, and infected adults. Analo-gously, the human population was divided into four subclasses: Hs, He, Hi, and Hr, which stands for susceptible, exposed, infected and recovered humans, respectively.
All the analyses were conducted in R 3.2.0 [54], and the differential equations in the model were solved by R package deSolve [55]. The model was run over the period 2012 to 2014, though the focus is on simulating the dengue outbreak in 2013 and 2014. The mosquito abun-dance for only the first simulated year is affected by the initial value for eggs, and the following years showed no memories from previous years [56], so an extra year was needed to achieve a stable mosquito population for 2013 and 2014. However, for simplicity, we assumed that there was no imported cases in 2012. The only possibility for dengue cases in 2012 to affect the next two years was through vertical transmission. Taking into account the low vertical transmission rate and the small number of dengue cases in 2012 (139 cases), we assumed that the influence of 2012 on the next two years was negligible.
Model calibration
Typical of the class of mechanistic disease transmission models used here, there are a large number of parameters with substantial uncertainty in their values. In addition, in this analysis we place considerably more confidence in the timing and pattern of the field data describing human cases and mosquito infection and abundance in Guangzhou in 2013 and 2014 than in the precise numbers reported on any day. As a result, we chose to address the issue of parame-ter estimation using a strategy that has been called regional sensitivity analysis or RSA [57]. This approach begins with the specification of a region of parameter space thought to include the range of feasible values of each parameter with high probability (As the typical value for each parameter inTable 1). Monte Carlo simulation runs are then conducted to assess the Table 1. (Continued)
Parameter Description Typical values Reference
fL Temperature- and density-dependent larvae development rate (day-1) Function (S1 File)
Some of the parameters do not occur in theflow chart, only in the equations, seeS1 Filefor detailed information.
aThe range of timing of the
first imported cases equals to the beginning time of local transmission–15 days (Extrinsic incubation time + intrinsic incubation time in summer)±25 days.
performance of the model over this parameter space. Here we define this space by specifying the univariate marginal distributions of the model parameters need to be estimated, as given in
Table 1, each of which we assume to be independent.
Classification criteria are then defined and applied to the output of the model to determine if a particular realization captures the essential features of the pattern of daily case reports.Fig 3shows the specific criteria for the 2013 and 2014 Guangzhou dengue case reports (See the detailed criteria inS1 File). If a particular model run results in a case report trajectory passing through all six of the shaded windows, the model is classified as a“pass”, that is as having ade-quately mimicked the pattern of the field data used for calibration.
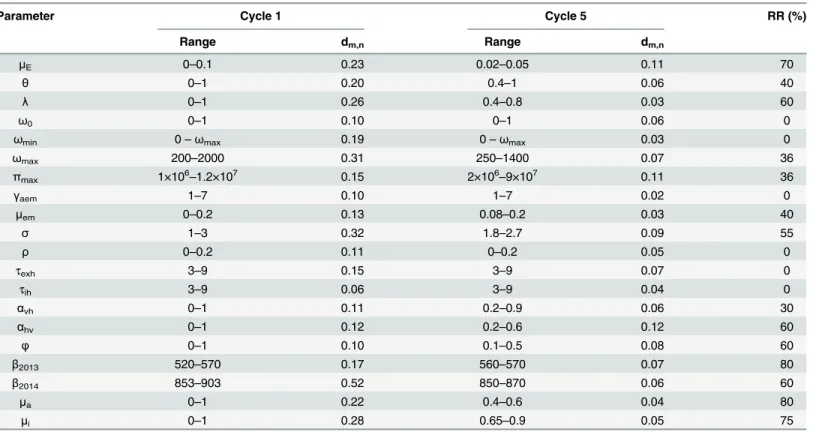
Passing and failing parameter vectors are then collected for subsequent analysis. Usually the first simulation experiments using the RSA approach result in a very small fraction of passes and these vectors extend over almost the entire range of any of the univariate prior distributions. This is a result of the fact that there are many parameter combinations that can produce the same pat-terns of model response and their correlation structure is usually very complex in the high dimen-sional parameter space being sampled. Non-uniqueness of model parameterization of this sort is an issue about which there is a substantial literature particularly in the field of hydrology [57]. In the present case, 74 passing parameter vectors were obtained in 410,594 initial simulation runs which we term Cycle 1. In theS2 Filethe sample cumulative distribution functions are shown for each parameter for passes and fails. As shown there, some parameter distributions that differ little between passes and fails which gives little clue as to parts of the range of that parameter where passes are more likely. The value of dm,n, the Kolomogorov statistic, is a measure of the maximum
difference between the two distributions and can be used as a rough index of sensitivity. Very large differences can be seen for some parameters in Cycle 1, for exampleβ2013,μi,μemandωmax.
Fig 3. The epidemic curve and passing criteria for Guangzhou Dengue outbreaks in 2013 and 2014.Black dots represent the amount of daily new cases, and the red shaded rectangles show the time and amount window for the eight criteria (See the detailed descriptions for these criteria inS1 File).
In view of the very low pass rate of the first set of simulations, we chose to use the outcome of the Cycle 1 experiments to seek a subspace in which passing parameters were more likely to be found. This was done by trimming the ranges of parameters with large values of dm,n.
Trim-ming was an ad hoc procedure based on trimTrim-ming the range of parameters with few passes at either the high or low end of the sample distribution function of passes. A total of 4 trimming cycles were conducted resulting in a pass rate of 3.19% in the final subspace, Space 5, an increase of about 175 times over the initial space, Space 1. The marginal distributions of the parameters in Space 5 now show much reduced differences between passing and failing distri-butions as discussed below. We regard a highly trimmed parameter range and a large decrease in dm,nbetween spaces 1 and 5 as evidence of the importance of a parameter in producing
sim-ulations meeting the pass criteria. However, we note that a parameter may be very important, but if initial uncertainty in its value is small, that is the prior range is narrow, there may be little difference in the marginal distributions under passes versus fails. A second situation in which a parameter can show little difference in its pass/fail marginal distributions yet be important can occur if there are interactions with other parameters not reflected in the marginal distributions. The pairwise correlation matrix can give some clues to such situations and will be discussed below for Space 1 and Space 5. (SeeS2 Tablefor the pairwise correlation matrices for parameter values Cycle 1 and Cycle5)
Fig 4summarizes the case report data for 2013 and 2014 and shows the envelope of 637 passing simulation trajectories from the Space 5 parameter distributions. The daily number of Fig 4. Trajectories for daily new cases of the 637 passing parameter sets in Cycle 5.Black dots indicate the number of daily new cases from
Guangzhou CDC, while gray lines are model outputs and red line is the median for all outputs. Blue and red vertical dash lines stand for washout and intervention days, respectively. Blue shaded area for the 90 percent interval for all 637 simulations.
new cases output by the model was calculated as the number of individuals entering the com-partment Hi times the reporting rateφ. The median final epidemic size for 2013 and 2014 was
1,044 and 30,863, respectively, for the 637 passing parameter sets of Cycle 5. Although the envelope of passing simulations contains the observed peak values in both years, the median passing peaks were 16% and 17% lower than the observed peaks respectively.
Fig 5shows the Cycle 5 simulation results and field data for larvae and adult mosquitoes. We aggregated the monthly average amount of larva and adults from daily model output of the 637 passing simulations, then normalized them to 0 to 1 and plotted them against the normal-ized BI and MOI data from Guangzhou CDC. Mosquito surveillance data in 2012 was not used in the validation, because the mosquito abundance in the first simulated year can be affected by the initial value for eggs. Entomological surveillance data recorded only the absence/presence not the number ofAe.albopictusin each container, so it is only a proxy of the abundance. The minimum, maximum, mean and standard deviation for Pearson’s correlation between scaled model output larva amount and BI were 0.76, 0.86, 0.82, and 0.02, respectively. And the corre-lation for scaled model output adult amount and MOI ranged from 0.65 to 0.80, with a mean of 0.74 and standard deviation of 0.03. The BI and MOI data were not used in calibration but the patterns produced by the model, as shown inFig 5, confirm that the model is producing realistic patterns of mosquito abundance over time.
Table 2shows the Space 1 versus Space 5 marginal distribution comparisons with RR (range reduction) denoting the fractional reduction of the range in each parameter. The ranges of six parameters were unaltered and nine were reduced by 50% or more of their initial range. The nine fall into three types of parameters, those associated with vector population dynamics and infection (μE,λ,σ, andαhv), those related to the timing and reporting of imported cases (β2013,
β2014, andφ), and those associated with the effectiveness of mosquito control interventions (μa
andμi).
Fig 5. Mosquito submodel patterns.The scaled 637 simulated results and field data for (a) larva and (b) adults. Gray lines show model output, red lines median output, and dark blue points show mosquito surveillance data acquired from Guangzhou CDC.
The pairwise correlation matrices for the passing parameter distributions in Space 1 and Space 5 are shown inS2 Table. For Space 1, the same 9 parameters with large range reductions show high correlations with one or more of others in that group. There is also a very high cor-relation betweenωminandωmax, an artifact that is imposed by the model structure. In the
Space 5 correlations, all of the high values from Space 1 are lower, and most very much lower, as might be expected. However, some new correlations emerge, notably withπmax, the
maxi-mum carrying capacity for immature stages of the mosquito. These correlations are withμem,
mortality during adult emergence, and the human to vector,αhv, and vector to human,αvh, transmission probabilities.
We do not believe we have access to additional field data or other information which will allow significant further reduction in Space 5 or point to other areas in the parameter space that might suggest alternative underlying processes to be driving the observed patterns of behavior of the system. Hence, parameter vectors meeting the passing criteria sampled from Space 5 will be used in the subsequent explorations of the key processes underlying the 2014 epidemic.
Simulation experimental results
The year 2013 differed from 2014 in several aspects, notably the date of imported cases (β2013
andβ2014), climate, the time and frequency of the interventions, and the number of eggs infected by vertical transmission from the previous year.
We first explore the timing of imported cases, which is not the real timing of the first imported case reported to the NIDRIS, but a parameter we need to estimate, denoting the first imported case that starts the local transmission. The outbreak in 2014 started at June 11th, and
Table 2. The range and dm,nfor each parameter in Cycle 1 and Cycle 5, and the RR from Cycle 1 to Cycle 5.
Parameter Cycle 1 Cycle 5 RR (%)
Range dm,n Range dm,n
μE 0–0.1 0.23 0.02–0.05 0.11 70
θ 0–1 0.20 0.4–1 0.06 40
λ 0–1 0.26 0.4–0.8 0.03 60
ω0 0–1 0.10 0–1 0.06 0
ωmin 0–ωmax 0.19 0–ωmax 0.03 0
ωmax 200–2000 0.31 250–1400 0.07 36
πmax 1×106–1.2×10⁷ 0.15 2×10⁶–9×10⁷ 0.11 36
γaem 1–7 0.10 1–7 0.02 0
μem 0–0.2 0.13 0.08–0.2 0.03 40
σ 1–3 0.32 1.8–2.7 0.09 55
ρ 0–0.2 0.11 0–0.2 0.05 0
τexh 3–9 0.15 3–9 0.07 0
τih 3–9 0.06 3–9 0.04 0
αvh 0–1 0.11 0.2–0.9 0.06 30
αhv 0–1 0.12 0.2–0.6 0.12 60
φ 0–1 0.10 0.1–0.5 0.08 60
β2013 520–570 0.17 560–570 0.07 80
β2014 853–903 0.52 850–870 0.06 60
μa 0–1 0.22 0.4–0.6 0.04 80
μi 0–1 0.28 0.65–0.9 0.05 75
peaked around October 1st, with a time interval of 112 days, while the smaller outbreak in 2013 began at July 14th, and peaked around October 19th, with an interval of 97 days. If the force of infection was the same for these two years, the final size of epidemic in 2014 would be signifi-cantly higher than that in 2013 on this basis alone. Without interventions, the peak occurs when the temperature drops to cause a sufficient combination of a decrease in biting rate and an increase in the mosquito death rate. Appropriately timed interventions reduce the abun-dance of mosquitoes, thus reducing the force of infection which results in an earlier peak. To make the two years comparable, we changed the date of the first imported case in 2014,β2014,
in the 637 passing parameter sets toβ2014+ (Peak time 2013—β2013) (Scenario Postpone 2014).
By doing this, we made the time interval between the imported case and the peak in 2014 equal to that in 2013. The case report trajectory for each run was recorded (Fig 6A). Then in another scenario (Scenario Advance 2013), we changed theβ2013toβ2013–(Peak time 2014—β2014), to attempt to produce an outbreak in 2013 with a size similar to the observed number in 2014 (Fig 6B). Furthermore, to investigate the relationship between the date of imported cases and the final epidemic size further, we kept all the other parameters the same as in the 637 passing Fig 6. Trajectories of daily new cases under different scenarios.(A) Postponing the date of imported case in 2014; (B) advancing the date of imported case in 2013; (C) setting the intervention in 2014 to the same as that in 2013; (D) removing all the infected eggs at the beginning of 2014; (E) advancing the date of imported case in 2013 and removing all the infected eggs at the beginning of 2014; and (F) trajectories of the final epidemic size for 2014 after changing the date of imported case between March 1stand November 30th. Black dots indicate for the daily reported case in 2013 and 2014. Gray lines
indicate the trajectories for each simulation. Red lines indicate for the median and blue shaded area for the 90 percent interval for all 637 simulations.
sets, and only changedβ2014in each set to integers between Day 791 and 1066, that is from
March 1st, 2014 to November 30th, 2014 (Scenario Change importing dates), and recorded the final epidemic size for each run (Fig 6F).
The results of these experiments are shown inFig 6. When the time interval between the imported case and the peak in 2014 was changed to match that in 2013, only 30 parameter sets (4.7% of the original 637) mimicked the pattern of the outbreak in both years. The median final epidemic size of 2014 dropped to 1,474, similar to that of 2013 (Fig 6A). And when the time inter-val between the imported case and the peak in 2013 was increased to the same as that in 2014, none of the 637 parameter sets produced passing behaviors. As shown inFig 6B, after the change, the peak number of cases was significantly higher in both years, with new median final outbreak sizes of 158,889, and 137,003 for 2013 and 2014, respectively. In summary, postponing the date of the import case in 2014 produces an outbreak whose scale is similar to that of 2013, and advanc-ing the date of the import case in 2013 produces an outbreak even worse than observed in 2014. In addition, since all other parameters were unchanged except forβ2013, the larger than observed outbreak in 2014 is attributable to vertical transmission, that being the only way that the situation in 2013 can influence that in 2014. A separate scenario was created, still by advancingβ2013, but removing all infected eggs in the system at the beginning of 2014, as discussed below.
The final experiment on the timing of imported cases involved holding all parameters the same as in the 637 passes, except that of the date of imported case which was varied from March 1stto November 30th. The final epidemic size for each run is plotted inFig 6Fand shows that when the first imported case occurs on April 18th, the median final epidemic size was the highest at 60,158. The final epidemic size became stable after July 1stat approximately 1,350, similar to the observed size in 2013. These experiments clearly suggest that the date of the first imported cases was a crucial determinant of the severity of the 2014 epidemic.
However, the force of infection was not the same in 2013 and 2014. It is affected by mos-quito abundance, biting rate, transmission probability from vector to human and transmission probability from human to vector. Though we assumed the transmission probabilities were the same for 2013 and 2014 (αhvandαvh), the biting rate depends on temperature and the mos-quito abundance depends on both temperature and precipitation. Hence, different scenarios were created to study the role of climate of the variations in climate depicted inFig 7. Fig 7. (A) Monthly average temperature; and (B) monthly accumulated precipitation for Guangzhou in 2012 to 2015 and the 30-year average.
Experiments were conducted in which the precipitation, temperature, and evaporation data of 2014 were replaced by data of 2012, 2013 or of the 30-yr average. Since the temperature in 2014 did not differ significantly from that in other years, while the precipitation in May and August 2014 were much higher, we also ran simulations with actual temperature and evapora-tion in 2014, but scaled the precipitaevapora-tion to 30 year average.
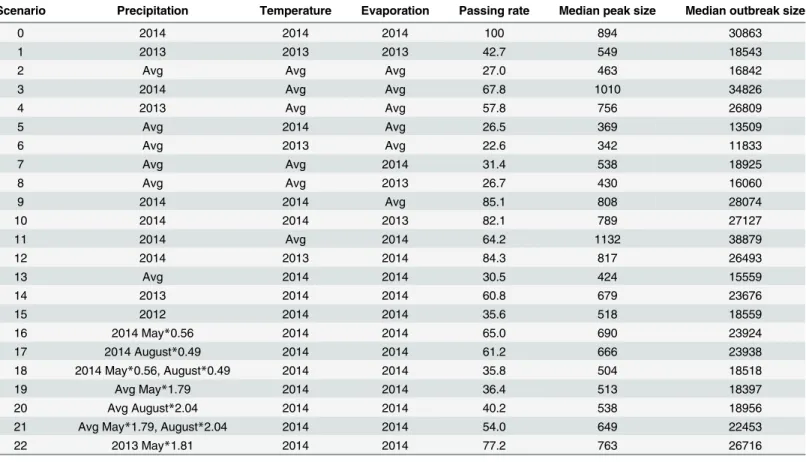
The new case trajectory for the real climate data was treated as baseline here, so the passing rate was 100 percent for the 637 parameter sets.Table 3shows the results of the various experi-ments. As can be seen, the passing rate was relatively low, at only about 28 percent, when 30 year average precipitation was used to replace the real 2014 data (Scenario 2, 5, 6, 7, 8, and 13). Furthermore, the median peak size and final epidemic size were significantly lower than base-line. When the 2014 precipitation was used (Scenario 3, 9, 10, 11 and 12), the passing rate was around 65 percent but it was more than 80 percent when the 2013 or 2014 temperature was used. The median peak outbreak size was higher than baseline when 2014’s precipitation and average temperature were combined together (Scenario 3 and 11). The maximum difference between precipitation in 2014 and the 30-year average occurred in May and August, so we scaled the precipitation in these two months to their 30-year average. The passing rates were 65.0, 61.2 and 35.8 percent when we scaled only May, only August and both, respectively (Sce-nario 16, 17, and 18). When comparing Sce(Sce-nario 19, 20, 21 with 13, higher passing rate and average outbreak size are observed as a result of increasing the rainfall in May and August above the 30-year average. Rainfall in August seems to be slightly more important.
Table 3. Passing rates, median peak sizes, and median final epidemic sizes under different climate scenario for 2014.
Scenario Precipitation Temperature Evaporation Passing rate Median peak size Median outbreak size
0 2014 2014 2014 100 894 30863
1 2013 2013 2013 42.7 549 18543
2 Avg Avg Avg 27.0 463 16842
3 2014 Avg Avg 67.8 1010 34826
4 2013 Avg Avg 57.8 756 26809
5 Avg 2014 Avg 26.5 369 13509
6 Avg 2013 Avg 22.6 342 11833
7 Avg Avg 2014 31.4 538 18925
8 Avg Avg 2013 26.7 430 16060
9 2014 2014 Avg 85.1 808 28074
10 2014 2014 2013 82.1 789 27127
11 2014 Avg 2014 64.2 1132 38879
12 2014 2013 2014 84.3 817 26493
13 Avg 2014 2014 30.5 424 15559
14 2013 2014 2014 60.8 679 23676
15 2012 2014 2014 35.6 518 18559
16 2014 May*0.56 2014 2014 65.0 690 23924
17 2014 August*0.49 2014 2014 61.2 666 23938
18 2014 May*0.56, August*0.49 2014 2014 35.8 504 18518
19 Avg May*1.79 2014 2014 36.4 513 18397
20 Avg August*2.04 2014 2014 40.2 538 18956
21 Avg May*1.79, August*2.04 2014 2014 54.0 649 22453
22 2013 May*1.81 2014 2014 77.2 763 26716
Avg, 30-yr average precipitation, temperature or evaporation.
All the results suggest that the precipitation in 2014 played an important role in forming the outbreak, especially rainfall in May and August. However, the temperature in 2014 was lower than average in the spring and winter months, thus acting as a protective factor. That is, if the temperature in 2014 had been higher, the average outbreak size would have been higher as well.
The peak time of daily new cases is clearly sensitive to the date of interventions and the sim-ulation results suggests that the interventions are very effective. The most common interven-tions in Guangzhou were emptying water containers and ULV spraying of adulticide, both conducted at neighborhood level and organized by neighborhood committee. Emptying water containers reduces the abundance of the immature stage, water level and environmental carry-ing capacity, thereby reduccarry-ing adult abundance. ULV spraycarry-ing of insecticide decreases the abundance of adults almost instantly. With a reduced vector to human ratio, the force of infec-tion decreases while the recovery rate remains the same resulting in an earlier peak. The inter-ventions in 2013 took place every Friday from October 9thto November 10th, while in 2014 on every Friday from September 24thto November 30th, as well as on July 25th, August 15th, Sep-tember 4thand 28th, and October 8th.
To determine the effectiveness of these interventions, we set interventions in 2014 the same as those in 2013 and recorded the trajectories (Scenario Change intervention dates). The inter-vention in 2013 took place later and has a much lower repetition frequency. No passes occurred after the changes, because the median peak size and overall outbreak size increased drastically to 21,808 and 843,430 respectively (Fig 6C), approximately 27 times the baseline value and 23 times the actual reported cases in 2014. The new peak time was October 12th, almost 15 days later than the observed peak, which again shows the importance of the time interval between the imported case and the peak.
In addition, the filial infection rate can also change the characteristic of an outbreak. To investigate the importance of vertical transmission, the number of infected eggs (Evi) was set to zero at the beginning of 2014 (Scenario Remove Evi), because this is the only way that the epi-demic in 2013 can influence that in 2014. This change resulted in 490 passing simulations out of 637 runs. The median of peak size and outbreak size were 778 and 2,792, respectively, only slightly lower than the baseline (Fig 6D). In addition, when we investigated the role of timing of the imported case and changedβ2013to make the time interval between the import case and
peak in 2013 the same as that in 2014, we found that the peak size and outbreak size in 2014 also increased and attributed this to vertical transmission. A scenario was also run with both an advanced import case date in 2013 and no infected eggs carried over from 2013 to 2014 (Sce-nario Advance 2013 and remove Evi). The peak and outbreak size dropped to 539 and 15,526, respectively, which suggested that the effect of vertical transmission should not be neglected when the outbreak size in the previous year was large (Fig 6E).
Discussion
greater. Vertical transmission played a minor role in forming the pattern, but it is likely to be significant only when the outbreak size in the previous year is large. In addition, we found that the earlier and more frequent interventions in 2014 proved to be effective, otherwise the out-break size might have been over an order of magnitude higher than the observed value.
The date of imported case was crucial in producing the outbreak pattern in 2013 and 2014. The date of the first imported case in our analysis is not the exact date of the first imported case, but a dummy variable indicating the time of the imported cases which starts the local out-break. Since we have no information about which imported case will cause local transmission, the time of imported cases was set to be a parameter to be fitted in the model. Though imported cases occurred in almost every month, indigenous cases were mainly reported from July to November when the mosquito abundance and biting rate are higher, and the EIP is shorter. [4] Temperature and arrival date of the first infectious human also interact since early arrival will occur at lower temperature, but there is a longer time for transmission to increase before the beginning of winter season and thereby produce a larger outbreak [15]. That is, low tempera-ture can increase the EIP as well as reduce the biting and the mortality rate resulting in fewer mosquitoes surviving to be infectious as was also shown inFig 6F. Considering the tradeoff between higher biting rate and longer transmission season, a case imported around mid-April appears to have triggered the biggest outbreak in 2014. (Fig 6F) In addition, the number of imported cases also matters to the outbreak size [16]. However, we did not take this into account, since in our deterministic model one imported case is sufficient to initiate internal transmission.
Precipitation too can have both beneficial and detrimental effects on the abundance ofAe. albopictusand dengue transmission.Ae.albopictusmainly breed in flower pot trays, bamboo tubes, used tyres, disposable containers and surface accumulated water. Precipitation can change the water level in these containers and thereby affect the density-dependent develop-ment and death rate [27]. When the water level is higher, the environmental carrying capacity also increases; hence, the maximum number of mosquitoes the environment can support will also increase. Higher water level will also bring down the death rate and increase the develop-ment rate, so the survival rate of mosquitoes increases during such periods, and developdevelop-ment from larvae to adult will be faster. On the other hand, heavy rainfall also can destroy breeding sites. When a heavy rain occurs at the time the water level is close to the maximum, some of the immature stage mosquitoes will be washed out of their containers (Spillover effect inFig 2) making container habitats significantly less attractive to ovipositing females. Both mechanisms can cause population loss ofAe.albopictus[58].
In contrast, a study in France suggested that the heavy rainfall events can increase the risk of chikungunya [59]. In fact, the relationship between precipitation and mosquito abundance is complicated. We increased or decreased different amounts of rainfall in 10-day time windows, and ran the model with these new precipitation profiles. The result showed that the relation-ship between the amount of precipitation and mosquito abundance or the number of dengue cases was nonlinear, and there was no simple rule to predict the effects of rainfall or heavy rainfall.
According toTable 3, the temperature in 2014 was not as important as precipitation in caus-ing the outbreak pattern because the inter-annual change of temperature is much smaller than that of precipitation. However, temperature plays an important role in controlling various aspects of the seasonal population dynamics ofAe.Albopictusas discussed above.
transmission, therefore dengue was still imported, not endemic, for the 2014 outbreak, which was also recognized by analyzing seasonality and virus source of dengue cases [4]. The probable sources of dengue virus detected in Guangzhou were mainly Thailand, Philippines, Indonesia, Vietnam, Cambodia, and Malaysia [14,61], all of which are also popular tourist destinations for residents in Guangzhou [33]. However, the influence of vertical transmission should not be neglected if a big outbreak occurred in the previous year. Considering the large amount of infected eggs left over from 2014 to 2015, the effect of vertical transmission in 2015 should be large, even can start a local outbreak without any imported case. However, there is no big out-break in 2015, with 44 imported cases but only 57 indigenous cases, though the precipitation in May was higher and there are more imported cases than 2014. This is likely to be attributable to the extensive interventions in 2015. After the unprecedented outbreak in 2014, the govern-ment paid more attention to early detection of imported cases, early mosquito control (started in April compare with in the end of July, 2014), and the quarantine of every suspicious case. Moreover, residents in Guangzhou have more knowledge about the difference between dengue and influenza after 2014, so they are more likely to go to the hospital when symptoms occur and will be put quarantined immediately after confirmed, which can also reduce local transmis-sion. However, due to the deterministic nature of this model, its use is only appropriate when the scale of the outbreak was big enough to ignore the stochastic effects, but the outbreak size in 2015 was relatively small, therefore we did not simulate the situation in 2015 here.
Currently, there is no effective commercial dengue virus vaccine available. Thus, the preven-tion of a dengue outbreak relies heavily on vector control. Container emptying and ULV spray-ing are the most common control strategies in China. Other approaches such as releasspray-ing Wolbachiainfected maleAe.albopicusand introducing mosquito larvae-eating fish have also been adopted, though to a much smaller extent. Although the efficiency of ULV spray in con-trolling adultAe.albopictushas been questioned over the years [24,62], larval source reduction has proven to be successful [62]. Since Guangzhou applied both strategies at the same time, we could not separate them. In addition, though it was argued that mosquito control strategies were often implemented after the peak of transmission and had little or no impact on dengue transmission [62], the first intervention in Guangzhou was timely, two months earlier than the peak, and does appear to have reduced the final epidemic size significantly.
Some studies have suggested positive associations between dengue incidence and theAedes household index and the BI, [63,64] while others have concluded that there was no significant correlation [65,66]. In our study, we found that the abundance ofAe.albopictuswas almost the same for 2013 and 2014 (Fig 5), and there is no relationship between dengue incidence and the mosquito index for Guangzhou in this specific outbreak. However, on the other hand, accord-ing to our results when manipulataccord-ing the climate files, the abundance of mosquitoes can affect the transmission dynamics, though does not appear to be the most important reason for the large 2014 outbreak.
based model, and to include the spatial heterogeneity and stochasticity of transmission of den-gue in Guangzhou. With a stochastic model, we can learn more about the probability of local transmission, which can be combined with the outbreak scale to give us a more practical esti-mation of the dengue outbreak risk.
With the spread ofAe.albopictusunder global warming and increasing numbers of interna-tional travelers, dengue poses addiinterna-tional challenges to policymakers, especially when taking into account the antibody-dependent enhancement, which can lead to increased viral replica-tion and higher viral loads [70] when infected by another heterologous strain. A second wave outbreak with a different serotype could bring more serious manifestations of dengue fever like DHF or DSS [71]. Sustained efforts should be taken to control mosquito abundance and to pre-vent or limit the extent of further outbreaks.
Supporting Information
S1 File. Mathematical model description, equations and temperature- or density-depen-dent functions.
(DOCX)
S2 File. Kolmogorov plot and test result for 5 model simulation cycles. (DOCX)
S1 Table. Monthly average BI and MOI for 2013 and 2014. (XLSX)
S2 Table. Correlation matrix for parameters in Cycle 1 and Cycle 5. (XLSX)
Author Contributions
Conceived and designed the experiments: QC QJ RCS JMM ZY PG. Analyzed the data: QC QJ RCS JMM ZY PG. Contributed reagents/materials/analysis tools: QJ ZY. Wrote the paper: QC QJ RCS PG.
References
1. Guzman MG, Harris E. Dengue. Lancet. 2015; 385: 453–65. doi:10.1016/S0140-6736(14)60572-9
PMID:25230594
2. World Health Organization. Dengue: guidelines for diagnosis, treatment, prevention and control: Geneva: WHO Press; 2009.
3. Bhatt S, Gething PW, Brady OJ, Messina JP, Farlow AW, Moyes CL et al. The global distribution and burden of dengue. Nature. 2013 Apr 25; 496: 504–7. doi:10.1038/nature12060PMID:23563266 4. Lai S, Huang Z, Zhou H, Anders KL, Perkins TA, Yin W et al. The changing epidemiology of dengue in
China, 1990–2014: a descriptive analysis of 25 years of nationwide surveillance data. BMC Med. 2015 Apr 28; 13: 100. doi:10.1186/s12916-015-0336-1PMID:25925417
5. Jin L, Li D. A recent survey of mosquito fauna in Guandong Province, southern China, with a review of past records. Med Vet Entomol. 2008 2008 Dec; 22: 359–63. doi:10.1111/j.1365-2915.2008.00758.x
PMID:19120964
6. Medlock JM, Avenell D, Barrass I, Leach S. Analysis of the potential for survival and seasonal activity ofAedes albopictus(Diptera: Culicidae) in the United Kingdom. J Vector Ecol. 2006 Dec; 31: 292–304. PMID:17249347
7. Tsunoda T, Cuong TC, Dong TD, Yen NT, Le NH, Phong TV et al. Winter Refuge for Aedes aegypti and Ae. albopictus Mosquitoes in Hanoi during Winter. PLoS One. 2014 Apr 21; 9(4): e95606. doi:10. 1371/journal.pone.0095606PMID:24752230
9. Guo X, Zhao T, Dong Y, Lu B. Survival and replication of dengue-2 virus in diapausing eggs ofAedes albopictus(Diptera: Culicidae). J Med Entomol. 2007 May 1; 44(3): 492–7. PMID:17547236 10. Lin C, Fang L, Chen M, Peng YF. Study on Vectorial Capacity Spreading Dengue Virus by Mosquitoes
(Aedes albopictus). Zhongguo Mei Jie Sheng Wu Xue Ji Kong Zhi Za Zhi 2000; 11(3): 173–6.
11. Esteva L, Vargas C. Influence of vertical and mechanical transmission on the dynamics of dengue dis-ease. Math Biosci. 2000 Sep; 167(1): 51–64. PMID:10942786
12. Lambrechts L, Scott TW, Gubler DJ. Consequences of the expanding global distribution ofAedes albo-pictusfor dengue virus transmission. PLoS Negl Trop Dis. 2010 May 25; 4(5): e646. doi:10.1371/ journal.pntd.0000646PMID:20520794
13. Gratz N. Critical review of the vector status ofAedes albopictus. Med Vet Entomol. 2004 Sep; 18(3): 215–27. PMID:15347388
14. Sang S, Yin W, Bi P, Zhang H, Wang C, Liu X, et al. Predicting local dengue transmission in Guang-zhou, China, through the influence of imported cases, mosquito density and climate variability. PLoS One. 2014 Jul 14; 9(7): e102755. doi:10.1371/journal.pone.0102755PMID:25019967
15. Otero M, Solari H. Stochastic eco-epidemiological model of dengue disease transmission byAedes aegyptimosquito. Math Biosci. 2010 Jan; 223(1): 32–46. doi:10.1016/j.mbs.2009.10.005PMID:
19861133
16. Sang S, Gu S, Bi P, Yang W, Yang Z, Xu L, et al. Predicting Unprecedented Dengue Outbreak Using Imported Cases and Climatic Factors in Guangzhou, 2014. PLos Negl Trop Dis. 2015 May 28; 9(5): e0003808. doi:10.1371/journal.pntd.0003808PMID:26020627
17. Kendall BE, Briggs CJ, Murdoch WW, Turchin P, Ellner SP, McCauley E, et al. Why do populations cycle? A synthesis of statistical and mechanistic modeling approaches. Ecology. 1999 Sep; 80(6): 1789–805.
18. Perkins TA, Reiner RC Jr, Rodriguez-Barraquer I, Smith DL, Scott TW, Cummings DAT. A Review of Transmission Models of Dengue: A Quantitative and Qualitative Analysis of Model Features. In: Gubler DJ, Ooi EE, Vasudevan S, Farrar J, editors. Dengue and Dengue Hemorrhagic Fever. Oxfordshire: CABI; 2014. 99–114 p.
19. Erickson RA, Presley SM, Allen LJ, Long KR, Cox SB. A dengue model with a dynamicAedes albopic-tusvector population. Ecol Modell. 2010 Dec 15; 221(24): 2899–908.
20. Cailly P, Tran A, Balenghien T, L’Ambert G, Toty C, Ezanno P. A climate-driven abundance model to assess mosquito control strategies. Ecol Modell. 2012 Feb 24; 227(24): 7–17.
21. Focks DA, Daniels E, Haile DG, Keesling JE. A simulation model of the epidemiology of urban dengue fever: literature analysis, model development, preliminary validation, and samples of simulation results. Am J Trop Med Hyg. 1995 Nov; 53(5): 489–506. PMID:7485707
22. Adams B, Boots M. How important is vertical transmission in mosquitoes for the persistence of dengue? Insights from a mathematical model. Epidemics. 2010 Mar; 2(1): 1–10. doi:10.1016/j.epidem.2010.01. 001PMID:21352772
23. Otero M, Schweigmann N, Solari HG. A stochastic spatial dynamical model forAedes aegypti. Bull Math Biol. 2008 Jul; 70(5): 1297–325. doi:10.1007/s11538-008-9300-yPMID:18293043 24. Newton E, Reiter P. A model of the transmission of dengue fever with an evaluation of the impact of
ultra-low volume (ULV) insecticide applications on dengue epidemics. Am J Trop Med Hyg. 1992; 47 (6): 709–20. PMID:1361721
25. Burattini M, Chen M, Chow A, Coutinho F, Goh K, Lopez LF, et al. Modelling the control strategies against dengue in Singapore. Epidemiol Infect.2008 Mar; 136(3): 309–19. PMID:17540051 26. Esteva L, Vargas C. Coexistence of different serotypes of dengue virus. J Math Biol. 2003 Jan; 46(1):
31–47. PMID:12525934
27. Karl S, Halder N, Kelso JK, Ritchie SA, Milne GJ. A spatial simulation model for dengue virus infection in urban areas. BMC Infect Dis. 2014 Aug 20; 14: 447. doi:10.1186/1471-2334-14-447PMID:
25139524
28. National Bureau of Statistics in China. China city statistical yearbook 2014. Beijing: China Statistics Press; 2014.
29. Statistics Bureau of Guangzhou Municipality. Guangzhou Economic and Social Development Statistics Bulletin 2014.http://gzdaily.dayoo.com/html/2015-03/22/content_2887547.htm
30. Chorography compile committee office of Guangzhou city[Internet]. Chorography of Guangzhou (1840–1990).http://www.gzsdfz.org.cn/sqsjk/zsk/
31. Wilder-Smith A. Dengue infections in travellers. Paediatr Int Child Health. 2012 May; 32(s1): 28–32.
33. Jian D, Lin-fang L. A study on tourist behavior of outbound travel for Guangzhou resident. Guo Li Tai-wan Shi Fan Da Xue Di li Yan Jiu Suo Di Li Yan Jiu Bao Gaob. 2004; 23: 705–14.
34. Ministry of Health of the People's Republic of China. Diagnostic criteria for dengue fever (WS 216– 2008). Beijing: People's Medical Publishing House; 2008.
35. Rozilawati H, Zairi J, Adanan C. Seasonal abundance ofAedes albopictusin selected urban and subur-ban areas in Penang, Malaysia. Trop Biomed. 2007; 24(1): 83–94. PMID:17568381
36. Statistical Bureau of Guangdong. Guangdong Statistical Yearbook 2012. Beijing: China Statistical Publishing House; 2012.
37. Statistical Bureau of Guangdong. Guangdong Statistical Yearbook 2013. Beijing: China Statistical Publishing House; 2013.
38. Statistical Bureau of Guangdong. Guangdong Statistical Yearbook 2014. Beijing: China Statistical Publishing House; 2014.
39. Ross R. Report on the Prevention of Malaria in Mauritius. London: Waterlow and sons; 1908.
40. Ross R. The prevention of malaria. New York: E. P. Dutton; 1910.
41. Focks DA, Haile D, Daniels E, Mount GA. Dynamic life table model forAedes aegypti(Diptera: Culici-dae): analysis of the literature and model development. J Med Entomol. 1993 Nov; 30(6): 1003–17. PMID:8271242
42. Li J, Zhu G, Zhou H, Tang J, Cao J. Effect of different temperatures on development ofAedes albopic-tus. Zhongguo Xue Xi Chong Bing Fang Zhi Za Zhi.2015 Feb; 27(1): 1–3.
43. Zhang H, Mi Z, Zhang Y. Observations of biological characteristics ofAedes albopictusin Yunnan. Zhongguo Mei Jie Sheng Wu Xue Ji Kong Zhi Za Zhi. 1996; 12(3): 2–4.
44. Zhong Z, He G. The life table of laboratoryAedes albopictusunder various temperatures. Zhongshan Yi Ke Da Xue Xue Bao. 1988; 9(3): 35–9.
45. Liu Z, Zhang Y, Yang Y. Population dynamics ofAedes(Stegomyia)albopictus(skuse) under labora-tory conditions. Kun Chong Xue Bao. 1985; 28: 274–80.
46. Delatte H, Gimonneau G, Triboire A, Fontenille D. Influence of temperature on immature development, survival, longevity, fecundity, and gonotrophic cycles ofAedes albopictus, vector of chikungunya and dengue in the Indian Ocean. J Med Entomol. 2009 Jan 1; 46(1): 33–41. PMID:19198515
47. Tran A, L'Ambert G, Lacour G, Benoît R, Demarchi M, Cros M, et al. A rainfall-and temperature-driven abundance model forAedes albopictuspopulations. Int J Environ Res Public Health. 2013 Apr 26; 10 (5): 1698–719. doi:10.3390/ijerph10051698PMID:23624579
48. Li B. Studies on Gonotrophic Rhythm, Gonotrophic Cycle, and Parity ofAedes albopictus. Zhongguo Mei Jie Sheng Wu Xue Ji Kong Zhi Za Zhi. 1991; 7(3): 174–7.
49. Jiang Y, Yan Z, Hu Z, Li C, Wu H. The influence of dengue virus infection upon the physiological and ecological nature ofAedes albopictus. Re Dai Yi Xue Za Zhi. 2009 Apr; 9(4): 401–2, 374.
50. Chan M, Johansson MA. The incubation periods of dengue viruses. PLos One. 2012 Nov 30. 7(11): e50972 doi:10.1371/journal.pone.0050972PMID:23226436
51. Liang F. Virological and Serological Surveillance of Dengue Fever in Guangdong 1992~ 1995. Ji Bing Jian Ce. 1997; 12(11): 405–8.
52. Wang T, Wang M, Shu B, Chen X-q, Luo L, Wang J, et al. Evaluation of Inapparent Dengue Infections During an Outbreak in Southern China. PLoS Negl Trop Dis. 2015 Mar 31; 9(3): e0003677. doi:10. 1371/journal.pntd.0003677PMID:25826297
53. Huang E, Wu Z. Biological characteristics and seasonal abundance ofAedes albopictus. Fujian Nong Lin Da Xue Xue Bao (Zi Ran Ke Xue Ban) 2006; 3: 246–50.
54. R Core Team. R: A language and environment for statistical computing. ( R Foundation for Statistical Computing, Vienna, Austria); 2014.https://www.r-project.org/
55. Soetaert K, Petzoldt T, Setzer RW. Solving differential equations in R: package deSolve. J Stat Softw. 2010 Feb; 33(9): 1–25.
56. Otero M, Solari HG, Schweigmann N. A stochastic population dynamics model forAedes aegypti: for-mulation and application to a city with temperate climate. Bull Math Biol. 2006 Nov; 68(8): 1945–74. PMID:16832731
57. Beven K, Freer J. Equifinality, data assimilation, and uncertainty estimation in mechanistic modelling of complex environmental systems using the GLUE methodology. J Hydrol (Amst). 2001 Aug; 249(1–4): 11–29.
59. Roiz D, Boussès P, Simard F, Paupy C, Fontenille D. Autochthonous Chikungunya Transmission and Extreme Climate Events in Southern France. PLoS Negl Trop Dis. 2015 Jun 16; 9(6): e0003854. doi:
10.1371/journal.pntd.0003854PMID:26079620
60. Ling L, Fang M, Chen C, Peng Y. Experimental study onAedes albopictusby oral infection and biting transovarial transmission with dengue virus. Zhongguo Ren Shou Gong Huan Bing Za Zhi. 2006; 16 (4): 25–7.
61. Sang S, Chen B, Wu H, Yang Z, Di B, Wang L, et al. Dengue is still an imported disease in China: A case study in Guangzhou. Infect Genet Evol. 2015 Jun; 32: 178–90. doi:10.1016/j.meegid.2015.03. 005PMID:25772205
62. Gubler DJ.Aedes aegyptiandAedes aegypti-borne disease control in the 1990s: top down or bottom up. Am J Trop Med Hyg. 1989; 40(6): 571–8. PMID:2472746
63. Li C, Lim T, Han L, Fang R. Rainfall, abundance ofAedes aegyptiand dengue infection in Selangor, Malaysia. Southeast Asian J Trop Med Public Health. 1985 Dec; 16(4): 560–8. PMID:3835698 64. Sanchez L, Vanlerberghe V, Alfonzo L, Marquetti MdC, Guzman MG, Bisset J, et al.Aedes aegypti
lar-val indices and risk for dengue epidemics. Emerg Infect Dis. 2006 May; 12(5): 800–6. PMID:16704841 65. Chadee D, Shivnauth B, Rawlins S, Chen A. Climate, mosquito indices and the epidemiology of dengue fever in Trinidad (2002–2004). Ann Trop Med Parasitol. 2007 Jan 1; 101(1): 69–77. PMID:17244411 66. Bowman LR, Runge-Ranzinger S, McCall P. Assessing the relationship between vector indices and
dengue transmission: a systematic review of the evidence. PLoS Negl Trop Dis. 2014 May 8; 8(5): e2848. doi:10.1371/journal.pntd.0002848PMID:24810901
67. Xiao F-Z, Zhang Y, Deng Y-Q, He S, Xie H-G, Zhou X-N, et al. The effect of temperature on the extrinsic incubation period and infection rate of dengue virus serotype 2 infection inAedes albopictus. Arch Virol. 2014 Nov; 159(11): 3053–7. doi:10.1007/s00705-014-2051-1PMID:24990415
68. Lambrechts L, Paaijmans KP, Fansiri T, Carrington LB, Kramer LD, Thomas MB, et al. Impact of daily temperature fluctuations on dengue virus transmission byAedes aegypti. Proc Natl Acad Sci U S A. 2011 May 3; 108(18): 7460–5. doi:10.1073/pnas.1101377108PMID:21502510
69. Carrington LB, Seifert SN, Armijos MV, Lambrechts L, Scott TW. Reduction ofAedes aegyptivector competence for dengue virus under large temperature fluctuations. Am J Trop Med Hyg. 2013 Feb 25, 88(4): 689–97. doi:10.4269/ajtmh.12-0488PMID:23438766
70. Halstead SB, O'rourke EJ. Dengue viruses and mononuclear phagocytes. I. Infection enhancement by non-neutralizing antibody. J Exp Biol. 1977 Jul 1, 146(1): 201–17.
![Fig 2. Flow chart for the transmission of dengue virus between mosquitoes and humans. Blue Greek letters indicate constant rates which need to be estimated and black letters for constant rates estimated from [36–38]](https://thumb-eu.123doks.com/thumbv2/123dok_br/16387580.192419/6.918.65.845.112.644/transmission-mosquitoes-indicate-constant-estimated-letters-constant-estimated.webp)