ISSN 1553-3468
© 2010 Science Publications
Corresponding Author: Narongsak Chaiyabutr, Department of Veterinary Physiology, Faculty of Veterinary Science, Chulalongkorn University, Bangkok 10330, Thailand
213
Effects of Cooling
and Supplemental Bovine Somatotropin on Milk
Production relating to Body Glucose Metabolism and Utilization of
Glucose by the Mammary Gland in Crossbred Holstein Cattle
1
Siravit Sitprija,
2Somchai Chanpongsang and
1Narongsak Chaiyabutr
1Department of Veterinary Physiology,
2Department of Animal Husbandry,
Faculty of Veterinary Science, Chulalongkorn University, Bangkok 10330, Thailand
Abstract: Problem statement: The low milk yield and shorter persistency of lactation of dairy cattle is the major problem for the dairy practices in the tropics. High environmental temperatures and rapid decline of plasma growth hormone level can influence milk production. Regulation of the milk yield of animals is mainly based on the mechanisms governing the quantity of glucose extracted by the mammary gland for lactose biosynthetic pathways. The mechanism(s) underlying the effects of cooling and supplemental bovine somatotropin on milk production relating to body glucose metabolism and intracellular metabolism of glucose in the mammary gland of crossbred Holstein cattle in the tropics have not been investigated to date. Approach: Ten crossbred 87.5% Holstein cows were divided into two groups of five animals each. Animals were housed in Normal Shade barn (NS) as non-cooled cows and cows in the second group were housed in barn which was equipped with a two Misty-Fan cooling system (MF) as cooled cows. Supplementation of recombinant bovine Somatotropin (rbST) (POSILAC, 500 mg per cow) were performed in both groups to study body glucose metabolism and the utilization of glucose in the mammary gland using a continuous infusion of [3-3H] glucose and [U-14C] glucose as markers in early, mid and late stages of lactation. Results: Milk yield significantly increased in both groups during supplemental rbST with a high level of mammary blood flow. Body glucose turnover rates were not significant different between cooled and non-cooled cows whether supplemental rbST or not. The glucose taken up by the mammary gland of both non-cooled and cooled cows increased flux through the lactose synthesis and the pentose cycle pathway with significant increases in NADPH formation for fatty acid synthesis during rbST supplementation. The utilization of glucose carbon incorporation into milk appeared to increase in milk lactose and milk triacylglycerol but not for milk citrate during supplemental rbST in both non-cooled and cooled cows in early and mid lactation. Conclusion: The present study demonstrated that local changes for biosynthetic capacity within the mammary gland would be a factor in identification of the utilization of substrates in the rate of decline in milk yield. The proportion of glucose was metabolized less for lactose synthesis, but metabolized more via the Embden-Meyerhof pathway and the tricarboxylic acid cycle as lactation advanced to late lactation in both cooled and non-cooled cows whether supplemental rbST or not.
Key words: rbST, glucose metabolism, mammary gland, crossbred Holstein cow
INTRODUCTION
The low milk yield and short lactation period of either pure exotic or crossbred dairy cattle is still the major problem for the dairy practices in the tropics. The mechanisms that limit the rate of milk yield and shorter lactation persistency as lactation advances in crossbred dairy cattle in tropics are unclear. It is not only animal genetics that are considered but other factors, for example, high environmental temperatures and
bovine Somatotropin (rbST) in 87.5% HF cow increased in milk yield which accompanied with an increase in the rate of mammary blood flow, but the stimulant effect for milk yield was less in late lactation despite a high level of mammary blood flow (Chaiyabutr et al., 2007). It is not known which factors are the cause and which factors are the effects for such reduction.
It is well recognized that prolonged high ambient temperatures can affect either directly or indirectly to the ability of dairy cow to synthesize milk production. Environmental modifications such as fans and sprinklers (Fike et al., 2002) or evaporative cooling system (Chan et al., 1997; Chaiyabutr et al., 2008a) can be used to alleviate of severe heat stress and increase in milk production in dairy cattle. In addition to environmental modifications, other technologies can increase milk production in dairy cattle, for example, by supplementation of dietary methionine (Yang et al., 2010), or the application of exogenous bovine somatotropin (West et al., 1991; West, 1994). Somatotropin is known to play a role in responsible for galactopoietic and contributing to homeostasis and homeorhesis in ruminants (Bauman and Currie, 1980). However, few data are available on the combined effects of high environmental temperatures and bST administration on mechanisms of milk secretion.
Glucose is known to be the principal precursor of lactose synthesis. Lactose is the major osmotic factor of milk synthesis and is required in proportion to the amount of milk produced (Linzell and Peaker, 1971). The regulation of the milk yield is mainly based on the quantity of glucose extracted by the mammary gland and converted into lactose. The rapid decline in lactose biosynthetic pathways has been shown to account for a short persistency of lactation as lactation advanced to mid and late lactation in 87.5% HF cows in either without rbST administration (Chaiyabutr et al., 2000b) or long-term administration of rbST (Chaiyabutr et al., 2008b). During long-term administration of rbST, the utilization of glucose in the mammary gland was metabolized less for lactose synthesis and the pentose phosphate pathway but metabolized more via the Embden-Meyerhof pathway as lactation advances (Chaiyabutr et al., 2008b). Cows treated with bST does not only increase efficiencies of milk yields, but also increase heat production, which was probably due to increased metabolic activity associated with higher milk yield (West, 1994). The high heat production in rbST treated-cows with high ambient temperatures would induce high heat stress. The further study would be established whether short persistency of lactation occurring in 87.5% HF cows is due to the effect of high
ambient temperatures or the less stimulant effect of bovine somatotropin or combination of both of these factors during lactation advances. Environmental modifications are needed to minimize the effects of heat stress and that will maintain potentially increased milk yields because of bST technology (West, 1994). Few data are available concerning glucose utilization by the udder, under the effect of cooling and supplementation of rbST in crossbred Holstein cattle. Therefore, the present study was designed to investigate the mechanisms of milk secretion relating to intracellular metabolism of glucose in the mammary gland and body glucose metabolism during rbST supplementation in 87.5% HF cows housing under misty-fan cooling system.
MATERIALS AND METHODS
Animals and managements: Ten primiparous,
crossbred 87.5% Holstein cattle were randomly divided into two groups of five animals each. Animals in the control group were housed in the Normal Shade (NS) in individual stall, while animals in the experimental group were housed in shade with using mister and fans cooling to reduce the environmental temperature (MF). The MF barn had two sets of misters and fans cooling system, which each system consisted of a 26 inch diameter blade fan circulating 7,200 ft3 min−1 of air, with oscillation coverage of 180°. The amount of water discharged from 4 spray heads was 7.5 L h−1 and side of mist droplet 0.01 mm. Animal were exposed to MF for 45 min at 15 min intervals from 0600-1800 h. At night, animals were exposed to MFC for 15 min at 45 min intervals from 1800-0600 h. Animals in each group were fed with the same ration of TMR (Table 1) twice daily throughout the experiment. Each day, the diet was given in equal portion at about 0600 and 1700 h when animal were milked. Water was available at all times. All animals were weighed monthly throughout the experiment.
The study was performed under a protocol approved by ethic committee of Faculty of Veterinary Science, Chulalongkorn University. The procedures used in the present study were formulated to comply with international standards and are in accordance with the principles and guidelines of the National Research Council of Thailand.
215
Fig. 1: Diagram illustrating the time course of studies in each cow supplemented with rbST at different stages of lactation. Pretreat = timed study for pre-treatment; Treat = timed study for treatment
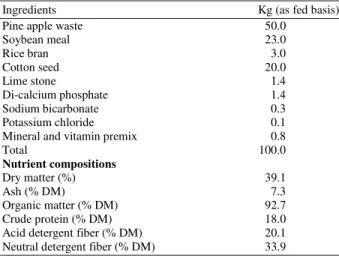
Table 1: Ingredients and nutrient compositions of the TMR diet
Ingredients Kg (as fed basis)
Pine apple waste 50.0
Soybean meal 23.0
Rice bran 3.0
Cotton seed 20.0
Lime stone 1.4
Di-calcium phosphate 1.4
Sodium bicarbonate 0.3
Potassium chloride 0.1
Mineral and vitamin premix 0.8
Total 100.0
Nutrient compositions
Dry matter (%) 39.1
Ash (% DM) 7.3
Organic matter (% DM) 92.7
Crude protein (% DM) 18.0
Acid detergent fiber (% DM) 20.1
Neutral detergent fiber (% DM) 33.9
The pretreatment study was conducted on the starting day of each lactating stage. At the end of the pretreatment, within the same day, the animal was injected with the first dose subcutaneous injection of 500 mg of recombinant bovine Somatotropin (rbST) (POSILAC, Monsanto, USA). Subsequently, the animal was injected with two consecutive doses injections of rbST in every 2 weeks. Thereafter, within 2 days after the third injection, the treatment study was conducted. The pretreatment, 3 doses of injections and the treatment periods were performed during the first 30 days and the same procedures were followed for each lactating stage. During the last 30 days of each lactating stage, no experiments were conducted in order to allow the milk yield from the effect of rbST treatment to return to the control level (Kirchgessner et al., 1991).
Rectal temperature and respiration rate of individual animals were determined at the same time as recording ambient temperature. Ambient temperature and relative humidity were measured weekly throughout the experiment. The Temperature Humidity Index (THI) was calculated according to West (1994), where: THI = db-(0.55-0.55RH) (db-58) with db = dry bulb temperature (°F) and RH = relative humidity. On
each specified day, measurements of mammary blood flow, glucose metabolism and the utilization of glucose by the mammary gland were carried out at around 10.00 h. Both ear vein and milk vein were catheterized with the non-radiopaque intravenous catheters, gauge 18G (Surflo, Terumo Europe N.V., Belgium) under local anesthesia for infusion of solution. An arterial blood sample was collected from the coccygeal vessel by venipuncture with a # 21 needle into heparinized tube. In the present study, blood sample from either tail vessel can be accounted for arterial blood sample. Since, it has been demonstrated in dairy cattle by Emery et al. (1965) that concentrations metabolites such as glucose and acetate in tail arterial blood were similar to those of tail venous blood. Blood samples from arterial and mammary venous blood in heparinized tube were kept in crushed ice and then centrifuge at 3000 rpm for 30 min at 4°C. Plasma samples were collected and frozen at -40°C in aliquots until time of assays for measurements the concentration of metabolites.
20 min intervals. A venous blood sample was collected from the milk vein via a catheter while an arterial blood sample was collected from the coccygeal vessel by venipuncture with a # 21 needle. Blood samples in heparinized tubes were kept in crushed ice for chemical studies. Milk secretion was recorded for the last 1 h of continuous infusion. Milk samples were used for measurement of radioactive glucose incorporation into other milk components. Milk yield was recorded by weight.
Mammary blood flow measurement: Blood flow through half of the udder were performed in duplicated by dye dilution technique using dye T-1824 (Evans blue) by a short term continuous infusion into the milk vein as described by Chaiyabutr et al. (1997). The rate of blood flow through half of the udder was calculated from plasma sample and the value of packed cell volume using the equation derived by Thompson and Thomson (1977). Quarter milking showed that the yields of the two halves of the udder were similar. Mammary blood flow was therefore calculated by doubling the flow measured in one milk vein (Bickerstaffe et al., 1974). Packed cell volume was measured after centrifugation of the blood in a microcapillary tube.
Chemical methods: Radiochemicals for [U-14 C]-glucose and [3-3H]-glucose were obtained from the Radiochemical Center, Amersham Bucks, UK. The specific activity of labeled plasma glucose was determined by the method described by Chaiyabutr and Buranakarl (1989). The plasma glucose concentration was measured using enzymatic oxidation in the presence of glucose oxidase (Human GmBH, Germany). Plasma free fatty acid were determined by colorimetry after plasma extraction with chloroform, heptane and methanol and TAN solution (Wang et al., 2004). Plasma triacylglycerol concentration was determined by enzymatic colorimetric test (Triglyceride liquicolor, Wiesbaden, Germany). The concentration of milk lactose was determined by spectrophotometry (Teles et al., 1978). Lactose radioactivity was determined after isolation by the hydrolysis method (Wood et al., 1965). Milk fatty acids was extracted from 1 ml of an aliquot thawed milk in 2 mL of Dole’s solution (Dole, 1956), (iso-propanol 40: n-heptane 10: 1N H2SO4 1, v/v) shaking in water bath for 30 min. After 1 ml hexane and 1ml H2O was added to the vial and shaking, the upper layer containing fatty acids was transferred into two vials for radioactivity assay and for determination of milk fatty acids concentration. Milk extraction solution in counting vial with a scintillation
cocktail was measured radioactivity of 14C and 3H-fat by liquid scintillation counter. Other portion of milk extraction was used to determine milk fatty acids concentration by colorimetry according to Wang et al. (2004) using chloroform, heptane and methanol and TAN solution containing 1-(2-Thiazolylazo)-2-naphthol (Sigma-Aldrich). Milk fatty acid profiles were determined by gas chromatography (GC-2010 Gas Chromatograph, Shimazu) after extraction by chloroform and methanol (Christopherson and Glass, 1969) in comparison with the appropriate internal standard of pentadecanoic acid (C:15:0 fatty acid). The concentration of milk citrate was determined by spectrophotometry from tricarboxylic acid filtrate (White and Davies, 1963). Citrate radioactivity was determined after isolation by anion exchange chromatography (Hardwick et al., 1963).
Calculations: According to Chaiyabutr et al. (1980; 2008b), body glucose metabolism and intramammary glucose metabolism can be calculated as follow.
The glucose turnover rate in the whole animal (T), expressed as µmol min−1, was calculated from the equation:
T = I/GA
Where:
I = Rate of infusion of [U-14C] glucose or [3-3H] glucose (µCi min−1
)
GA = Specific activity of 14C- or 3H-glucose in arterial plasma at equilibrium (µCi µmol−1
)
Recycling of glucose carbon in the whole animal, expressed as % glucose turnover, was calculated from the equation:
Recycling = (T3-T14)×100/T3
Where:
T3 = Reversible turnover of glucose calculated from [3-3H] glucose
T14 = Irreversible turnover of glucose calculated from [U-14C] glucose
The metabolic glucose clearance rate in the whole animal (CG), expressed as mL min−
1
, was calculated from the equation:
CG = T3/PAG
Where:
217 PAG = Arterial plasma glucose concentration (µmol
mL−1)
Uptake of glucose by the udder (UG), expressed as µmol min−1
, was calculated from the equation:
UG = MPFx (PAPV)
Where:
MPF = Mammary plasma flow (mL min−1)
PA = Concentration of glucose in coccygeal arterial plasma (µmol mL−1
)
PV = Concentration of glucose of plasma from milk vein (µmol mL−1
)
The milk component output (MO), expressed as µmol min−1
, was calculated from the equation:
MO = Ms x Cc/1000
Where:
Ms = Milk secretion rate (Ml min−1)
Cc = Concentration of components in milk (µmol L−1 )
Incorporation (A) of radioactivity from glucose into milk components was calculated from the equation:
A = MA/GA x t
Where:
A = Incorporation of radioactivity from glucose into milk components (µmol min−1
)
MA = Total activity of 3H or 14C in the milk components (µCi)
GA = Specific activity of 14
C-or 3H-glucose in arterial plasma at equilibrium (µCi µmol−1
) t = Time of infusion (min)
Requirement of NADPH for fatty acid synthesis (P) in the mammary gland, expressed as µmol min−1, was calculated from the equation:
PNADPH = ∑[FFAn x (n-2)]
Where:
n = Chain length of the fatty acid (6-16)
FFAn = Output in milk of fatty acid chain length n (µmol min−1
)
Values for FFAn were calculated from all medium chain length fatty acids and 30% of C16-fatty acids (Annison and Linzell, 1964).
Net metabolism of Glucose Phosphorylation (G6P), expressed as µmol min−1, was calculated from the equation:
G6P = UG-L
Where:
UG = Mammary glucose uptake (µmol min−1) L = Output of lactose in milk (µmol min−1
)
Net metabolism of glucose (B) to the galactose or glucose moiety of lactose, expressed as µmol min−1, was calculated from the equation:
B = L
where, L output of lactose in milk (µmol min−1 ). Metabolism of glucose via the pentose phosphate pathway (PC) was calculated from the equation:
Y = 3 PC/(1+2PC)
where, Y specific yield of 14CO2 from (1-14C) glucose via the pentose phosphate pathway (Katz and Wood, 1963).
If the NADPH formed via PC were used exclusively for reductive biosynthesis of fatty acids, the 3
H-incorporation from [3-3H] glucose into fatty acids would equal the 14CO2 released from [1-14C] glucose via the pentose phosphate pathway (Katz et al., 1974). Metabolism of glucose via PC was therefore calculated from the equation:
Z = 3 PC/ (1+2PC)
where, Z (Total 3H in milk fatty acid)/t×GA×(UG-L) Net metabolism of glucose 6-phosphate via PC (GPC), expressed as µmol min−1, was calculated from the equation:
GPC = G6P×PC
Net metabolism of glucose 6-phosphate via the Embden-Meyerhof pathway (GE), expressed as µmol min−1, was calculated from the equation:
GE = G6p-(B + GPC)
The 3H/14C ratio in the plasma and related product was calculated from the equation:
3
3
H/14C lactose = 3H/14C in milk lactose relative to 3H/14C ratio of 1 in the infusion
3
H/14C galactose = 2(3H/14C lactose)-(3H/14C glucose)
3
H/14C citrate = 3H/14C in milk citrate relative to 3H/14C ratio of 1 in the infusion
3
H/14C triacyglycerol = 3H/14C in milk triacyglycerol relative to 3H/14C ratio of 1 in the infusion
Statistical analysis: Individual cow data in each stage of lactation were adjusted for covariate effects with the data from pretreatment period before start of treatment period. The statistic analyses were performed using General Linear Model procedure of statistical software package SPSS (SPSS for windows, V14.0; SPSS Inc., Chicago, IL, USA) to study either effects or interaction effects of treatment and housing. The model used for each parameter analysis was:
Yijk = µ + Al + Hi + A(H)il + Bj + (HB)ij + A(HB)ijl + Covk +eijkl
Where:
Yijk = Observation µ = Overall mean Al = Animal effect
Hi = House effect as main plot (i = NS, MF) A(H)il = Main plot error ( animal l in house i)
Bj = Treatment effect (rbST) as a split plot (j = with and without rbST supplementation) (HB)ij = Interaction effect between treatment and
house
A(HB)ijl = Split plot error (animal l in house i and treatment j)
Covk = Covariate effect eijk = Residual error
The statistical significant differences of environmental parameters between NS and MF barn were determined by unpaired t-test. Statistical significance was declared at p<0.05 and trends were declared at 0.05< p≤0.10.
RESULTS
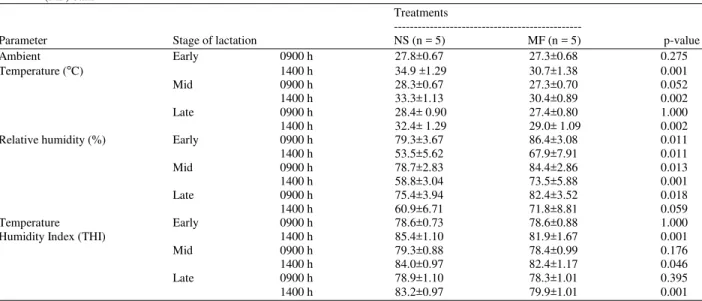
Ambient temperature, relative humidity, Temperature Humidity Index (THI) respiratory rate and rectal temperature: Mean values of measurements at experimental site during periods of studies for daily temperatures, humidities and THI are shown in Table 2. The rectal temperature and respiratory rate are shown in Table 3. Average values of ambient temperature in the barn during the daytime in the morning (0900 h) between NS barn and MF barn were not significantly different, while ambient temperatures during 1400 h at NS barn were significantly higher than that of MF barn. The high relative humidity was apparent at morning and it decreased onwards from morning to evening in both NS and MF barns, whereas relative humidity in MF barn was significantly higher than that of NS barn.
Table 2: Ambient temperature, Relative humidity and temperature humidity index in Normal Shade (NS) barn and shade plus Misty-Fan cooling (MF) barn
Treatments
---
Parameter Stage of lactation NS (n = 5) MF (n = 5) p-value
Ambient Early 0900 h 27.8±0.67 27.3±0.68 0.275
Temperature (๐
C) 1400 h 34.9 ±1.29 30.7±1.38 0.001
Mid 0900 h 28.3±0.67 27.3±0.70 0.052
1400 h 33.3±1.13 30.4±0.89 0.002
Late 0900 h 28.4± 0.90 27.4±0.80 1.000
1400 h 32.4± 1.29 29.0± 1.09 0.002
Relative humidity (%) Early 0900 h 79.3±3.67 86.4±3.08 0.011
1400 h 53.5±5.62 67.9±7.91 0.011
Mid 0900 h 78.7±2.83 84.4±2.86 0.013
1400 h 58.8±3.04 73.5±5.88 0.001
Late 0900 h 75.4±3.94 82.4±3.52 0.018
1400 h 60.9±6.71 71.8±8.81 0.059
Temperature Early 0900 h 78.6±0.73 78.6±0.88 1.000
Humidity Index (THI) 1400 h 85.4±1.10 81.9±1.67 0.001
Mid 0900 h 79.3±0.88 78.4±0.99 0.176
1400 h 84.0±0.97 82.4±1.17 0.046
Late 0900 h 78.9±1.10 78.3±1.01 0.395
1400 h 83.2±0.97 79.9±1.01 0.001
219
Table 3: Ambient temperature, Relative humidity, temperature humidity index, mean values of rectal temperature and respiratory rate of
crossbred Holstein cows housing in Normal Shade (NS) and shade plus Misty-Fan Cooling (MFC)
NS MFC 1Effect
Stages of --- --- ---
Parameter lactation Pre rbST Pre rbST SEM rbST MFC rbSTxMFC
Rectal temperature (°C)
Early 0900 h 38.5 38.9 38.1 38.5 0.08 0.003 0.032 1.000
1400 h 39.4 40.0 39.0 39.4 0.21 0.061 0.037 0.817
Mid 0900 h 38.5 39.0 38.0 38.3 0.08 0.001 0.024 0.258
1400 h 39.7 40.1 38.6 39.5 0.13 0.002 0.002 0.090
Late 0900 h 38.5 38.8 38.0 38.3 0.10 0.015 0.007 0.723
1400 h 39.2 39.9 38.4 38.8 0.16 0.016 0.015 0.309
Respiratory rate (breaths/min)
Early 0900 h 40.0 42.5 35.0 38.0 0.56 0.003 0.003 0.670
1400 h 73.0 82.3 55.5 68.0 4.13 0.039 0.023 0.708
Mid 0900 h 41.2 45.8 36.4 40.4 0.66 0.001 0.022 0.663
1400 h 73.6 77.2 49.0 57.6 1.96 0.018 0.001 0.294
Late 0900 h 40.5 44.5 37.0 41.5 1.44 0.025 0.101 0.868
1400 h 71.5 80.0 54.3 59.3 1.09 0.001 0.019 0.159
SEM = Standard error of the mean.1 P-values for the effects; MFC = Misty-Fan Cooling effect, rbST = rbST effect, MFC x rbST = interaction
effect of MFC and rbST
THI values at the MF barn in afternoon were significantly lower than that of NS barn. Cows in both groups exposed to high THI values (78.3-85.4) in both barns. Rectal temperature recording in the morning and afternoon (0900-1400 h) of cooled and non-cooled cows were significant different whether rbST injection or not. The rectal temperatures of cooled cows were lower than those of non-cooled cows during afternoon (1400 h). There were significant increases in rectal temperature and respiration rate by the effect of supplemental rbST in different parts of the day. The respiratory rates of cooled cows were significantly lower than those of non-cooled cows throughout experimental periods.
Milk yield, milk compositions and its secretion: Milk yield, milk compositions and its secretion of cooled and non-cooled cows are shown in Table 4. It is obvious that milk yield was significantly increased by rbST of both cooled and non-cooled cows, but it decreased as lactation advances. Milk lactose concentrations were not affected by rbST supplementation as compared with pretreatment in both groups or among stages of lactation in the same group. The ratio of lactose output/glucose uptake were not different in comparison between cooled and non-cooled cows whether supplemental rbST or not in each stage of lactation, but it showed tendency to decrease as lactation advances., The milk lactose secretion was significantly increased by rbST in both cooled and non-cooled cows in eac stage of lactation. The milk citrate concentration was significantly increased during supplemental rbST in early lactation, while its significantly decreased in late lactation in both cooled and non-cooled cows. However, during early and mid lactation, the secretions of milk citrate were significantly increased by rbST in
both cooled and non-cooled cows. The concentration triacylglycerol in milk had tendency to increase during supplemental rbST, but a significant increases were apparent in early lactation in both groups. The secretions of milk triacylglycerol were significantly increased in both cooled and non-cooled cows during rbST supplementation in each stage of lactation.
Mammary plasma flow, plasma glucose
concentration, mammary glucose uptake and percentage of glucose extraction: The utilization of glucose across the mammary gland during rbST supplementation in both cooled and non-cooled cows are shown in Table 5. Mammary plasma flow of both cooled and non-cooled cows were significantly increased by rbST administration in each stage of lactation. During rbST supplementation mammary glucose uptake increased in each stage of lactation in both cooled and non-cooled cows. The mammary glucose uptake of both non-cooled and cooled cows were significantly increased during supplemental rbST in mid and late lactations by average 37% and 34%, respectively. Plasma glucose concentrations were not affected by rbST throughout lactation in both cooled and non-cooled cows. There were no significant changes in A-V concentration differences for glucose across the mammary gland during rbST supplementation in each stage of lactation. The percentage of glucose extraction was not influenced by the supplementation of rbST in both groups.
Table 4: Milk yield, milk compositions and secretion for milk lactose, milk citrate and milk triacylglycerol during rbST administration at different stages of lactation of cows housing in Normal Shade (NS) and shade plus Misty-Fan Cooling (MFC)
NS MFC 1Effect
Stages --- --- ---
Parameter of lactation Pre rbST Pre rbST SEM rbST MFC rbSTxMFC
Milk yield (kg day−−−−1)
Early 13.39 15.43 14.82 15.84 0.31 0.001 0.684 0.140 Mid 11.13 13.10 13.79 15.73 0.54 0.003 0.269 0.549 Late 10.31 11.77 11.29 15.00 0.61 0.003 0.372 0.101
Lactose concentration (mmol L−−−−1)
Early 132.5 135.60 133.20 134.00 1.51 0.231 0.833 0.467 Mid 129.3 130.60 130.50 131.20 1.29 0.658 0.536 0.195 Late 130.5 129.70 131.70 133.60 1.68 0.769 0.338 0.448
Milk lactose secretion (µmol min−−−−1)
Early 1230.3 1458.40 1367.70 1471.30 36.12 0.002 0.716 0.123 Mid 999.2 1188.00 1249.70 1497.50 48.38 0.003 0.225 0.100 Late 936.6 1066.30 1028.60 1392.50 57.35 0.003 0.347 0.075
Lactose output/Glucose uptake (%)
Early 65.1 70.40 60.10 57.70 5.60 0.799 0.537 0.510 Mid 62.8 48.80 66.40 54.60 5.90 0.678 0.994 0.702 Late 40.8 34.40 36.70 43.90 3.00 0.903 0.668 0.055
Milk citrate concentration (mmol L−−−−1)
Early 4.24 4.54 4.22 4.85 0.15 0.014 0.305 0.303 Mid 4.7 4.71 5.67 5.78 0.11 0.575 0.016 0.645 Late 4.74 4.14 5.24 4.38 0.15 0.001 0.042 0.404
Milk citrate secretion (µmol min−−−−1)
Early 39.51 48.81 43.81 52.95 1.74 0.001 0.578 0.965 Mid 36.21 42.16 54.48 67.00 2.82 0.011 0.078 0.277 Late 33.72 33.90 41.39 45.56 2.26 0.364 0.228 0.402
Milk triacylglycerol concentration (mmol L−−−−1)
Early 42.36 48.50 45.95 58.66 3.87 0.041 0.361 0.420 Mid 58.77 56.92 57.53 64.99 3.12 0.395 0.699 0.174 Late 61.13 69.36 54.67 66.41 5.61 0.113 0.503 0.762
Milk triacylglycerol secretion (µmol min−−−−1)
Early 374.05 491.3 483.14 632.77 40.09 0.010 0.105 0.697 Mid 446.56 510.5 519.84 710.27 48.33 0.030 0.1 0.227
Late 433.02 569.36 415.35 688.55 81.45 0.036 0.59 0.425
SEM = Standard Error of the Mean; 1 P-values for the effects; MFC = Misty-Fan Cooling effect; rbST = rbST effect; MFC x rbST = Interaction
effect of MFC and rbST
Table 5: Mammary plasma flow, arterial plasma glucose concentration, mammary glucose uptake and percentage of glucose extraction during
rbST administration at different stages of lactation of cows housing in Normal Shade (NS) and shade plus Misty-Fan Cooling (MFC)
NS MFC 1Effect
Stages of --- --- ---
Parameter lactation Pre rbST Pre rbST SEM rbST MFC rbSTxMFC
Mammary plasma flow (mL min−−−−1)
Early 3748.00 4030.00 3923.00 5024.00 186.00 0.006 0.561 0.060 Mid 3139.00 3871.00 3164.00 4141.00 303.00 0.023 0.822 0.696 Late 2817.00 3843.00 3389.00 3792.00 185.00 0.005 0.676 0.131
Plasma glucose (µmol mL−−−−1)
Early 3.73 3.51 3.64 3.48 0.10 0.098 0.883 0.763 Mid 3.55 3.40 3.52 3.67 0.10 0.992 0.719 0.159 Late 3.49 3.52 3.82 3.77 0.09 0.918 0.286 0.646
A-V (µmol mL−−−−1)
Early 0.66 0.67 0.76 0.61 0.08 0.485 0.858 0.261 Mid 0.62 0.58 0.74 0.72 0.07 0.810 0.480 0.605 Late 0.78 0.86 0.81 0.80 0.08 0.552 0.650 0.352
Mammary glucose uptake (µmol min−−−−1)
Early 2299.00 2651.00 2438.00 2653.00 212.00 0.168 0.766 0.632 Mid 1879.00 2437.00 1881.00 2745.00 355.00 0.042 0.624 0.982 Late 2183.00 3235.00 2475.00 2936.00 253.00 0.051 0.530 0.203
Percentage of mammary glucose extraction (%)
Early 16.70 18.60 19.30 16.90 1.58 0.984 0.816 0.164 Mid 17.10 16.70 19.60 18.80 1.57 0.696 0.461 0.398
Late 22.20 24.40 21.50 21.50 1.62 0.530 0.901 0.373
SEM = Standard Error of the Mean;1 p-values for the effects; MFC = Misty-Fan Cooling effect; rbST = rbST effect; MFC x rbST = Interaction
221
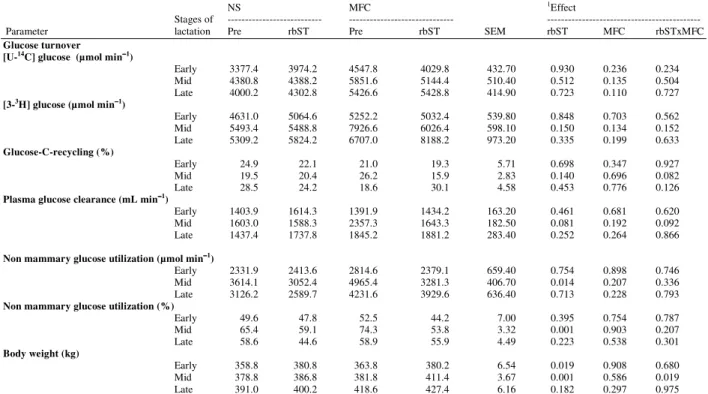
Table 6:Glucose turnover rate, glucose-C-recycling, plasma glucose clearance, non-mammary glucose utilization and body weight during rbST
administration at different stages of lactation of Holstein cows housing in Normal Shade (NS) and shade plus Misty-Fan Cooling (MFC)
NS MFC 1Effect
Stages of --- --- ---
Parameter lactation Pre rbST Pre rbST SEM rbST MFC rbSTxMFC
Glucose turnover [U-14C] glucose (µmol min−−−−1)
Early 3377.4 3974.2 4547.8 4029.8 432.70 0.930 0.236 0.234
Mid 4380.8 4388.2 5851.6 5144.4 510.40 0.512 0.135 0.504
Late 4000.2 4302.8 5426.6 5428.8 414.90 0.723 0.110 0.727
[3-3H] glucose (µmol min−−−−1)
Early 4631.0 5064.6 5252.2 5032.4 539.80 0.848 0.703 0.562
Mid 5493.4 5488.8 7926.6 6026.4 598.10 0.150 0.134 0.152 Late 5309.2 5824.2 6707.0 8188.2 973.20 0.335 0.199 0.633
Glucose-C-recycling (%)
Early 24.9 22.1 21.0 19.3 5.71 0.698 0.347 0.927
Mid 19.5 20.4 26.2 15.9 2.83 0.140 0.696 0.082
Late 28.5 24.2 18.6 30.1 4.58 0.453 0.776 0.126
Plasma glucose clearance (mL min−−−−1)
Early 1403.9 1614.3 1391.9 1434.2 163.20 0.461 0.681 0.620 Mid 1603.0 1588.3 2357.3 1643.3 182.50 0.081 0.192 0.092 Late 1437.4 1737.8 1845.2 1881.2 283.40 0.252 0.264 0.866
Non mammary glucose utilization (µmol min−−−−1)
Early 2331.9 2413.6 2814.6 2379.1 659.40 0.754 0.898 0.746
Mid 3614.1 3052.4 4965.4 3281.3 406.70 0.014 0.207 0.336
Late 3126.2 2589.7 4231.6 3929.6 636.40 0.713 0.228 0.793
Non mammary glucose utilization (%)
Early 49.6 47.8 52.5 44.2 7.00 0.395 0.754 0.787
Mid 65.4 59.1 74.3 53.8 3.32 0.001 0.903 0.207
Late 58.6 44.6 58.9 55.9 4.49 0.223 0.538 0.301
Body weight (kg)
Early 358.8 380.8 363.8 380.2 6.54 0.019 0.908 0.680 Mid 378.8 386.8 381.8 411.4 3.67 0.001 0.586 0.019
Late 391.0 400.2 418.6 427.4 6.16 0.182 0.297 0.975
SEM = Standard Error of the Mean; 1 p-values for the effects; MFC = Misty-Fan Cooling effect, rbST = rbST effect; MFC x rbST = Interaction
effect of MFC and rbST
The glucose entry and utilization rates were not affected by rbST in both cooled and non-cooled cows. The recycling of glucose-C showed no differences between cooled and non-cooled cows whether supplemental rbST or not. Plasma glucose clearance remained unchanged during rbST administration in both cooled and non-cooled cows. Both absolute values and percentage of utilization of glucose of non-mammary tissues of both cooled and non-cooled cows increased as lactation advanced, but it was significantly decreased by rbST during mid lactation. The body weights of both cooled and non-cooled cows whether supplemental rbST or not increased stepwise as lactation advances.
Utilization of glucose carbon in the mammary gland: Glucose uptake and incorporation into related products of lactose, citrate and triacylglycerol are shown in Table 7. Absolute values of the utilization of glucose carbon to milk lactose were increased by rbST in early and mid lactation of both cooled and non-cooled cows, while it decreased in late lactation. However, the percentage of utilization of glucose carbon for synthesis of milk lactose was not affected by rbST in early and mid lactation, but the significant decrease was apparent in late lactation of both cooled and non-cooled cows. The absolute values and percentage of utilization of glucose carbon for synthesis
of milk citrate were significantly lower in rbST-treated cows during mid and late lactation in both cooled and non-cooled cows. During supplementation of rbST, the utilizations of glucose carbon for synthesis of milk triacylglycerol were higher in both cooled and non-cooled cows in all stages of lactation.
Glucose metabolisms in different metabolic pathways in the udder: The effects of supplemental rbST and cooling on intracellular glucose metabolisms in the mammary gland are shown in Table 8. The incorporation of 3H from [3-3H] glucose into fatty acids and the flux through the pentose phosphate pathway were increased by supplemental rbST in both cooled and non-cooled cows. These flux were also increased because of lactation advances neither cooling system nor rbST. Correction for the lower 3H/14C ratio in presenting intracellular glucose 6-phosphate still gave high flux values as lactation advances and during supplemental rbST in both cooled and non-cooled cows. The present results for the net metabolism of glucose 6-phosphate via the pentose phosphate pathway has been defined as glucose 6-phosphate metabolized according to the equation (Katz and Wood, 1963):
Table 7: Utilization of glucose carbon in the udder during rbST administration at different stages of lactation of Holstein cows housing in Normal Shade (NS) and shade plus Misty-Fan Cooling (MFC)
NS MFC 1Effect
Stages of --- --- ---
Parameter lactation Pre rbST Pre rbST SEM rbST MFC rbSTxMFC
[14C] Glucose incorporation (µmol min−−−−1) into: Milk lactose
Early 1102.90 1633.50 1809.70 2372.50 254.96 0.009 0.323 0.601 Mid 1280.20 1405.70 1738.70 2113.40 237.83 0.856 0.602 0.452 Late 1369.70 1034.00 1661.60 874.10 223.11 0.059 0.652 0.675
Milk triacylglycerol
Early 78.18 135.81 165.25 236.94 38.69 0.163 0.010 0.760 Mid 126.85 217.62 197.00 197.66 29.82 0.244 0.660 0.251 Late 154.49 205.94 118.87 231.53 51.25 0.226 0.930 0.638
Milk citrate
Early 25.45 21.19 23.78 16.41 4.58 0.793 0.822 0.597
Mid 25.06 17.20 16.50 8.84 3.67 0.013 0.136 0.922
Late 25.43 16.67 20.81 18.13 2.59 0.052 0.704 0.024
Percentage of glucose carbon appearing as: Milk lactose
Early 52.50 64.60 73.60 88.60 34.93 0.261 0.080 0.718
Mid 81.30 58.50 91.90 77.90 19.45 0.628 0.377 0.831
Late 58.60 32.40 57.80 28.30 11.34 0.012 0.199 0.429
Milk triacylglycerol
Early 3.70 7.60 8.20 11.40 1.98 0.227 0.011 0.577
Mid 6.90 10.30 11.60 7.60 1.74 0.424 0.354 0.649
Late 6.70 6.40 4.90 8.40 2.28 0.632 0.655 0.590
Milk citrate
Early 1.46 1.09 0.98 0.750 0.38 0.556 0.714 0.853
Mid 1.56 0.91 1.07 0.380 0.22 0.005 0.135 0.468
Late 1.19 0.58 0.70 0.620 0.12 0.013 0.385 0.017
SEM = Standard Error of the Mean; 1 p-values for the effects; MFC = Misty-Fan Cooling effect; rbST = rbST effect; MFC x rbST = Interaction
effect of MFC and rbST
Table 8: Glucose metabolism in different metabolic pathway in the udder during rbST administration at different stages of lactation of Holstein cows housing in Normal Shade (NS) and shade plus Misty-Fan Cooling (MFC)
NS MFC 1Effect
Stages of --- --- ---
Parameter lactation Pre rbST Pre rbST SEM rbST MFC rbSTxMFC
Flux through the pentose phosphate pathway calculated as 3H incorporation into milk fatty acid
(equivalent µmol of glucose min−−−−1)
Early 156.50 234.70 236.70 326.90 34.08 0.039 0.269 0.865 Mid 212.70 294.20 300.00 344.10 64.36 0.358 0.250 0.779 Late 421.30 412.90 376.00 282.90 68.33 0.479 0.415 0.552
Corrected 3H incorporation into milk fatty acid (equivalent µmol of glucose min−−−−1)
Early 237.27 280.81 273.54 420.42 65.64 0.185 0.406 0.454 Mid 280.22 352.92 406.02 551.58 77.09 0.195 0.096 0.649 Late 537.57 572.53 472.91 420.03 103.24 0.933 0.501 0.682
Net metabolism of glucose 6-phosphate via the pentose phosphate pathway (µmol min−−−−1)
Early 70.10 102.68 97.13 143.49 18.04 0.060 0.336 0.713 Mid 94.30 131.29 126.93 134.54 34.27 0.534 0.586 0.680 Late 181.80 170.62 155.28 106.89 36.28 0.435 0.355 0.622
Net metabolism of glucose 6-phosphate via the pentose phosphate pathway (%)
Early 11.00 13.20 11.40 16.80 4.04 0.374 0.778 0.699 Mid 13.10 14.20 16.50 14.90 4.24 0.544 0.347 0.406 Late 12.50 8.70 9.70 6.20 2.60 0.195 0.409 0.952
Metabolism of glucose 6-phosphate via the galactose moiety of lactose (%)
Early 81.60 90.10 67.70 74.90 10.10 0.459 0.317 0.951 Mid 87.10 87.40 97.20 78.30 16.30 0.583 0.972 0.571 Late 56.00 42.70 58.90 58.30 11.20 0.553 0.515 0.588
Metabolism of glucose 6-phosphate via Embden-Meyerhof pathway (µmol/min)
Early -115.80 -103.40 -197.50 -216.40 111.40 0.977 0.748 0.892 Mid -213.60 91.10 -345.90 -226.60 168.20 0.243 0.351 0.597 Late 124.30 465.70 321.3 111.60 139.30 0.649 0.713 0.083
Metabolism of glucose 6-phosphate via Embden-Meyerhof pathway (%)
Early -22.50 -42.10 -43.00 -25.90 11.40 0.914 0.949 0.146 Mid -25.60 -12.40 -61.10 -61.40 21.60 0.774 0.370 0.762
Late 19.60 26.60 25.00 13.00 4.10 0.565 0.582 0.050
SEM = Standard Error of the Mean; 1p-values for the effects; MFC = Misty-Fan Cooling effect; rbST = rbST effect; MFCxrbST = Interaction
223
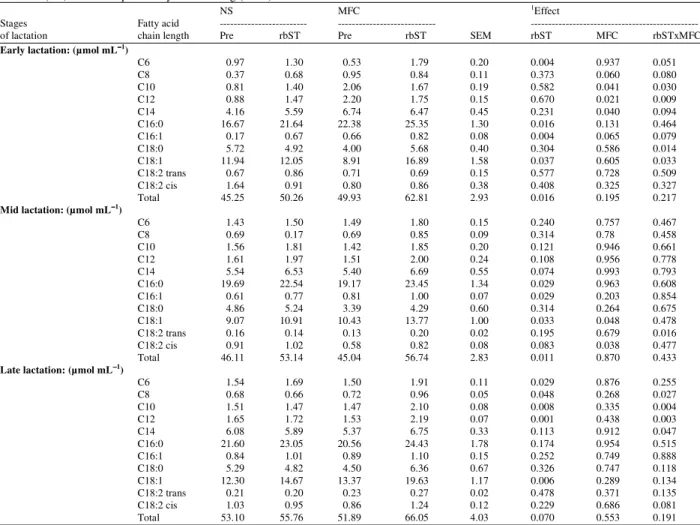
Table 9: Fatty acid composition of milk fat during rbST administration at different stages of lactation of Holstein cows housing in Normal Shade (NS) and shade plus Misty-Fan Cooling (MFC)
NS MFC 1Effect
Stages Fatty acid --- --- ---
of lactation chain length Pre rbST Pre rbST SEM rbST MFC rbSTxMFC
Early lactation: (µmol mL−−−−1)
C6 0.97 1.30 0.53 1.79 0.20 0.004 0.937 0.051
C8 0.37 0.68 0.95 0.84 0.11 0.373 0.060 0.080
C10 0.81 1.40 2.06 1.67 0.19 0.582 0.041 0.030
C12 0.88 1.47 2.20 1.75 0.15 0.670 0.021 0.009
C14 4.16 5.59 6.74 6.47 0.45 0.231 0.040 0.094
C16:0 16.67 21.64 22.38 25.35 1.30 0.016 0.131 0.464
C16:1 0.17 0.67 0.66 0.82 0.08 0.004 0.065 0.079
C18:0 5.72 4.92 4.00 5.68 0.40 0.304 0.586 0.014
C18:1 11.94 12.05 8.91 16.89 1.58 0.037 0.605 0.033
C18:2 trans 0.67 0.86 0.71 0.69 0.15 0.577 0.728 0.509
C18:2 cis 1.64 0.91 0.80 0.86 0.38 0.408 0.325 0.327
Total 45.25 50.26 49.93 62.81 2.93 0.016 0.195 0.217
Mid lactation: (µmol mL−−−−1)
C6 1.43 1.50 1.49 1.80 0.15 0.240 0.757 0.467
C8 0.69 0.17 0.69 0.85 0.09 0.314 0.78 0.458
C10 1.56 1.81 1.42 1.85 0.20 0.121 0.946 0.661
C12 1.61 1.97 1.51 2.00 0.24 0.108 0.956 0.778
C14 5.54 6.53 5.40 6.69 0.55 0.074 0.993 0.793
C16:0 19.69 22.54 19.17 23.45 1.34 0.029 0.963 0.608
C16:1 0.61 0.77 0.81 1.00 0.07 0.029 0.203 0.854
C18:0 4.86 5.24 3.39 4.29 0.60 0.314 0.264 0.675
C18:1 9.07 10.91 10.43 13.77 1.00 0.033 0.048 0.478
C18:2 trans 0.16 0.14 0.13 0.20 0.02 0.195 0.679 0.016
C18:2 cis 0.91 1.02 0.58 0.82 0.08 0.083 0.038 0.477
Total 46.11 53.14 45.04 56.74 2.83 0.011 0.870 0.433
Late lactation: (µmol mL−−−−1)
C6 1.54 1.69 1.50 1.91 0.11 0.029 0.876 0.255
C8 0.68 0.66 0.72 0.96 0.05 0.048 0.268 0.027
C10 1.51 1.47 1.47 2.10 0.08 0.008 0.335 0.004
C12 1.65 1.72 1.53 2.19 0.07 0.001 0.438 0.003
C14 6.08 5.89 5.37 6.75 0.33 0.113 0.912 0.047
C16:0 21.60 23.05 20.56 24.43 1.78 0.174 0.954 0.515
C16:1 0.84 1.01 0.89 1.10 0.15 0.252 0.749 0.888
C18:0 5.29 4.82 4.50 6.36 0.67 0.326 0.747 0.118
C18:1 12.30 14.67 13.37 19.63 1.17 0.006 0.289 0.134
C18:2 trans 0.21 0.20 0.23 0.27 0.02 0.478 0.371 0.135
C18:2 cis 1.03 0.95 0.86 1.24 0.12 0.229 0.686 0.081
Total 53.10 55.76 51.89 66.05 4.03 0.070 0.553 0.191
SEM = Standard Error of the Mean; 1p-values for the effects; MF = Misty-Fan Cooling effect; rbST = rbST effect; MF x rbST = Interaction effect
of MF and rbST
According to this equation, complete metabolism of one molecule of glucose 6-phosphate would require three cycles of the pentose phosphate pathway. Therefore, the flux through the pathway would be three times for the net rate of glucose metabolized in the pentose phosphate pathway. The present results showed that the intracellular glucose phosphorylated by the mammary gland were metabolized more via the pentose phosphate pathway by rbST either in terms of absolute values or the percentage values in early and mid lactation. These values were declined in late lactation. Values of metabolism of glucose 6-phosphate via the galactose moiety of lactose were decreased as lactation advanced to late lactation neither cooling nor rbST in both groups. Metabolism of glucose 6-phosphate via the Embden-Meyerhof pathway was calculated in term of the proportion of metabolized glucose, which was considerable variation throughout stages of lactation in
cooled and non-cooled cows. However, the absolute rate of metabolism of glucose via the Embden-Meyerhof pathway appeared to increase in the late lactation in both cooled and non-cooled cows whether supplemental rbST or not, but the inclement was not statistical significant.
Table 10: NADPH production for fatty acid synthesis in the udder during rbST administration at different stages of lactation of Holstein cows housing in Normal Shade (NS) and shade plus Misty-Fan Cooling (MFC)
NS MFC 1Effect
Stages of --- --- ---
Parameter lactation Pre rbST Pre rbST SEM rbST MFC rbSTxMFC
Requirement of all NADPH for Early 1134.0 1761.0 1920.0 2067.0 134.00 0.020 0.203 0.112
fatty acid synthesis (µmol/min) Mid 1235.0 1698.0 1428.0 2150.0 181.00 0.011 0.539 0.495
Late 1240.0 1460.0 1154.0 2062.0 150.00 0.006 0.481 0.052
Requirement of all NADPH Early 16.7 18.5 19.5 24.9 3.14 0.286 0.482 0.594
formation from glucose via the Mid 25.6 26.5 31.6 25.6 7.36 0.744 0.667 0.651
pentose phosphate pathway (%) Late 35.4 25.6 26.5 17.8 5.16 0.112 0.255 0.925
SEM = Standard Error of the Mean; 1p-values for the effects; MFC =Misty-Fan Cooling effect;rbST = rbST effect; MFC x rbST = Interaction
effect of MFC and rbST
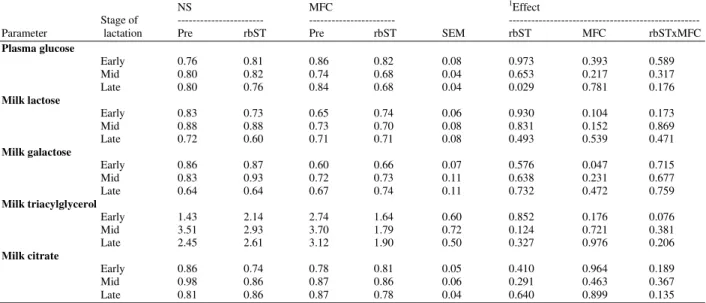
Table 11: 3H/14C ratios in plasma glucose and related products during rbST administration at different stages of lactation of Holstein cows
housing in Normal Shade (NS) and shade plus Misty-Fan Cooling (MFC)
NS MFC 1Effect
Stage of --- --- ---
Parameter lactation Pre rbST Pre rbST SEM rbST MFC rbSTxMFC
Plasma glucose
Early 0.76 0.81 0.86 0.82 0.08 0.973 0.393 0.589
Mid 0.80 0.82 0.74 0.68 0.04 0.653 0.217 0.317
Late 0.80 0.76 0.84 0.68 0.04 0.029 0.781 0.176
Milk lactose
Early 0.83 0.73 0.65 0.74 0.06 0.930 0.104 0.173
Mid 0.88 0.88 0.73 0.70 0.08 0.831 0.152 0.869
Late 0.72 0.60 0.71 0.71 0.08 0.493 0.539 0.471
Milk galactose
Early 0.86 0.87 0.60 0.66 0.07 0.576 0.047 0.715
Mid 0.83 0.93 0.72 0.73 0.11 0.638 0.231 0.677
Late 0.64 0.64 0.67 0.74 0.11 0.732 0.472 0.759
Milk triacylglycerol
Early 1.43 2.14 2.74 1.64 0.60 0.852 0.176 0.076
Mid 3.51 2.93 3.70 1.79 0.72 0.124 0.721 0.381
Late 2.45 2.61 3.12 1.90 0.50 0.327 0.976 0.206
Milk citrate
Early 0.86 0.74 0.78 0.81 0.05 0.410 0.964 0.189
Mid 0.98 0.86 0.87 0.86 0.06 0.291 0.463 0.367
Late 0.81 0.86 0.87 0.78 0.04 0.640 0.899 0.135
SEM = Standard Error of the Mean; 1p-values for the effects; MFC = Misty-Fan Cooling effect; rbST = rbST effect; MFC x rbST = Interaction
effect of MFC and rbST
NADPH production from glucose: The requirement of NADPH for fatty acid synthesis which was calculated from milk fatty compositions and output is shown in Table 10. The NADPH productions for fatty acid synthesis were significantly increased by supplemental rbST in each stage of lactation in both cooled and non-cooled cows. The percentage of NADPH production from glucose via the pentose phosphate pathway was considerable variation throughout stages of lactation in cooled and non-cooled cows.
The 3H/14C ratio in glucose and related products:
The 3H/14C ratios in plasma glucose and related products are shown in Table 11. The 3H/14C ratio in arterial plasma glucose was lower than that of the infusion in both groups. These values were not different among cooled and non-cooled cows supplemental rbST in different stages of lactation, indicating some recycling of glucose-C in the whole animals during
periods of study. A further decrease in the 3H/14C ratio was seen in milk lactose. As the glucose moiety of lactose arises directly from plasma glucose, this decrease in the ratio was due to metabolism of glucose 6-phosphate within the udder before incorporation into lactose as galactose. The 3H/14C ratio of milk triacylglycerol was shown to be high whether with or without rbST in both cooled and non-cooled cows, indicating 3H-glucose was removed and detected in milk triacylglycerol. The 3H and14C from glucose were shown to be incorporated into milk citrate. The3H/14C ratio of milk citrate was not affected by cooling or rbST supplementation.
DISCUSSION
225 Crossbred cows in the present study were therefore always subjected to moderate heat stress throughout experimental periods (i.e., THI = 78.3-85.4). The effect of misters and fans cooling in the present study was not sufficient to completely eliminate heat stress in cows because THI measured under the cooling system remained high. The THI values might not accurately reflect heat stress when using a mister and fan system for evaporative cooling that result in higher humidity but also cause cooling. Although the cooling effect using the misty-fan system was not sufficient to adequately reduce THI in the barn, but there is a beneficial effect as indicated by a lower RR and RT in cooled cows and also higher milk yield throughout lactation. These results support the study of Fike et al.
(2002) that housing cows during the day with fans and sprinklers effectively reduced heat stress as indicated by lower body temperature and respiration rate. In the present study in both groups, milk yield was increased by rbST which accompanied with increases in both RT and RR throughout the experimental periods. The observation for an increase in heat production during rbST supplementation agrees with the reports of West et al. (1991) and West (1994) that rbST-treated cows can increase heat production in a hot environment either high or lower milk producing cows.
It is known that dairy cattle adapt to high temperatures with variety of hormonal and metabolic responses, which may involve changes in the process of milk synthesis in the mammary gland. Milk yield initially showed significant increases in early lactation of cooled and non-cooled cows either supplemental rbST or not and it decreased as lactation advances. These findings confirm that an increase in milk yield in response to rbST administration will not be sustained indefinitely (Bauman, 1992) and it is influenced by the stage of lactation (Phipps et al., 1991). The low potential for extended persistency of lactation in rbST treated cows appears similar to that which occurs in higher yielding cows (Chase, 1993). However, it has been reported that the response to bovine somatotropin for whole lactation might be reduced if treatment begins very early in lactation (Burton et al., 1994; Bauman and Vernon, 1993). It is known that milk production requires glucose for synthesis of lactose which is essential for milk secretion and glucose moiety of lactose arises directly from plasma glucose (Ebner and Schanbacher, 1974). An increase in milk yield without an alteration of the plasma glucose concentration during supplemental rbST in both cooled and non-cooled cows indicates that a substantial increase in supply of glucose to the mammary gland would depend mainly on the capacity for transmembrane transport and/or
intracellular metabolism of glucose. An increase in mammary blood flow is a factor for glucose uptake by the mammary gland (Linzell, 1973), which the rate of mammary plasma flow of cows was significantly increased by supplemental rbST. However, an increase in mammary plasma flow coinciding with the high level of endogenouse IGF-I, which was inferred during rbST supplementation (Chaiyabutr et al., 2005), or increase in circulating concentrations of IGF-I during prolonged exposure to a long daily photoperiod (Spicer et al., 2007), would not be a major determinant in the mediation of nutrient delivery and uptake by the mammary gland for increase in milk production throughout lactation. Local changes for biosynthetic capacity within the mammary gland would be a factor in identification of the utilization of substrates in the rate of decline in milk yield with advancing lactation (Chaiyabutr et al., 2005).
Effects of supplemental rbST and cooling on glucose kinetics are shown in Table 5 and 6. The maintenance of the plasma glucose concentrations over a wide range at different stages of lactation in both cooled and non-cooled cows indicates that steady state conditions between the rate of gluconeogenesis and the rate of utilization of glucose existed in the body pool of glucose in both groups. However, it has been reported that the plasma glucose concentration would increase during injection of bovine somatotropin in cows with low milk yield but not in cows with high milk yields (Bines et al., 1980). The reversible turnover rate of [3-3
and [U-14C] glucose in both cooled and non-cooled cows, which was not affected by rbST in each stage of lactation. These findings suggest that a constant level of tricarbon units originally derived from glucose being again reincorporated into glucose.
The utilization of glucose across the mammary gland during supplemental rbST in both cooled and non-cooled cows at different stages of lactation are complex regulatory mechanisms. It would depend both on the partitioning of blood flow between extra-mammary tissues and local regulation. The present results for the mammary uptake of plasma glucose in both groups were not based on changes in A-V concentration differences and extraction ratio of glucose. An increase in the rate of blood flow to the mammary gland during supplemental rbST in both cooled and non-cooled cows would be a major determinant of the rate of glucose uptake by the mammary gland. In all stages of lactation, the net mammary glucose uptake were increased approximately 8-48% by supplemental rbST in both cooled and non-cooled cows. Glucose extracted by the mammary gland has several possible metabolic fates in mammary epithelial cells that may occur at another level than transmembrane transport (Xiao and Cant, 2003). The glucose uptake by the mammary gland during supplemental rbST and cooling would be rate limiting for the transport of glucose to the mammary cell. The high blood flow to the mammary gland during supplemental rbST would decrease the transit time of glucose, thereby reduction for prolonging the contact time between glucose in blood and glucose transporter in mammary epithelial cell (Chaiyabutr et al., 2007).
It is known that glucose is an important intermediary of metabolism for the biosynthesis of lactose, triacylglycerol and citrate by the mammary gland. The bovine mammary gland cannot synthesize its own glucose because of lacking of glucose-6-phosphatase (Scott et al., 1976). Glucose plays a crucial role in their metabolism and lactose synthesis, which is formed in Golgi vesicles from a combination of glucose either directly or after phosphorylation to glucose 6-phosphate and conversion to UDP-galactose (Ebner and Schanbacher, 1974). The calculated amount of metabolism of glucose 6-phosphate to the galactose moiety of lactose during supplemental rbST in both cooled and non-cooled cows in each stage of lactation would be sufficient to account for the cytosolic lactose synthesis. The utilization of glucose carbon incorporation to lactose in the udder were increased by supplemental rbST in early and mid lactation but not for late lactation in both cooled and non-cooled cows (Table 7). The decrease in the metabolism of glucose
6-phosphate to the galactose moiety of lactose as lactation advanced to late lactation in both cooled and non-cooled cows would affect to the lactose synthesis and milk production. A low enzymatic activity for lactose synthesis might be expected to appear as lactation advances. According to Davis and Bauman (1974), 50-60% of the glucose in the glucose-6-phosphate pool is converted into galactose. Major part of the galactose has been shown to derive from mammary extracted glucose, as well as from glycerol and other metabolic pathways. However, glucose is not the sole carbon source for lactose synthesis but remains the main one. An increase in the glucose concentration in milk representing an increase in glucose concentration in the mammary epithelial cell during prolonged treatment of rbST has been noted (Chaiyabutr et al., 2008c).
227 based on the assumption that all the glucose that was oxidized to CO2, which was metabolized via the pentose phosphate pathway. High metabolism of glucose 6-phosphate in early and mid lactation of rbST treated cows appeared to be due primarily to a high flux through the lactose synthesis and to pentose phosphate pathway, probably reflecting the high milk production during rbST supplementation.
The utilization of glucose carbon by the mammary epithelial cell for the synthesis of milk compositions of lactose, citrate and triacylglycerol (Table 7) show that absolute amount of glucose carbon incorporation to milk lactose were increased by supplemental rbST in early and mid lactation in both cooled and non-cooled cows but it decreased in late lactation. These findings would parallel to its effects on milk yield. It indicates that during supplemental rbST in late lactation, the metabolism of glucose-6-phosphate declines the flux towards the pentose phosphate pathway and in lactose synthesis. In parallel, a higher proportion of glucose-6- phosphate would be metabolized via the Embden-Meyerhof pathway and was oxidized in the tricarboxylic acid cycle.
Both the proportion and absolute amount of glucose carbon incorporation to milk triacylglycerol were increased, while glucose carbon incorporation to milk citrate was slightly decreased by supplemental rbST. It is known that, citrate would not be used directly as a carbon source for lipogenesis in ruminant; it does appear to be directly involved in the provision of reducing equivalent (NADPH). These changes can be interpreted in terms of metabolic shifts occurring within the mammary epithelial cell. It might speculate that such changes reflect more flux of the utilization of glucose carbon by the mammary epithelial cell through the synthesis of lactose and milk triacylglycerol during supplemental rbST. In addition to the use of glucose carbon for milk triacylglycerol synthesis, the hydrogen from glucose has shown to be incorporated more into milk fatty acid in early and mid lactation in both cooled and non-cooled cows supplemental rbST (Table 8), although studies in vitro have shown that fatty acid synthesis could occur from the utilization of acetate in the perfused goat udder (Hardwick et al., 1963). It has been known that milk fat is synthesized from fatty acids of both blood lipids and from de novo synthesis within the mammary epithelial cells. However, an increase in milk fat concentration after rbST supplementation was associated with the increased yield of long-chain fatty acids characteristic of plasma free fatty acids and body fat. Significant increases in plasma free fatty acids in rbST-treated cows have been published elsewhere (Chaiyabutr et al., 2007). Thus, the lipolytic activity
would be a function of rbST treatment per se instead of the associated changes in energy balance.
Glucose can also participate in the milk fat formation, by supplying the glycerol (triose phosphate pathway) and the NADPH essential to elongating milk fatty acids (pentose phosphate and isocitrate dehydrogenase pathways). However, very marginally, less than 11% of glucose could supply carbon atoms for the synthesis of milk triacylglycerol in either supplemental rbST or cooling. The method used to estimate NADPH requirement for fatty acids synthesis in the present study is calculated from the incorporation of 3H from [3-3H] glucose in fatty acids, which assume that the NADPH is used exclusively for biosynthesis of fatty acids (Katz et al., 1974). This technique has been used to study the in vitro metabolism of rat mammary and adipose tissue (Katz and Wals, 1970; Katz and Wals, 1972; Katz et al., 1966) and it has also been used for the study of the in vivo metabolism of goat mammary tissue (Chaiyabutr et al., 1980). Data from the present study (Table 10) provide evidences that the requirement of NADPH for fatty acid synthesis de novo
in the udder were ranging 16.7-35.4% in cooled and non-cooled cows without rbST and 17.8-26.5% during rbST supplementation. If there is a common pool of glucose 6-phosphate which is available for both lactose synthesis and pentose phosphate metabolism; then the recycling of glucose 6-phosphate within the udder could show a low value for NADPH production from glucose metabolism in the present results.
dehydrogenase. Both fatty acid synthesis and the NADP-dependent isocitrate dehydrogenase reaction may have different mechanisms with a common pool of cytosolic NADPH between cows without rbST and cows supplemental rbST. The concentrations of FFA in milk were significantly increased by supplemental rbST in cooled and non-cooled cows (Table 7). A similar result for an increase in milk fat content due to prolonged administration of rbST has also been observed previously (West et al., 1991; Chaiyabutr et al., 2000b). It has been known that milk fat is synthesized from fatty acids of both blood lipids and from de novo synthesis within the mammary epithelial cells.
CONCLUSION
The data presented here represent the estimation in vivo of glucose metabolism in the mammary gland and its distribution to lactose synthesis, the pentose phosphate pathway and the Embden-Meyerhof pathway by the effects of supplemental rbST and cooling in 87.5% HF animals. The rbST exerts its galactopoietic action, in part, association with an increase in mammary blood flow, which partitions the distribution of glucose to the mammary gland. The stimulant effect for milk yield by supplemental rbST was transiently and the glucose turnover rate was not significantly increased as compared with pre-treatment period in all stages of lactation. It indicates that rbST induced enhancement of milk yield in all stages of lactation, which would be compensated by mobilization of body energy reserves (i.e. plasma free fatty acids) to the extent of the elevated energy requirements for supporting the increased milk production. In early and mid lactation, the glucose taken up by the udder of both cooled and non-cooled cows with rbST and without supplemental rbST, were metabolized in the pentose phosphate pathway and contributed to NADPH production by mean average 14 and 24%, respectively. An increased flux of the sufficient pool of intracellular glucose 6-phosphate during early and mid lactation came across through the lactose synthesis and pentose cycle pathway. On late lactation of both cooled and non-cooled cows, the reductions of the metabolism of glucose taken up by the udder via the pentose phosphate pathway and the contribution to NADPH production were apparent by mean averaged 9% and 22%, respectively. It would appear that a larger proportion of the glucose 6-phosphate was metabolized via Embden-Meyerhof pathway in late lactation. The present results suggest that the regulation of biosynthetic capacity within the mammary gland would be influenced more by local than by systemic factors in identification of the utilization of substrates in the rate of decline in milk yield with advanced lactation.
ACKNOWLEDGEMENT
This study was partly supported by The Thailand Research Fund (grant# BRG498004) S. Sitprija is the recipient a grant from Faculty of Science, Mahidol University, Thailand. The authors have no confliction of interest to declare.
REFERENCES
Annison, E.F. and J.L. Linzell, 1964. The oxidation and utilization of glucose and acetate by the mammary gland of the goat in relation to their overall metabolism and milk formation. J. Physiol., 175: 372-385. PMCID: PMC1357142
Bauman, D.E. and R.G. Vernon, 1993. Effects of bovine somatotropin on lactation. Annu. Rev. Nutr., 13: 437-461. PMID: 8369154
Bauman, D.E. and
W.B. Currie, 1980. Partitioning of
nutrients during pregnancy and lactation: A review of mechanisms involving homeostasis and homeorhesis. J. of Dairy Sci., 63: 1514-1529. PMID: 7000867Bauman, D.E., 1992. Bovine somatotropin: Review of an emerging animal technology. J. Dairy Sci., 75: 3432-3451. PMID: 1474210
Bickerstaffe, R., E.F. Annison and J.L. Linzell, 1974. The metabolism of glucose, acetate, lipids and amino acids in lactating dairy cows. J. Agric. Sci.
(Camb)., 82: 71-85. DOI:
10.1017/S0021859600050243
Bines, J.A., I.C. Hart and S.V. Morant, 1980. Endocrine control of energy metabolism in the cow: The effect on milk yield and levels of some blood constituents of injecting growth hormone and growth hormone fragments. Brit. J. Nutr., 43: 179-188. PMID: 6989393
Breier, B.H., P.D. Gluckman, S.N. McCutcheon and S.R. Davis, 1991. Physiological responses to somatotropin in the ruminant. J. Dairy Sci., 74: 20-34. PMID: 1795061
Burton, J.L., B.W. McBride, E. Block, D.R. Glimm and J.J. Kennelly, 1994. A review of bovine growth hormone. Can. J. Anim. Sci., 74: 167-201.
Chaiyabutr, N. and C. Buranakarl, 1989. Effects of exogenous urea infusion on glucose metabolism in acute heat stressed swamp buffaloes (Bubalus bubalis). Brit. Vet. J., 145: 538-545. DOI: 10.1016/0007-1935(89)90115-2