Volume 91 2016
p-ISSN: 0209-3324
e-ISSN: 2450-1549
DOI: 10.20858/sjsutst.2016.91.2
Journal homepage: http://sjsutst.polsl.pl
Article citation information:
Drewniak, J., Rysiński, J. Derived equations for damage accumulation in geared wheels based on modified laws of crack propagation. Scientific Journal of Silesian University of
Technology. Series Transport. 2016, 91, 19-31. ISSN: 0209-3324. DOI: 10.20858/sjsutst.2016.91.2.
Józef DREWNIAK1, Jacek RYSIŃSKI2
DERIVED EQUATIONS FOR DAMAGE ACCUMULATION IN
GEARED WHEELS BASED ON MODIFIED LAWS OF CRACK
PROPAGATION
Summary. Versatile hypotheses of fatigue damage accumulation are utilized in order to determine the fatigue life of particular mechanical elements. Such an approach to an analysis of fatigue processes is recognized as being phenomenological. In the present paper, modifications to the Paris and Foreman laws of fracture mechanics have been proposed. The goal of these modifications is an explicit formulation of crack propagation velocity as a function of crack length. Additionally, the process of crack growth was simulated according to the Palmgren-Miner and Pugno-Ciavarella-Cornetti-Carpinteri fatigue hypotheses. The results of simulation were verified based upon test stand experiments.
Keywords: fatigue life, fatigue damage propagation, test stand investigations, geared wheel
1 Faculty of Mechanical Engineering and Computer Science, University of Bielsko-Biala, Willowa 2 Street,
43-309 Bielsko-Biala, Poland. E-mail: [email protected].
2 Faculty of Mechanical Engineering and Computer Science, University of Bielsko-Biala, Willowa 2 Street,
1. INTRODUCTION
The main factor that has an essential influence on direction and propagation of fatigue damage is the structure of material. The process of forming spots of damage initiation can be observed in the following areas:
slip bands grains borders
intrusions near a surface (very rare)
Other factors have an essential influence, such as heat-chemical and mechanical treatment of the surface, work/operation environment and variable character of a loading.
Depending on the structure of the material, the causes in which cracks occur can be divided into the following groups and types:
Point type (Fig. 1) – four types of defects can be distinguished: 1) voids (empty volumes, Schottky defect); 2) between-node atom; 3) odd atom (between nodes); 4) extraneous atom in a network node.
4 2
1 3
Fig. 1. Crystal defects – point type
Dislocation type (Fig. 2) – edge-type (in a crystal, occurs on the edge of an additional surface); screw-type (defect crystal structure caused by the displacement of a part of the crystal around an axis, known as a curvature of screw dislocation).
Dislocation line
Dislocation line
Cracks along the grains borders most frequently occur in cases of excessive strain amplitudes, as well as in cases of high temperature. Sometimes, even a relatively low force can cause inter-particle bindings to be easily disjointed. The weak bindings result in the molecular crystals being subjected to displacements. Exemplary propagations taking place on the grain borders are presented in Fig. 3.
Fig. 3. Loss of material cohesion: a) transcrystalline (crack permeating the grains); b) intercrystalline (cracks spreading along the grain borders) [1]
Slip bands (Fig. 4) can be observed within the range of the limited fatigue life. They cause, for instance, plastic deformations in the material and, in turn, stress concentrations.
slip band
slip line
Fig. 4. Band and line of a slip
intrusion extrusion slip band
A
1st cycle 2nd cycle
Fig. 5. Schematic view of originating slip lines and bands [10]
Local plastic deformations caused by such slip bands represent the potential places of occurrence of fatigue damages, which can be observed as having a particular form or geometrical shape in many cases (Fig. 6) [11].
Stage I fatigue crack Stage II fatigue crack
extrusion
intrusion
Fig. 6. Exemplary damage process – presented for a thin plate subjected to a cyclic loading [11]
microcrystalline, strengthening and nucleation of micro-cracks. It is closely connected with plastic deformation and static loading. Therefore, crack propagation occurs within the plane on which stretching loadings act.
In stage II, elongation of the crevices and stable crack propagation take place. Here, we consider initiation of macro-cracks and their propagation. Deformations and the creation of macro-cracks occur in the layer close to the surface, but only the surface. When the crack propagates, we can observe the three-axial stress state before its tip. Obviously, the initiation of a crack depends on the place where it occurs, as well as where it is connected to the local concentrations that take place due to plastic deformation on or near the surface. A similar model of nucleation of fatigue cracks (taking into account intrusions and extrusions) can be found in Wood’s monograph.
The exemplary scenarios of crack propagation are presented in Fig. 7 [10]. Three curves of crack propagation have been drawn as functions in the coordinate system: in other words, cycles versus fatigue life until a defect/deterioration occurs. In detail, the ordinate coordinate axis represents the relationship n/N in percentage terms [%], the abscissa coordinate axis represents the increase of crack length and the logarithmic scale is utilized.
0,1 nm 1 nm 10 nm 100 nm 1 m 10 m 100 m 1 mm 10 mm
nuclea
tion
micro cra
cks
macro cra
cks
crack le
ngth lg a
20 40 60 80 100 %
atomic distance no crack nucleation non propagation cracking defect dose not grow starting from defect
finite life infinite life
Fig. 7. Versatile scenarios of crack propagation [10]
Versatile hypotheses of fatigue damage accumulations are applied in order to determine the fatigue life. This approach to the fatigue process is called a phenomenological approach. Another method consists of utilizing energetic, force or strain criterions in accordance with the theory of fracture mechanics. The second approach not only allows for the assessment of fatigue life, but also for the determination of values (level) of damaging loadings. Particular attention is usually given to an analysis of the kinetics of a stable crack increase.
Velocity of fatigue crack propagation is presented using charts prepared in the co-ordinate systemlgdA dNlgKI, where dA dN represents the velocity of crack growth corresponding to a loading cycle, whereas KI represents a range of stress intensity coefficient. The full range of crack growth contains an interval between the following: (a) the threshold coefficient of stress intensity Kth, which corresponds to the border between the
phases of initiation and the stable crack propagation (for velocity growth equal to approx. 10-7 mm/cycle) and (b) the critical coefficient of stress intensity KIC, which is determined via the
crack length, when an intensive or rapid crack growth and deterioration of an element starts. The goal of the investigations presented in the present paper analytically determines the course of fatigue crack growth in the tooth root (of a geared wheel), based upon the modified Foreman and Paris-Erdogan formulae, as a function of crack length. We plan to perform experimental investigations of wheel specimens using the special test stand (of so-called circulating power or back-to-back rig), which aim to confirm the correctness of assumed modified hypotheses.
2. MODIFIED FORM OF PARIS’ EQUATION
In Fig. 8, a schematic chart of the propagation of fatigue cracks or the so-called kinetic fatigue chart, which is drawn in terms of the bi-logarithmic co-ordinate systemlg
da dN
-
Klg , is presented.
III II
I
IC
K max
K
log K th
K
da/
dN [
mm/cykl
]
-11
-7
-3
An experimentally obtained curve can be roughly divided into three areas of different crack velocities. In area I, i.e., of low crack propagation velocity (theoretically within the range0106 mmcycle, but in practice within the interval 1011106 mmcycle), an essential meaning involves the micro-structure of dislocations, medium stresses and environment. Within this area, the range of the threshold coefficient of stress intensityKthis determined.
In area II, i.e., of medium crack propagation velocity (within the range106103 mmcycle), the chart has almost a linear character, while the Paris-Erdogan [7] formula is utilized to describe this part of the chart:
nK C N d
a d
(1)
where C and n are constant depending on the material properties and loading conditions. They should be determined based on experiments (Fig. 8) or chosen based upon relevant references.
Therefore, the basic equations are as follows [8]:
a) Formula in the range of the threshold coefficient of stress intensity Kth, as a function of
the corresponding range of stresses, i.e., FlimFlim, and the threshold/ultimate length of crack a0:
0 lim
0
lim a a
Kth F F
(2)
b) Formula in the range of the coefficient of stress intensity KI0, as a function of
the corresponding range of stresses, i.e., F F Flim, and the threshold/ultimate length of crack a0:
0 0
0 a a
KI F F
(3)
c) Formula in the range of the coefficient of stress intensity KI, as a function of the corresponding range of stresses, i.e., F F Flim, and the threshold/ultimate length of crack a:
a a
KI F F
(4)
d) Equation of the line (curve) of the limited fatigue live, i.e., the so-called Wöhler curve:
k F F m
F F
N N
F
lim
lim
Based on equation (4), we can determine that crack length a is equal to: 2 1 F I K a (6)
while its derivative is as follows:
I
F
I d K
K
da
2
2
(7)
which, after being inserted to the transformed Paris-Erdogan formula, gives us the following equation:
I
Fn I
F d K
K C N
d
2 1 2
(8)
After integration of both sides of the equality:
Ic I Fk F K K I n I F NN 0dNF C 0 K d K
1 2
2
(9)
where we obtain the underneath relationship, which is a formula for determining the number of loading cycles corresponding to the period of crack initiation (time measured by number of cycles):
I
n
n c I F F kF K K
n C
N
N
2 0 2 2 0 2 2 (10)
Rewriting formula (10) and inserting equation (5), we obtain:
n h t F F n c I F m F F FF K K
n C N N F 2 lim 2 2 lim lim 0 2 2 (11)
The equation of damage accumulation corresponding to Paris’ formula finally takes the following form:
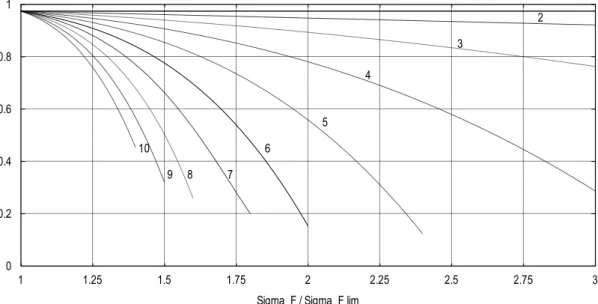
An exemplary simulated chart of damage accumulation is presented in Fig. 9. The considered material of an artefact was 4,330 steel used for the production of geared wheels. 0 0.2 0.4 0.6 0.8 1
1 1.25 1.5 1.75 2 2.25 2.5 2.75 3
Sigma_F / Sigma_F lim
2 3 4 5 6 7 8 9 10
Fig. 9. Chart of fatigue damage accumulation according to the Paris equation (for different exponents of n in the Paris equation)
3. MODIFIED FORM OF FOREMAN EQUATION
In the second considered case, the initial considered relationship is the Foreman equation [6]:
K K R K C N d a d c n ) 1 ( (13)and, additionally, formulas (2) and (5).
Inserting (7) into the transformed formula (13), the following form is obtained:
) ( 2 ) ( ) 1 (
2 (2 )
2 ) 1 ( 2 I n I F I n I F C
f K d K
C K d K C K R
dN
(14)
from which, after integration, we obtain the time of crack nucleation according to the Foreman equation:
As previously discussed, the equation of fatigue damage accumulation, according to the Foreman approach, has the following form:
Fk F F N N D 0 0 (16)
4. MODIFIED FORMS OF PARIS AND FOREMAN EQUATIONS –VERSION ii
In the case of the Paris equation, when based on equation (11) and taking into account the following formulas:
0 lim 0
lim a a
Kth F F
and KIC F ac F ac (17)
the transformed equation (11) takes the form:
2 1
1 1 /2 10 /2
2 / lim lim 0 n a a C N N n n c n n F m F F F F F (18)
In the case of the Foreman equation, the transformed equation (15) takes the form:
) 3 ( 0 lim 2 3 2 ) 2 ( 0 lim 2 2 2 lim lim 0 ) 3 ( 2 ) 2 ( ) 1 ( 2 n F F n c F F n F F n c F F c F m F F F F a a n C a a n C a R N N F (19) 5. CONCLUSIONSWithin the fatigue process of machine elements, the following main phases can be distinguished: nucleation and propagation of slip bands, initiation, and continuous final propagation of fatigue cracks until damage or deterioration occurs. Versatile damage accumulation hypotheses are utilized to model a fatigue phenomenon in order to determine fatigue life.
to the 4330 alloy steel according to the AGMA standard (based upon the database of the NASGRO/FLAGRO company) [9].
The teeth of the geared wheel are mainly subjected to high-cycle fatigue. The particular value of fatigue strength is usually determined by the experimentally obtained fatigue chart, i.e., the so-called Wöhler curve. In the case of fatigue investigations regarding the teeth of geared wheels, the fatigue charts are prepared in relation to the so-called bi-logarithmic coordinate system lg - lg N, where is the pulsating (from zero) bending stress near the tooth root and N corresponds to adequate stress, whereby the adequate fatigue life is measured as the number of cycles.
Based upon performed future experimental investigations, it would be possible to utilize the modified Paris equation, taking into account a damage type, when calculating the fatigue life of geared wheels [8]:
1 2 /
1 2
1 /2 1( /2 1) 1 /2
2
m m C
C a
C N
m m
m n
k
m n
(20)
Underneath, an exemplary Wöhler curve is presented, which utilizes a bi-logarithmic coordinate system that is prepared for versatile values of a ratio: ‘total crack length/initial
crack length’, i.e.: 1;10;100;1000
0
a a
(according to paper [8]) versus the number of
loading cycles N.
10 100 1000 10000
10 100 1000 10000 100000 1e+006 1e+007
N
Woehler 1 10 100 1000
Fig. 10. Wöhler curve determined by equation (20)
References
2. Jones R., D. Tamboli. 2013. “Implications of the lead crack philosophy and the role of short cracks in combat aircraft.”Engineering Failure Analysis 29: 149-166.
3. Kitagawa H., S. Takahashi. 1976. “Applicability of fracture mechanics to very small cracks or the cracks in the early stage.” In Proceedings of the second International Conference on Mechanical Behavior of Materials: 627-631. Boston, ASM.
4. Kocańda S. 1972. Zmęczeniowe niszczenie metali. [In Polish: Fatigue destruction of metals]. Warsaw: WNT.
5. Kocańda D., V. Hutsaylyuk, V. Hlado. 2007. „Analiza rozwoju małych pęknięć
zmęczeniowych od otworu oraz mikromechanizm pękania platerowanej blachy stopu
aluminium 2024-T3”. Biuletyn WAT LVI (4): 37-53. [In PolishŚ „Analysis of the growth of small fatigue cracks from the hole and micromechanism fractures in plated aluminum alloy 2024-T3”. Biuletyn WAT LVI (4): 37-53].
6. Neimitz A. 1998. Mechanika pękania. [In Polish: Fracture mechanics]. Warsaw: PWN. 7. Paris P., F. Erdogan. 1963. „A critical analysis of crack propagation laws”.
Transactions of the ASME 85: 528-534.
8. Pugno N., M. Ciavarella, P. Cornetti, A. Carpinteri. 2006. „A generalized Paris' law for fatigue crack growth”.Journal of the Mechanical and Physics of Solid 54: 1333-1349. 9. Rysiński J. 2003. „Ocena trwało ci i wytrzymało ci zmęczeniowej na złamaniezęba
prostego walcowego koła zębatego”. Ph.D. thesis, Faculty of Mechanical Engineering and Computer Science University of Bielsko-Biala.
10. Schijve J. 2009. Fatigue of structures and materials. Berlin: Springer. ISBN: 978-1-4020-6807-2.
11. Young-Li L., J. Pan, R. Hathaway, M. Barkley. 2005. Fatigue testing and analysis: Theory and practice. London: Elsevier. ISBN-0-7506-7719-8.
12. Homišin J., P. Kaššay. 2009. „Comparison of tuning in shipping system using pneumatic tuners of torsional oscillations“. Machine modeling and simulations: 147-154. ISBN 978-80-89276-18-9.
13. PL 216901 B1. Układ mechaniczny strojony w sposób płynny. [In Polish: Smoothly tuned mechanical system]. Homišin Jaroslav. 2014. Warsaw: Polish Patent Office. 14. UrbanskýM., J. Homišin. 2015.„Design of a mobile platform for the mobile torsional
oscillating mechanical system.”Inżynier 21. Wieku: 389-394. ISBN: 978-83-65182-29-6.
15. Grega R., J. Krajňák. 2012. „The pneumatic dual-mass flywheel”. Scientific Journal of Silesian University of Technology. Series Transport 76: 19-24. ISSN: 0209-3324. 16. Grega R. et al. 2015 „The chances for reduction of vibrations in mechanical system with
low-emission ships combustion engines”. International Journal of Maritime Engineering 157 (A4): 235-240. ISSN 1479-8751.
17. Medvecká-Beňová S., J. Krajňák. 2015. „Modifications of gearbox that increase a machine performance of winding machine for steel sheets.”IT-Strojár: 1-3. ISSN 1338-0761.
19. Mantič M., J. Kuľka, M. Kopas, 2013. „Measuring of geometrical dispositions for a special kind of belt conveyor”.Zdvíhací zařízení v teorii a praxi 1: 35-38.
ISSN 1802-2812.
21. Grega R., J. Homišin, P. Kaššay, J. Krajňák. 2011. „The analysis of vibrations after changing shaft coupling in a drive belt conveyer”.Scientific Journal of Silesian University of Technology. Series Transport 72: 23-31. ISSN: 0209-3324.
Received 13.12.2015; accepted in revised form 15.04.2016
![Fig. 2. Linear defects (dislocations) [1]](https://thumb-eu.123doks.com/thumbv2/123dok_br/16373537.191291/2.892.196.710.825.1055/fig-linear-defects-dislocations.webp)

![Fig. 6. Exemplary damage process – presented for a thin plate subjected to a cyclic loading [11]](https://thumb-eu.123doks.com/thumbv2/123dok_br/16373537.191291/4.892.114.780.635.992/exemplary-damage-process-presented-plate-subjected-cyclic-loading.webp)
![Fig. 7. Versatile scenarios of crack propagation [10]](https://thumb-eu.123doks.com/thumbv2/123dok_br/16373537.191291/5.892.113.786.512.1006/fig-versatile-scenarios-crack-propagation.webp)
![Fig. 8. Schematic chart of the propagation of fatigue cracks [6]](https://thumb-eu.123doks.com/thumbv2/123dok_br/16373537.191291/6.892.211.683.757.1087/fig-schematic-chart-propagation-fatigue-cracks.webp)