Cholesterol-Responsive Atherosclerosis Target Genes
Josefin Skogsberg1., Jesper Lundstro¨m1., Alexander Kovacs2., Roland Nilsson1,3
, Peri Noori1, Shohreh Maleki1, Marina Ko¨hler1, Anders Hamsten2, Jesper Tegne´r1,3, Johan Bjo¨rkegren1*
1The Computational Medicine Group, Karolinska Institutet, Karolinska University Hospital Solna, Stockholm, Sweden,2Atherosclerosis Research Unit, Center for Molecular Medicine, Department of Medicine, Karolinska Institutet, Karolinska University Hospital Solna, Stockholm, Sweden,3Division of Computational Biology, Department of Physics, Linko¨pings Institute for Technology, Linko¨ping University, Linko¨ping, Sweden
Abstract
Despite the well-documented effects of plasma lipid lowering regimes halting atherosclerosis lesion development and reducing morbidity and mortality of coronary artery disease and stroke, the transcriptional response in the atherosclerotic lesion mediating these beneficial effects has not yet been carefully investigated. We performed transcriptional profiling at 10-week intervals in atherosclerosis-prone mice with human-like hypercholesterolemia and a genetic switch to lower plasma lipoproteins (Ldlr2/2Apo100/100 Mttpflox/flox Mx1-Cre). Atherosclerotic lesions progressed slowly at first, then
expanded rapidly, and plateaued after advanced lesions formed. Analysis of lesion expression profiles indicated that accumulation of lipid-poor macrophages reached a point that led to the rapid expansion phase with accelerated foam-cell formation and inflammation, an interpretation supported by lesion histology. Genetic lowering of plasma cholesterol (e.g., lipoproteins) at this point all together prevented the formation of advanced plaques and parallel transcriptional profiling of the atherosclerotic arterial wall identified 37 cholesterol-responsive genes mediating this effect. Validation by siRNA-inhibition in macrophages incubated with acetylated-LDL revealed a network of eight cholesterol-responsive atherosclerosis genes regulating cholesterol-ester accumulation. Taken together, we have identified a network of atherosclerosis genes that in response to plasma cholesterol-lowering prevents the formation of advanced plaques. This network should be of interest for the development of novel atherosclerosis therapies.
Citation:Skogsberg J, Lundstro¨m J, Kovacs A, Nilsson R, Noori P, et al. (2008) Transcriptional Profiling Uncovers a Network of Cholesterol-Responsive Atherosclerosis Target Genes. PLoS Genet 4(3): e1000036. doi:10.1371/journal.pgen.1000036
Editor:Wayne N. Frankel, The Jackson Laboratory, United States of America
ReceivedNovember 9, 2007;AcceptedFebruary 13, 2008;PublishedMarch 14, 2008
Copyright:ß2008 Skogsberg et al. This is an open-access article distributed under the terms of the Creative Commons Attribution License, which permits unrestricted use, distribution, and reproduction in any medium, provided the original author and source are credited.
Funding:This work was supported by grants from the Swedish Research Council (JB), the Karolinska Institute (JB, AH), the Stockholm County Council (JB, AH), the Swedish Heart-Lung Foundation (JB), the King Gustaf V and Queen Victoria Foundation (JB), the Swedish Society of Medicine (JB, JT), the Hans and Loo Osterman Foundation for Geriatric Research (JS, JB), the National Network for Cardiovascular Disease (JS), the Professor Nanna Swartz Fund (JB), the Foundation for Old Servants (JB), and the Magnus Bergvalls Foundation (JB), the A˚ke Wiberg Foundation (JB, JT), the Wennergren Foundation (JT), the Swedish Foundation for Strategic Research (JB, JT), the PhD Programme in Medical Bioinformatics (JB, JT) at Linko¨ping University, and European Commission FP6 (contract: LSHM-CT-2007-037273) (JB, AH).
Competing Interests:Johan Bjo¨rkegren and Jesper Tegne´r are stock owners in Clinical Gene Networks AB. The company has filed a provisional patent on the atherosclerosis gene network presented in this study.
* E-mail: [email protected]
.These authors contributed equally to this work.
Introduction
Atherosclerosis is a lifelong, progressive disease that becomes clinically significant in 50% of the population, leading to myocardial infarction (MI), stroke, and eventually death. Statin-based lipid-lowering regimens reduce morbidity and mortality from both MI and stroke [1]. Aggressive statin regimens can even cause regression of atherosclerosis [2] but sometimes generate severe side effects. To fully exploit the beneficial effects of lipid lowering, we need a better understanding of the transcriptional changes induced by lowering plasma lipoproteins [3]. Whole-genome measurement technologies developed in the aftermath of the human [4,5] and mouse [6] genome projects offer the opportunity to uncover entire repertoires of changes in gene expression related to complex diseases like atherosclerosis and
reveal their interplay in regulatory networks. We used theLdlr2/
2Apo100/100
Mttpflox/floxMx1-Cremouse model [7] that has a plasma lipoprotein profile similar to that of familial hypercholesterolemia
(Ldlr2/2Apob100/100
) and a genetic switch to block hepatic synthesis
of lipoproteins and thereby lower plasma lipoproteins (Mttpflox/
flox
Mx1-Cre) to investigate the effects of plasma
cholesterol-lowering on atherosclerosis development and to identify choles-terol-responsive atherosclerosis genes.
Results
Basic Characteristic and Atherosclerotic Lesion Development
The mice were sacrificed at 10, 20, 30, 40, 50 and 60 weeks of age. Lesion area and morphological changes were assessed in a
total of 87Ldlr2/2Apob100/100
Mttpflox/floxMx1-Cremice (Figure 1A– 1C). Only occasional spots of Sudan IV staining were detected at 10 weeks (n = 10, not shown), but lesions were detected in all mice
at 20 weeks. Lesion size increased by,1.6% between weeks 20
and 30 (P= 0.05) and by ,7.2% between weeks 30 and 40
fatty streaks (red transparent areas with diffuse boundaries); no plaques were detected. At 30 weeks, all mice had small plaques (red nontransparent areas with distinct boundaries) in the aortic arch that had expanded markedly at 40 weeks. Thereafter plaque growth was restrained (Figure 1A and 1B). The area of Oil-red-O staining in the aortic root followed a similar progression curve as the Sudan IV lesion staining whereas CD68 staining increased sharply between week 20 and 30 (Figure 1C). Plasma cholesterol increased slightly with age whereas plasma triglyceride and glucose levels were unchanged (Table 1).
Transcriptional Profiling of Lesion Development
Next, we identified transcriptional changes of atherosclerosis development using 32 cDNA arrays (5 to 7 per time point). Of 19,879 genes (Mouse Genome Informatics Database, www.jax. org), 1259 (6.3%) were differentially expressed according to empirical Bayes statistics [8] at one or more time comparisons
(FDR,0.05, n = 1259). Of these, 329 (27%) had previously been
related to atherosclerosis (Table S1). Of genes with established roles in atherosclerosis (Table S6), 78% (88/111) were among the differentially expressed genes.
Cluster analysis of mRNA levels of differentially expressed genes (n = 1259) generated four distinct clusters (Figure 2A, Table S21). Cluster 1 genes (n = 293, Table S8) were activated during rapid lesion expansion between 30 and 40 weeks (Figure 1A) and remained activated at 60 weeks (Figure 2A). This cluster had the highest percentage (36%) of genes previously related to athero-sclerosis or atheroathero-sclerosis cell types (Figure 2A, Table S1), and 89% of the genes were related to inflammatory cells (Tables S13, S17, S22).
Gene activities peaked at week 30 in cluster 2 (n = 331; Table S9) and at week 40 in cluster 4 (n = 300; Table S11) and were suppressed at late stages of progression (Figure 2A); 73% had no previous relation to atherosclerosis or atherosclerosis cell types (Tables S14, S16, S18, S20, S23, and S25).
Cluster 3 (n = 339; Table S10) was particularly interesting because the mRNA levels of these genes peaked at 30 weeks and were suppressed at 40 weeks (Figure 2A), coinciding with the rapid lesion expansion phase. This cluster had fewer atherosclerosis-related genes than cluster 1 but more than clusters 2 or 4 and consisted mainly of genes related to carboxylic and lipid metabolism (Tables S15, S19, and S24). Thirteen of 19 TFs are well-established in lipid and energy metabolism, including the peroxisome proliferator activator receptors (PPARs; Ppara (Entrez Gene ID 19013), Ppard (Entrez Gene ID 19015), and Pparg (Entrez Gene ID 19016)) and sterol regulatory element binding factor 2 (Srebf2, Entrez Gene ID 20788), which also have been implicated in the regulation of foam-cell formation.
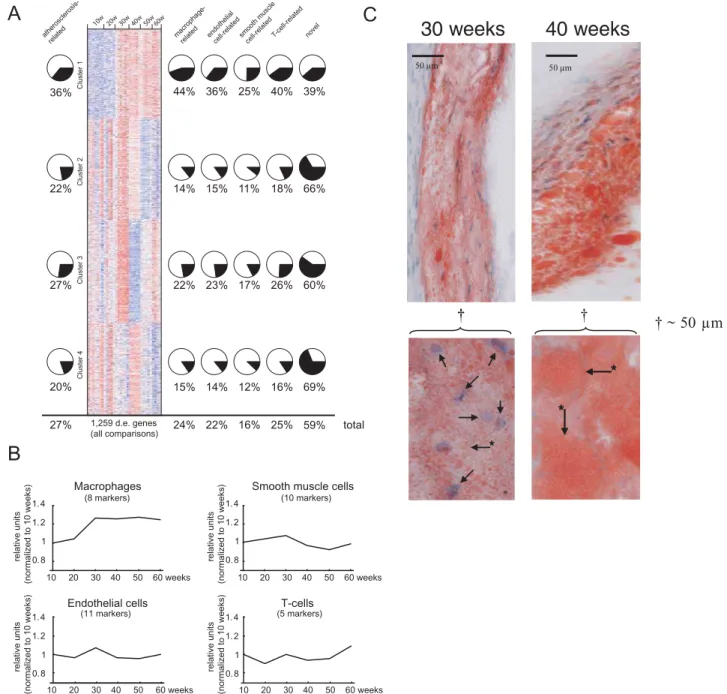
Cell-type-specific markers (Table S7) were used to investigate changes to the relative cell type contents of the lesion over time. mRNA levels of these markers on the GeneChips indicated that most of the major lesion cell types (smooth muscle and endothelial and T-cells) were relatively stable during lesion progression (Figure 2B). In contrast, macrophages/foam cells increased in number between 20 and 30 weeks and remained at this level until 60 weeks (Figure 2B). This change in lesion macrophage number confirmed the notion obtained from the CD68 staining (Figure 1C).
In summary, the gene expression data suggest that macrophages gradually accumulate in the early phases of lesion development, reaching a density at 30 weeks (Figure 2B), inducing an inflammatory reaction (Figure 2A, cluster 1), increasing lipid accumulation in foam cells (Figure 2A, cluster 3), and causing rapid lesion expansion (Figure 1A and 1B). The lipid accumulation in foam cells was sustained until 40 weeks (Figure 2A, cluster 3). The inflammation persisted in the later phases (Figure 2A, cluster 1).
This interpretation of the expression data was supported by a immunohistochemical examination showing that lipid-poor mac-rophages had accumulated at 30 weeks and then had expanded and become lipid-rich at 40 weeks (Figure 2C).
Identification of Plasma Cholesterol-Responsive Atherosclerosis Genes
To investigate the role of plasma cholesterol in causing the rapid lesion expansion between week 30 and 40, we genetically lowered plasma LDL cholesterol by inducing recombination of
Mttp (Ldlr2/2Apob100/100MttpD/D) in 30-week-old mice. Plasma
cholesterol was reduced.80% (427 to 54631 mg/L, n = 6) and
remained at this level for 10 weeks until sacrifice. At sacrifice, lesion size had not increased and was significantly less than in controls with high cholesterol (Figure 3A). Lesion histology was indistinguishable from that in 30-week-old mice with high plasma cholesterol (not shown). Thus, lowering plasma cholesterol at 30 weeks eliminated the formation of advanced plaques observed in mice with sustained high levels of plasma cholesterol.
To investigate the molecular mechanisms in the atherosclerotic arterial wall induced by the genetic lowering of plasma cholesterol preventing the formation of advanced lesion, we performed additional gene expression profiling of lesion mRNA isolated from mice sacrificed immediately after plasma cholesterol lowering by
Cre-mediated recombination ofMttpin the liver (Text S1). The
mRNA levels of thirty-seven atherosclerosis genes responded strongly to the cholesterol lowering (Table S12). To determine if these changes were true changes in cellular mRNA levels or a consequence of changes in lesion size or the relative contributions of cell types, we examined lesion size and the relative numbers of the four major atherosclerosis cell types. Neither lesion size (Figure 3B) nor cell type distribution (Figure 3C) was affected by
Author Summary
Atherosclerosis is present in the major arteries of all adults. In industrial societies, atherosclerosis progression in,50%
20w 30w 40w 50w 60w
20w 30w 40w 50w 60w
0
5
10
15
20
25
20w 30w 40w 50w 60w
% lesion area
20 30 40 50 60
weeks
A
B
C
10 weeks
20 weeks
30 weeks
40 weeks
50 weeks
60 weeks
10 weeks
20 weeks
30 weeks
40 weeks
50 weeks
60 weeks
Whole
Arche
ORO
/Htx
CD68
/DAPI
Figure 1. Atherosclerosis progression inLdlr2/2Apob100/100Mttpflox/floxmice.(A) Box plots of atherosclerosis progression at 20 (n = 12), 30
(n = 25), 40 (n = 15), 50 (n = 15), and 60 weeks (n = 10).P,0.05, 20vs.30 weeks;P,0.0001, 30vs.40 weeks;P,0.02, 40vs.50 weeks. Values are surface
lesion areas assessed by Sudan IV staining of pinned-out aortas and given as a percentage of the surface of the entire aorta. Boxes enclose values
between the 75thand 25thpercentiles, bars indicate values between the 90thand 10thpercentiles, and black dots indicate individual observations
outside these boundaries. (B) Representative aortic trees (above) and arches (below). (C) Representative sections of the aortic root were stained with Oil-red-O and counterstained with hematoxylin (Htx) or show CD68 fluorescence and counterstained with DAPI.
the subacute lowering of plasma cholesterol, as judged from cell-surface markers (Table S7), Oil-red-O staining, and immunohis-tochemical analysis of CD68 expression (Figure 3D) suggesting that the observed changes in mRNA levels were true gene activity changes in response to the plasma cholesterol lowering.
Although the recombination of Mttp in the Ldlr2/2Apob100/
100
Mttpflox/floxMx1-Cre mouse leading to lowering of plasma cholesterol mainly takes place in the liver, the intraperitoneal
pI—pC treatment and the following activation of
Cre-recombi-nase may theoretically in themselves affect gene expression in the atherosclerotic arterial wall. To investigate this possibility, we bred
control mice lacking the floxed Mttp allele (Ldlr2/2Apob100/
100
Mttpwt/wtMx1-Cre) and treated these mice with pI-pC (n = 4) and PBS (n = 5). As expected, the pI-pC treatment had no effect on plasma cholesterol levels (not shown). Moreover, GeneChip
analysis of aortic arch mRNA samples from these mice (n = 4+5)
showed a low number of differentially expressed genes and none of these were the 37 cholesterol-responsive genes.
Regulatory Network Identification of Cholesterol Responsive Macrophage Genes
The rapid expansion of the lesions between weeks 30 and 40 leading to the formation of advanced plaques was primarily caused by lipid loading of foam cells already present at 30 weeks (clusters 1 and 3 in Figure 2A–2C). We suspected that some of the cholesterol-responsive genes identified at 30 weeks (Table S12) were essential to this process. To address this, total RNA was isolated from targeted and control THP-1 macrophages in cell culture that had been activated by PMA, treated with siRNA or mock and then incubated with acetylated-LDL (AcLDL) for 48 hours (see also Methods and Text S1). Expression data
(Affymetrix Hu 130, 2.0+) was generated from 12 siRNA
experiments and 4 pools of controls treated with unspecific siRNA
(mock). Three transcripts, GPR120 (Entrez Gene ID 338557),
GPR81 (Entrez Gene ID 27198) and SOX6 (Entrez Gene ID 55553), were below the detection limits of the GeneChips suggesting that these genes were not active enough in this experimental model of foam cell formation to be detected or inactive. The remaining genes were organized in a 9-by-9 data matrix. Expression data for each gene was normalized by dividing with the mean expression level in controls followed by log-transformation. A linear gene regulation model
dxi dt ~
Xn
j~1
wijxjzpi
was fit to data as previously described [9]. Here x denotes
expression data vectors,Wis the network adjacency matrix, andp
is the perturbation vector. In each knockdown experiment, the
elements ofpwere21 for the perturbed gene and 0 for all other
genes. Note that because of the log-transform, this corresponds to a multiplicative model in actual expression levels. The algorithm controls the trade off between precision and recall by a single
parameterd. In our experiments we chosed= 0.2. In simulations
we found that this value corresponds to approx. 60% precision and 80% recall. Of note, interactions between genes (i.e. directed edges with stimulating or repressing effect) do not imply direct biological interactions but in most instances indirect (for instances mediated by proteins, metabolites or even intermediate genes (with low expression level such as transcription factors)).
PRKAR2B (Entrez Gene ID 5577) had no edges to the other nodes (e.g. genes). The remaining eight nodes were found to belong to a regulatory gene network (Figure 4A, Table 2). These
nodes includedCD36(Entrez Gene ID 948), which previously has
been shown to promote foam-cell formation [10], and PPARA
(Entrez Gene ID 5465) [11], which previously has been shown to
prevent it [11]. Hydroxysteroid dehydrogenase-like 2 (HSDL2,
Entrez Gene ID 84263) up-regulatedPPARAand down-regulated
CD36. Moreover, poliovirus receptor-related 2 (PVRL2, Entrez
Gene ID 5819) also regulatedCD36, increasing its expression and
negatively regulating HSDL2 and thus indirectly suppressing
PPARAactivity. From the regulation ofCD36andPPARAin this regulatory network (Figure 4A), it can be predicted that inhibiting
PVRL2would prevent foam-cell formation and inhibitingHSDL2
would promote it. To validate the network, we tested these predictions by assessing the effect of inhibiting individual genes within the network on cholesterol-ester (CE) and lipid accumula-tion. The CE accumulations in the THP-1 cells in response to siRNA treatments were in agreement with our predictions (Figure 4A, Table 3). siRNA treatment against several of the other network nodes also affected CE accumulation in THP-1 macrophages (Figure 4A). Representative microscopic images of siRNA treated macrophages stained wit Oil-red-O are shown in Figure 4B.
Discussion
In this study, we first used genome-wide expression profiling to identify a point before which atherosclerosis developed slowly and only low-level inflammation was present. After this point, lesions expanded rapidly and inflammation increased markedly. The inflammation persisted in late phases, leading to the formation of advanced plaques, but lesion size increased transiently during a 10-week period. The rapid lesion expansion was primarily caused by an equally rapid lipid accumulation in macrophages. In early lesions, macrophages with low degree of inflammation and low lipid content accumulated. At a certain point, this accumulation halted and was followed by a rapid increase in macrophage lipid content paralleled by an induction of inflammatory genes. Lowering plasma cholesterol at this point prevented the rapid expansion of the lesions and the formation of advanced plaques.
Table 1.Plasma cholesterol, triglyceride, and glucose concentrations of representativeLdlr2/2Apob100/100
Mttpflox/floxMx1-Cremice.
Plasma level (mg/dl) Age (weeks)
10.660.4 (n = 7) 21.361.1 (n = 5) 29.660.0 (n = 6) 40.360.0 (n = 5) 50.560.8 (n = 5) 61.060.0 (n = 4)
Cholesterol 361.2664.2 345.7665.3 427.0672.4 461.9614.1 427.2674.2 527.3671.5
Triglycerides 83.0625.8 84.1610.5 87.8617.0 84.7620.0 108.6626.2 89.6638.3
Glucose 359.6650.6 425.4676.2 369.8637.8 311.4628.5 350.6619.6 376.0638.3
The lowering effect was mediated by 37 cholesterol-responsive atherosclerosis genes. Validation of the macrophage-related part of these genes by additional transcriptional profiling of
mRNA from siRNA-targeted THP1—macrophages incubated
with AcLDL exposed a regulatory gene network of foam-cell formation. This network as a whole and some of its individual
nodes (particularlyPVRL2andHSDL2) should be considered for
therapies to prevent the formation of advanced plaques. Transcriptional profiles of atherosclerosis lesions are challenging to interpret [3]. Such lesions contains several cell types, and the average mRNA contribution of a given cell type is altered with disease development. Thus, changes in mRNA levels represent a mixture of
macrophage-related endothelialcell-relatedsmooth musclecell-relatedT-cell-related novel 20w
10w 30w 40w 50w 60w
atherosclerosis-related
1,259 d.e. genes (all comparisons)
Cluster 1
Cluster 2
Cluster 3
Cluster 4
total 27%
20%
27%
22%
15%
24% 23%
14%
22% 17%
12%
16%
60%
69%
59% 26%
16%
25% 22%
36% 44% 36% 25% 40% 39%
14% 15% 11% 18% 66%
A
Macrophages
(8 markers)
Endothelial cells
(11 markers)
T-cells
(5 markers)
Smooth muscle cells
(10 markers)
0. 8 1 1. 2 1. 4 0. 8 1 1. 2 1. 4
60 weeks 10 20 30 40 50 0. 8
1 1. 2 1. 4
0. 8 1 1. 2 1. 4
10 20 30 40 50 60 weeks
60 weeks 10 20 30 40 50
60 weeks 10 20 30 40 50
relative units (normalized to 10 weeks)
relative units (normalized to 10 weeks)
relative units (normalized to 10 weeks)
relative units (normalized to 10 weeks)
B
C
30 weeks
40 weeks
50 µm 50 µm
†
*
*
*
† ~ 50 µm
†
†
*
*
*
Figure 2. Transcriptional changes of atherosclerosis development.(A) Heat map of clustered mRNA levels (rows; red, high levels; blue, low
levels) for genes differentially expressed (d.e.) in at least one pair-wise time-point comparison (FDR,0.05, n = 1259). Each column represents mRNA
levels in one mouse (n = 5 to 7 per time point) at 10 to 60 weeks of age. Four gene clusters were identified by the cluster algorithm. Pie charts show percentages of genes related to atherosclerosis (Table S1) on the left and to the four atherosclerosis cell types (Tables S2, S3, S4, and S5) on the right. A substantial number of genes were related to more than one atherosclerosis cell type (Figure S1). The percentage of novel genes (i.e., not related to atherosclerosis or atherosclerosis cell types) in each cluster is shown on the far right. Overall percentages (total) are shown below. (B) Relative expression levels of cell-specific markers of atherosclerosis cell types (Table S7). The number of markers per cell type is indicated. The only statistically
significant increase was in the number of foam cells, which increased by,30% between 20 and 30 weeks (P,0.001) and remained elevated at
60 weeks. (C) Representative sections of the aortic root (top) were stained with Oil-red-O (red in the figure) and counterstained with hematoxylin
(Htx) (blue spots in the figure), bar in figure indicate 50mm; higher-power views of 50mm showing foam cells at 30 (arrows indicate macrophage
Htx-stained nuclei, asterisk marked arrows point to the outer cell membrane) and 40 weeks (asterisk marked arrows point to the outer cell membrane of Oil-red-O-stained fat within macrophages, the nuclei are not visible) are shown below.
actual changes in cellular mRNA concentrations and changes in cell type admixture. In addition, cells in different stages of proliferation and differentiation (e.g., macrophages differentiation into foam cells) adds to this problem also within a given cell type. However, the current lesion mRNA dataset over tight time intervals provides, to our best knowledge, the most comprehensive compendium of lesion expression profiles representing known and novel biological processes and pathways activated during atherogenesis (Figure 2A).
Analysis of lesion mRNA clusters (Figure 2A) indicated that, at first, macrophages infiltrate the arterial wall, leading to the
formation of fatty streaks. Then, at what appears to be a rather specific time point, these cells become activated, leading to a burst of inflammatory activity that, in combination with a rapid accumulation of CE in macrophages, generates advanced plaques; documented as a critical step in atherogenesis [12]. We believe this transformation can be related to the density of macrophages in the arterial wall. At a given density, the macrophages not only stimulate themselves (autocrine) but also stimulate each other (paracrine), leading to a burst of inflammatory activities and increasing lipid uptake. If such a mechanism is also present in
A
%
les
ion
ar
ea
B
0 25 50 75 100 125 150
%
%
rel
at
iv
e
c
h
a
n
g
e
C
High chol.
Low chol.
0 25 50 75 100 125 150
Foam cells
Endothelial cells
SMC
T-cells
40 weeks
30 weeks
%
re
la
ti
ve
c
ha
nge
*
2 0 w 3 0 w 4 0 w 5 0 w 6 0 w 2 0 w 3 0 w 4 0 w 5 0 w 6 0 w 2 0 w 3 0 w 4 0 w 5 0 w 6 0 w 2 0 w 3 0 w 4 0 w 5 0 w 6 0 w 2 0 w 3 0 w 4 0 w 5 0 w 6 0 w 2 0 w 3 0 w 4 0 w 5 0 w 6 0 w
0 4 8 12 16
0 4 8 12 16
D
High cholesterol
Low cholesterol
Oil-red-O
CD68
Figure 3. Effect of plasma-cholesterol lowering on lesion progression.Lesion surface area was determined as the percentage of lesion area in relation to the total area of pinned-out aortas from the bifurcation to the aortic root. At 28 weeks of age, mice received intraperitoneal injections of
pI-pC to induce recombination ofMttpin the liver and were sacrificed 12 weeks later or 1 week after cholesterol lowering had been achieved.
High-cholesterol control mice were injected with PBS. (A) At 40 weeks of age, lesion surface area in mice with low plasma High-cholesterol (i.e., pI-pC-treated,
n = 7) had not progressed and differed significantly from that in high-cholesterol controls at 40 weeks (i.e., PBS-treated, n = 6) (*P,0.005). Figure 1A is
shown for comparison; red line indicates mice with low plasma cholesterol. (B–D) One week of low levels of cholesterol (30-week-old mice) did not
affect lesion size (P= 0.96), (B) Shown are percent relative changes in lesion area. Figure 1A is shown for comparison; red line indicates the
low-cholesterol group. (C) The numbers of foam cells (P= 0.52), endothelial cells (P= 0.49), smooth muscle cells (P= 0.18) (SMC), and T cells (P= 0.34) and
(D) the staining of Oil-red-O (upper panels) and fluorescence of anti-rat antibodies binding to rat anti mouse CD68 (lower panels) in representative sections isolated from the aortic root of high-cholesterol (left panels) and low-cholesterol (right panels) mice. Arrows indicate Oil-red-O stained lesions.
A
GYPC
PVRL2
AGPAT3
CD36
HSDL2
PPAR
HMGB3
AGL
-14%
-37%
-25%
-30%
77%
-28%
0%
GYPC
PVRL2
AGPAT3
CD36
HSDL2
PPARA
HMGB3
AGL
-14%
-37%
-25%
-30%
77%
19%
-28%
0%
B
Control
PPARA
HSDL2
PVRL2
-30%
0%
+19%
+77 %
Figure 4. A regulatory gene network of foam-cell formation.Twelve cholesterol-responsive atherosclerosis genes (Table S12, in bold) were targeted in THP-1 macrophages using siRNA. Two days after transfection, siRNA-targeted macrophages and controls treated with nonspecific siRNA
were incubated with AcLDL (50mg/mL) for 48 hours; total RNA was isolated, and CE and lipid accumulation were determined. (A) Sixteen expression
profiles (HG-U133_Plus_2 arrays, Affymetrix) from 12 siRNA experiments and four pooled controls were used to generate the regulatory gene network (Results) of 8 cholesterol-responsive genes involved in foam-cell formation, including PPARA and CD36. CE accumulation (given as average percentage next to each node) was decreased (blue) by siRNA inhibition of 5 genes and increased (red) by inhibition of 2 genes; inhibition of 1 gene had no effect (black) (see also Table 3). (B) Representative siRNA treated THP-1 cells after 48 incubation with AcLDL and stained with Oil-red-O. doi:10.1371/journal.pgen.1000036.g004
Table 2.siRNA inhibition of eight cholesterol-responsive network genes in THP-1 macrophages incubated with acetylated LDL.
Gene symbol
Control (relative mRNA levels)
siRNA knock (relative
mRNA levels) P-value
siRNA inhibition (%
relative control) siRNA assay IDa
AGL 1.0460.09 0.3760.17 ,0.001 64 110579
AGPAT3 1.0060.09 0.3160.04 ,0.001 69 112079
CD36 1.0260.12 0.3560.02 ,0.001 66 105939
GYPC 1.0060.09 0.4860.11 ,0.001 52 11041
HSDL2 1.4160.13 0.3660.03 ,0.001 74 33815
HMGB3 1.1060.05 0.3860.04 ,0.001 65 145247
PPARA 1.1960.20 0.3760.05 ,0.001 69 291496
PVRL2 1.2660.16 0.4460.03 ,0.001 65 12251
humans, the timing of therapies to prevent or slow atherosclerosis development may be very important. Indeed, in these mice, the formation of advanced plaques was all together prevented by genetic lowering of plasma cholesterol immediately before the rapid lesion expansion (Figure 3A).
In contrast to mRNA profiles isolated during lesion develop-ment, the extent and relative composition of different cell types in the lesions were similar before and after the subacute lowering of plasma cholesterol (Figure 3B–3D). Thus, in this case the changes in mRNA concentration monitored by the GeneChips reflect actual changes in cellular mRNA levels. Since the accumulation of lipids in macrophages was a central process in the rapid lesion expansion and formation of advance plaques (clusters 1 and 3 in Figure 2A–2C), we used siRNA in THP-1 macrophages incubated with AcLDL to validate the cholesterol-responsive genes (Table S12). Eight genes were found to belong to a regulatory gene
network in whichPVRL2and HSDL2 had central roles. Little is
known about PVRL2 and HSDL2 (generating 6 and 3 hits in
PubMed, respectively). A sequence variant inPVRL2is associated
with the severity of multiple sclerosis [13]. HSDL encodes the
sterol carrier protein-2, a small intracellular basic protein domain
that enhances the transfer of lipids between membranes in vitro
[14].
Although pointing out isolated candidates as being more promising than others is tempting, the lesson from whole-genome approaches will most certainly be that complex diseases like atherosclerosis will not be defeated by targeting single genes (probably not even single regulatory genes) but instead to target several genes belonging to a similar network of pathology [9,15]. This notion is supported by studying a small gene network as the present (Figure 4A) where none of the nodes (i.e., genes) can be said to solely promote or inhibit foam-cell formation.
Our findings imply that the timing of interventions with plasma cholesterol-lowering agents may be very critical. Patients at risk of developing complications of atherosclerosis (e.g., stroke and MI) may benefit from being treated very early in life. The development of noninvasive technologies to detect early athero-sclerosis or molecular markers of atheroathero-sclerosis stages will be important in this respect. For normo-cholesterolemic individuals but with other atherosclerosis risk factors, novel regimens targeting atherosclerosis genes that mediate the beneficial effects of plasma cholesterol-lowering may be useful. In summary, the network of cholesterol-responsive atherosclerosis target genes and regulators of foam-cell formation identified in our study merits further attention.
Materials and Methods
The Mouse Model TheLdlr2/2Apob100/100
Mttpflox/floxMx1-Cremouse model has a plasma lipoprotein profile similar to that of familial hypercholes-terolemia, which causes rapid progression of atherosclerosis [7].
ForMttpdeletion, mice were injected with 500ml of pI-pC (1mg/
ml; Sigma, St. Louis, MO) every other day for 6 days to induceCre
expression, thereby recombining Mttp (MttpD/D) or not in the
Ldlr2/2Apob100/100
Mttpwt/wt Mx1-Cre mice. Littermate controls
received PBS (Mttpflox/flox). The study mice had been back crossed
5 times to C57BL/6 (,5% 129/SvJae and .95% C57BL/6),
were housed in a pathogen-free barrier facility (12-hour light/ 12-hour dark cycle), and were fed rodent chow containing 4% fat. Genotypes were determined by polymerase chain reaction (PCR) with genomic DNA from tail biopsies. Plasma cholesterol and triglyceride concentrations were determined in non-fasted blood samples with colorimetric assays (Infinity cholesterol/triglyceride kits; Thermo Electron, Melbourne, Australia), and plasma glucose levels with Precision Xtra (MediScience, Cherry Hill, NJ).
En FaceAnalysis and Histology
Aortas were pinned out flat on black wax surfaces as described [16], stained with Sudan IV, photographed with a Nikon SMZ1000 microscope, and analyzed with Easy Image Analysis 2000 software (Tekno Optik, Ska¨rholmen, Sweden). Lesion area was calculated as a percentage of the entire aortic surface between the aortic root and the iliac bifurcation. Aortic roots were isolated and immediately frozen in liquid nitrogen in OCT compound
(Histolab, Va¨stra Fro¨lunda, Sweden). Cryosections (20mm) were
cut and stained with hematoxylin (Htx) and Oil-red-O as
described [17]; other sections (6–8mm) were incubated first with
rat anti-mouse CD68 antibody or a control antibody (Serotec,
Oxford, England) overnight at 4uC and then with fluorescent
anti-rat IgG (Vector Laboanti-ratories, Burlingame, CA) and counter-stained with mounting medium containing DAPI (Vector Laboratories).
Transcriptional Profiling
Aortas were perfused with RNAlater (Qiagen, Valencia, CA), and the aortic arch from above the third rib to the aortic root was removed and homogenized with FastPrep (Qbiogene, Irvine, CA). Total RNA was isolated with RNeasy Mini Kit (Qiagen) using a DNAse I treatment step. RNA quality was assessed with a Bioanalyzer 2100 (Agilent Technologies, Santa Clara, CA).
Table 3.Effects of siRNA inhibition of eight cholesterol-responsive network genes on cholesterol-ester accumulation in THP-1 macrophages incubated with acetylated LDL.
Gene symbol Control (relative CE levels) siRNA knock (relative CE levels) P-value CE content (% relative control) Oil-Red-O staining
AGL 100615 62622 ,0.001 237 decreased
AGPAT3 98617 85617 ns 214 decreased
CD36 8962 6762 ,0.001 225 decreased
GYPC 100634 99652 ns nd
-HSDL2 100615 177610 ,0.001 +77 increased
HMGB3 97610 70620 ns 228 decreased
PPARA 12665 150613 ,0.05 +19 increased
PVRL2 10068 70613 0.002 230 decreased
High-quality RNA samples (32 fromMttpflox/flox, 5 fromMttpD/D,
and 9 Mttpwt/wt mice) were used for global gene expression
measurements with cDNA arrays (Mouse Genome 430 2.0 GeneChips, Affymetrix, Santa Clara, CA) at 10 (n = 7, PBS), 20
(n = 5, PBS), 30 (n = 6, PBS+5, pI-pC), 40 (n = 5), 50 (n = 5), and
60 (n = 4) weeks. In addition at 30 weeks, 9 Mttpwt/wt
(n = 5,
PBS+4, pI-pC). All samples were prepared with the two-cycle
protocol recommended by the manufacturer. Arrays were scanned with GeneChip Scanner 3000 and analyzed with GeneChip Operating Software (Affymetrix).
Text Mining and Prior Atherosclerosis Knowledge Automated text mining of PubMed was used to establish lists of genes related to atherosclerosis, foam cells, smooth muscle cells, endothelial cells, and T cells. Briefly, a gene was considered related if it co-occurred with any of the following terms in the abstract of
an article in PubMed:atherosclerosis,arteriosclerosis
(‘‘atherosclerosis-related’’, Table S1), foam cell, macrophage, monocyte (‘‘foam cell
related’’, Table S2), smooth muscle cell (Table S3), endothelial cell
(Table S4), and T-cell (Table S5). These tables constitute fairly
comprehensive but not specific lists of genes with possible roles in atherosclerosis or in the cell types involved in atherosclerosis (i.e., may contain false positives but a low number of false negatives) with a substantial overlap (Figure S1). We also generated a list of ‘‘established’’ atherosclerosis genes by manually extracting from recent reviews genes known to be important in atherosclerosis (Table S6).
siRNA of THP-1 Macrophages Incubated with Acetylated-LDL
Monocytes of the human monocytic cell line THP-1 were plated in six-well culture dishes (Becton Dickinson Labware, NJ)
at 66105cells/well in 10% fetal calf serum (FCS)-RPMI-1640
medium with L-glutamine (2 mM) and HEPES buffer (25 mM) (Gibco-Invitrogen, Carlsbad, CA) supplemented with penicillin
(100 U/mL) and streptomycin (100mg/mL) (PEST) and induced
to differentiate into macrophages with phorbol 12-myristate 13-acetate (PMA) (50 ng/mL) (Sigma) for 72 hours. For each gene, cells were transfected with up to three siRNAs (Ambion, Austin, TX), using Lipofectamine 2000 according to the manufacturer’s instructions (Invitrogen), in medium without FCS, PEST, and PMA. Two days after transfection, siRNA-targeted macrophages and mock-treated controls (nonspecific siRNA) were incubated
with AcLDL (50mg/mL) for 48 hours in 1% FCS medium with
PEST. AcLDL was prepared as described [18]. The samples
were dialyzed against PBS at 4uC. AcLDL protein concentration
was determined by the Bradford method. LDL was isolated from the plasma of healthy donors by sequential ultracentrifugation [19].
Lipid, Protein, and Gene Expression Measurements For lipid imaging, THP-1-derived foam cells were fixed with 10% formaldehyde in PBS for 10 min and washed twice with PBS. The cells were stained with Oil-red-O (0.3% in 60% isopropanol) for 20 min, washed twice with 60% isopropanol and twice with
PBS, and examined with a Nikon Eclipse E800 microscope at 406
magnification. Lipids were isolated by hexan/isopropanol (3:2) extraction at room temperature for 1 hour followed by 0.5 ml chloroform for 15 min [20]. The lipid extracts were dried and
resuspended in 80ml of isopropanol with 1% Triton-X-100
(Sigma). The lipid content of the foam cells was determined by enzymatic assays using the Infinity kit for total cholesterol (Thermo Electron) and a kit for free cholesterol (Wako Chemicals,
Richmond, VA). After lipid extraction, proteins were extracted from the same wells by incubation with 0.5 M sodium hydroxide
for 5 hours at 37uC. Protein concentration was determined by the
Bradford method.
For HG-U133_Plus_2 array analysis (Affymetrix) and to determine the degree of knockdown by siRNA, total RNA was isolated from the AcLDL-incubated THP-1 cells with RNeasy Mini-kit (Qiagen). The concentration was determined with a spectrophotometer (ND-100, NanoDrop Technologies,
Wilming-ton, DE). For cDNA synthesis, 0.5mg of total RNA was reverse
transcribed with Superscript II (Invitrogen) according to the
manufacturer’s protocol. After 5-fold dilution, cDNA (3mL) was
amplified by real-time PCR with 16TaqMan universal PCR
master mix (Applied Biosystems, Foster City, CA) on an ABI Prism 7000 (PE Biosystems) and software according to the manufacturer’s protocol. Assay-On-Demand Kits containing corresponding primers and probes from Applied Biosystems were used, and expression values were normalized to acidic ribosomal phosphoprotein P0. Each sample was analyzed in duplicate (Text S1).
Statistics and Calculations
Differences in the mRNA levels of selected genes, mouse plasma measurements, and lesion surface areas between time points were
analyzed with unpairedttests. Gene expression signal-level data
were computed with MAS 5.0 (Affymetrix) using default settings, log-transformed, and normalized to total intensities (global scaling). After normalization, signal intensities were computed for each gene in the Mouse Genome Informatics Database (MGD genes, Jackson Laboratory, www.jax.org) by averaging the signal of the corresponding Affymetrix probe sets. Of the 11,979 GeneChip probe sets (Mouse Genome 430 2.0 GeneChips, Affymetrix) that had no match in the database, 1.5% were
differentially expressed (false discover rate (FDR),0.05, n = 177),
representing the fraction of genes/probe sets that were not considered for further analyses. The remaining 33,122 probe sets had at least one match in 19,879 MGD genes (of a total of 32,095). Lowess normalization [21] was applied in pair-wise fashion before differential expression testing. To correct for multiple testing when computing probabilities of differential expression and FDRs, we used empirical Bayes statistics [8]. Clustering was performed with the FindCluster algorithm in Mathematica 5.1 (Wolfram Re-search, Champaign, IL). GO and pathway analyses were performed with EASE software [22]. The regulatory gene network of THP-1 macrophages incubated with AcLDL was inferred as described [9].
Supporting Information
Figure S1 Relations between the cell-type textmining lists in Tables S2, S3, S4, and S5
Found at: doi:10.1371/journal.pgen.1000036.s001 (0.36 MB EPS)
Table S1 Textmining list, Atherosclerosis
Found at: doi:10.1371/journal.pgen.1000036.s002 (0.24 MB XLS)
Table S2 Textmining list, Macrophages
Found at: doi:10.1371/journal.pgen.1000036.s003 (0.32 MB XLS)
Table S3 Textmining list, Smooth muscle cells (SMCs). Found at: doi:10.1371/journal.pgen.1000036.s004 (0.30 MB XLS)
Found at: doi:10.1371/journal.pgen.1000036.s005 (0.22 MB XLS)
Table S5 Textmining list, T-cells
Found at: doi:10.1371/journal.pgen.1000036.s006 (0.37 MB XLS)
Table S6 List of established atherosclerosis genes with t-test p-values
Found at: doi:10.1371/journal.pgen.1000036.s007 (0.03 MB XLS)
Table S7 Cell-specific markers.
Found at: doi:10.1371/journal.pgen.1000036.s008 (0.02 MB XLS)
Table S8 Gene list, lesion cluster 1
Found at: doi:10.1371/journal.pgen.1000036.s009 (0.06 MB XLS)
Table S9 Gene list, lesion cluster 2
Found at: doi:10.1371/journal.pgen.1000036.s010 (0.06 MB XLS)
Table S10 Gene list, lesion cluster 3
Found at: doi:10.1371/journal.pgen.1000036.s011 (0.06 MB XLS)
Table S11 Gene list, lesion cluster 4
Found at: doi:10.1371/journal.pgen.1000036.s012 (0.05 MB XLS)
Table S12 List of 37 cholesterol-responsive genes.
Found at: doi:10.1371/journal.pgen.1000036.s013 (0.03 MB XLS)
Table S13 GO analysis, lesion cluster 1
Found at: doi:10.1371/journal.pgen.1000036.s014 (0.21 MB XLS)
Table S14 GO analysis, lesion cluster 2
Found at: doi:10.1371/journal.pgen.1000036.s015 (0.15 MB XLS)
Table S15 GO analysis, lesion cluster 3
Found at: doi:10.1371/journal.pgen.1000036.s016 (0.17 MB XLS)
Table S16 GO analysis, lesion cluster 4
Found at: doi:10.1371/journal.pgen.1000036.s017 (0.13 MB XLS)
Table S17 KEGG and Biocarta pathway analysis, lesion cluster 1
Found at: doi:10.1371/journal.pgen.1000036.s018 (0.01 MB XLS)
Table S18 KEGG and Biocarta pathway analysis, lesion cluster 2
Found at: doi:10.1371/journal.pgen.1000036.s019 (0.01 MB XLS)
Table S19 KEGG and Biocarta pathway analysis, lesion cluster 3
Found at: doi:10.1371/journal.pgen.1000036.s020 (0.01 MB XLS)
Table S20 KEGG and Biocarta pathway analysis, lesion cluster 4
Found at: doi:10.1371/journal.pgen.1000036.s021 (0.01 MB XLS)
Table S21 KEGG and Biocarta pathway analysis, all genes Found at: doi:10.1371/journal.pgen.1000036.s022 (0.01 MB XLS)
Table S22 Transcription factors in lesion cluster 1
Found at: doi:10.1371/journal.pgen.1000036.s023 (0.02 MB XLS)
Table S23 Transcription factors in lesion cluster 2
Found at: doi:10.1371/journal.pgen.1000036.s024 (0.01 MB XLS)
Table S24 Transcription factors in lesion cluster 3
Found at: doi:10.1371/journal.pgen.1000036.s025 (0.02 MB XLS)
Table S25 Transcription factors in lesion cluster 4
Found at: doi:10.1371/journal.pgen.1000036.s026 (0.01 MB XLS)
Text S1 Supporting Methods
Found at: doi:10.1371/journal.pgen.1000036.s027 (0.03 MB DOC)
Acknowledgments
We thank Professor Stephen G. Young (University of California, Los Angeles) for help providing the mice.
Author Contributions
Conceived and designed the experiments: JS JB. Performed the experiments: JS JL AK JB. Analyzed the data: JS JL AK RN PN SM MK JT JB. Contributed reagents/materials/analysis tools: JS AH JB. Wrote the paper: JS JB.
References
1. Ong HT (2005) The statin studies: from targeting hypercholesterolaemia to targeting the high risk patient. Qjm 98: 599–614.
2. Grines CL (2006) The role of statins in reversing atherosclerosis: What the latest regression studies show. J Interv Cardiol 19: 3–9.
3. Tuomisto TT, Binder BR, Yla-Herttuala S (2005) Genetics, genomics and proteomics in atherosclerosis research. Ann Med 37: 323–332.
4. Venter JC, Adams MD, Myers EW, Li PW, Mural RJ, et al. (2001) The sequence of the human genome. Science 291: 1304–1351.
5. Lander ES, Linton LM, Birren B, Nusbaum C, Zody MC, et al. (2001) Initial sequencing and analysis of the human genome. Nature 409: 860–921. 6. Waterston RH, Lindblad-Toh K, Birney E, Rogers J, Abril JF, et al. (2002)
Initial sequencing and comparative analysis of the mouse genome. Nature 420: 520–562.
7. Lieu HD, Withycombe SK, Walker Q, Rong JX, Walzem RL, et al. (2003) Eliminating atherogenesis in mice by switching off hepatic lipoprotein secretion. Circulation 107: 1315–1321.
8. Efron B, Tibshirani R, Storey J, Tusher V (2001) Empirical Bayes analysis of a microarray experiment. J Am Stat Assoc 96: 1151–1160.
9. Tegner J, Yeung MK, Hasty J, Collins JJ (2003) Reverse engineering gene networks: integrating genetic perturbations with dynamical modeling. Proc Natl Acad Sci U S A 100: 5944–5949.
10. Nicholson AC, Han J, Febbraio M, Silversterin RL, Hajjar DP (2001) Role of CD36, the macrophage class B scavenger receptor, in atherosclerosis. Ann N Y Acad Sci 947: 224–228.
11. Hennuyer N, Tailleux A, Torpier G, Mezdour H, Fruchart JC, et al. (2005) PPARalpha, but not PPARgamma, activators decrease macrophage-laden atherosclerotic lesions in a nondiabetic mouse model of mixed dyslipidemia. Arterioscler Thromb Vasc Biol 25: 1897–1902.
12. Libby P, Geng YJ, Aikawa M, Schoenbeck U, Mach F, et al. (1996) Macrophages and atherosclerotic plaque stability. Curr Opin Lipidol 7: 330–335.
13. Schmidt S, Pericak-Vance MA, Sawcer S, Barcellos LF, Hart J, et al. (2006) Allelic association of sequence variants in the herpes virus entry mediator-B gene (PVRL2) with the severity of multiple sclerosis. 7: 384–392.
15. Tegner J, Skogsberg J, Bjorkegren J (2007) Thematic review series: systems biology approaches to metabolic and cardiovascular disorders. Multi-organ whole-genome measurements and reverse engineering to uncover gene networks underlying complex traits. J Lipid Res 48: 267–277.
16. Veniant MM, Sullivan MA, Kim SK, Ambroziak P, Chu A, et al. (2000) Defining the atherogenicity of large and small lipoproteins containing apolipoprotein B100. J Clin Invest 106: 1501–1510.
17. Stotz E, Schenk EA, Churukian C, Willis C (1986) Oil red O: Comparison of staining quality and chemical components as determined by thin layer chromatography. Stain Technol 61: 187–190.
18. Basu SK, Goldstein JL, Anderson GW, Brown MS (1976) Degradation of cationized low density lipoprotein and regulation of cholesterol metabolism in
homozygous familial hypercholesterolemia fibroblasts. Proc Natl Acad Sci U S A 73: 3178–3182.
19. Redgrave TG, Carlson LA (1979) Changes in plasma very low density and low density lipoprotein content, composition, and size after a fatty meal in normo-and hypertriglyceridemic man. J Lipid Res 20: 217–229.
20. Christoffersen C, Nielsen LB, Axler O, Andersson A, Johnsen AH, et al. (2006) Isolation and characterization of human apolipoprotein M-containing lipopro-teins. J Lipid Res 47: 1833–11843.
21. Cleveland W (1979) Robust locally weighted regression and smoothing scatterplots. J Am Statist Assoc 74: 829–836.