Gene and MicroRNA Expression Responses to
Exercise; Relationship with Insulin Sensitivity
Carrie S. McLean2, Clinton Mielke2, Jeanine M. Cordova2, Paul R. Langlais3, Benjamin Bowen2, Danielle Miranda3, Dawn K. Coletta2, Lawrence J. Mandarino1,3*
1School for the Science of Health Care Delivery, Arizona State University, Tempe, Arizona, United States of America,2School of Life Sciences, Arizona State University, Tempe, Arizona, United States of America, 3Mayo Clinic in Arizona, Scottsdale, Arizona, United States of America
Abstract
Background
Healthy individuals on the lower end of the insulin sensitivity spectrum also have a reduced gene expression response to exercise for specific genes. The goal of this study was to de-termine the relationship between insulin sensitivity and exercise-induced gene expression in an unbiased, global manner.
Methods and Findings
Euglycemic clamps were used to measure insulin sensitivity and muscle biopsies were done at rest and 30 minutes after a single acute exercise bout in 14 healthy participants. Changes in mRNA expression were assessed using microarrays, and miRNA analysis was performed in a subset of 6 of the participants using sequencing techniques. Following exer-cise, 215 mRNAs were changed at the probe level (Bonferroni-corrected P<0.00000115). Pathway and Gene Ontology analysis showed enrichment in MAP kinase signaling, tran-scriptional regulation and DNA binding. Changes in several transcription factor mRNAs were correlated with insulin sensitivity, including MYC, r=0.71; SNF1LK, r=0.69; and ATF3, r= 0.61 (5 corrected for false discovery rate). Enrichment in the 5’-UTRs of exercise-responsive genes suggested regulation by common transcription factors, especially EGR1. miRNA species of interest that changed after exercise included miR-378, which is located in an intron of the PPARGC1B gene.
Conclusions
These results indicate that transcription factor gene expression responses to exercise de-pend highly on insulin sensitivity in healthy people. The overall pattern suggests a coordi-nated cycle by which exercise and insulin sensitivity regulate gene expression in muscle. OPEN ACCESS
Citation:McLean CS, Mielke C, Cordova JM, Langlais PR, Bowen B, Miranda D, et al. (2015) Gene and MicroRNA Expression Responses to Exercise; Relationship with Insulin Sensitivity. PLoS ONE 10(5): e0127089. doi:10.1371/journal.pone.0127089
Academic Editor:Cedric Moro, INSERM/UMR 1048, FRANCE
Received:November 26, 2014
Accepted:April 10, 2015
Published:May 18, 2015
Copyright:© 2015 McLean et al. This is an open access article distributed under the terms of the
Creative Commons Attribution License, which permits unrestricted use, distribution, and reproduction in any medium, provided the original author and source are credited.
Data Availability Statement:The microarray analysis raw data files, metadata and matrix table were deposited in the Gene Expression Omnibus (GEO) (http://www.ncbi.nlm.nih.gov/geo/query/acc. cgi?acc=GSE43219). MicroRNA sequencing data also was deposited in the Gene Expression Omnibus (GEO) (GSE66334).
Introduction
The global gene expression response of skeletal muscle to acute exercise has been characterized
recently in healthy men [1]. In the immediate post-exercise period, many genes are increased in
expression, and among these are transcription factors (NR4A, EGR1, JUNB, FOS), angiogenic factors such as CYR61, proteins involved in extracellular matrix turnover such as ADAMTS4, and genes in the MAP kinase signaling pathway. The enrichment of transcription factors in ex-ercise early-responsive genes suggests that there is a coordinated transcriptional response that regulates gene expression responses to acute exercise and exercise training, including increases in expression of genes involved in mitochondrial function and aerobic metabolism, which are
linked to insulin action [2].
Skeletal muscle contraction and insulin action are inter-twined [3,4]. Acute exercise and
ercise training have a variety of effects on gene expression, ranging from effects on GLUT4
ex-pression to mitochondrial biogenesis and adaptations in structural proteins [5–15]. In addition
to its effects on aerobic capacity and performance, exercise improves insulin sensitivity in skel-etal muscle. However, it has become clear that greater insulin sensitivity itself also influences
the acute gene expression response of skeletal muscle to exercise [6], potentially leading to a
feed-forward virtuous cycle.
There is a broad range of insulin sensitivity in skeletal muscle in healthy humans [2]. We
have shown that even among healthy, nondiabetic individuals, those on the lower end of the
dis-tribution of insulin action have lower gene expression responses to exercise [6]. This pattern of
expression differences suggests that there may be different transcription factor responses to ex-ercise that are related to insulin sensitivity in healthy individuals. Previous studies have shown
that PGC-1αmRNA and protein responses to exercise may in part be responsible for some of
these differences [6]. To date, however, there has been no global, unbiased analysis that has
identified an array of exercise-induced transcription factors and other genes that might be relat-ed to insulin sensitivity. Therefore, the primary purpose of this study was to determine whether in healthy individuals there is insulin sensitivity-based variation in exercise-induced early re-sponse of skeletal muscle genes, particularly those coding for transcription factors.
It also has become evident that not only does gene expression in muscle change after acute exercise, but the expression of microRNAs (miRNAs) also can be affected by endurance
exer-cise [13] resistance exercise [16], aging [17], and plays a role in muscle plasticity [18]. miRNAs
are small, 22–25 nt RNA species that are widespread throughout the genome. They reside in in-trons of genes or in other noncoding regions and act by binding to the 3’UTR of messages to
decrease translation or mRNA stability [19]. When miRNAs are present within introns, they
often participate in regulation of the pathways involving the“parent”gene. Although miRNAs
generally reduce abundance of proteins coded by the mRNAs with which they interact, they also can increase protein and mRNA abundance when they target inhibitors of transcription.
Several miRNAs respond to exercise [13,16], although no unbiased, global analysis has been
done, and there is very little known about this or whether miRNA expression after exercise might be related to insulin sensitivity. Therefore, the second purpose of this study was to char-acterize the global miRNA response to acute exercise in muscle from healthy volunteers with a wide range of insulin sensitivity.
Methods
Participants
Fourteen normoglycemic volunteers took part in this study, which was approved by the Institu-tional Review Board of Arizona State University. All studies were conducted at the Clinical
Research Unit at ASU. Informed, written consent was obtained from all subjects. All of the vol-unteers were sedentary, and no one reported having a change in body weight for at least 6 months before participating in this study. Subjects were instructed not to exercise for 48 hours before study and to maintain their usual diet. All subjects were sedentary and did not report a family history of type 2 diabetes. A medical history, physical examination, 12-lead electrocar-diogram, and a complete chemistry panel were obtained, and a 75-g oral glucose tolerance test was performed using American Diabetes Association criteria. No one was taking any
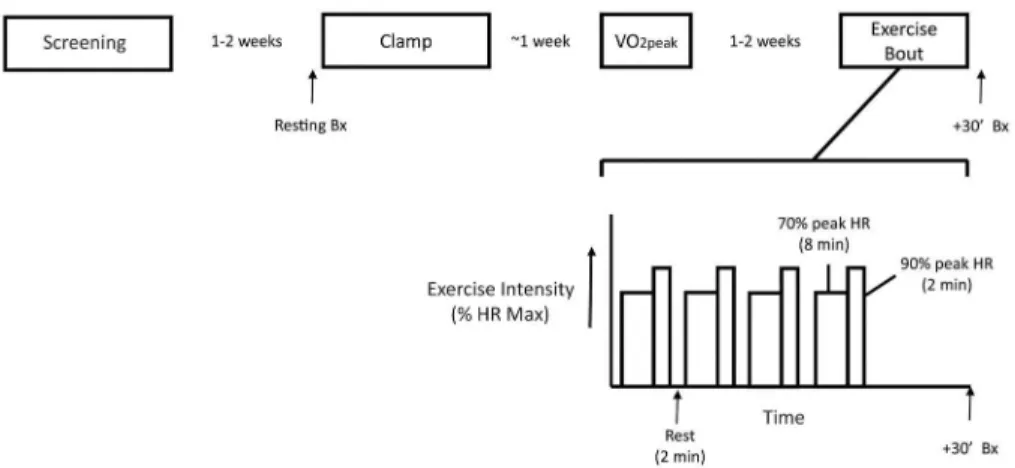
medica-tion known to affect glucose metabolism. The design of the study is shown inFig 1.
Procedures
Peak aerobic capacity. Peak aerobic capacity (VO2peak) was determined as previously
de-scribed, with continuous heart rate monitoring [5]. Exercise was started at a workload of 40 W
and increased by 10 W/min until perceived exhaustion or a respiratory quotient of 1.10 was reached.
Muscle biopsy and hyperinsulinemic euglycemic clamp. Euglycemic clamps and muscle
biopsies were performed as described [20]. On a day separated from exercise tests by at least
one week, and after a 10-h overnight fast, a percutaneous biopsy of thevastus lateralismuscle
was obtained with a Bergstrom cannula under local anesthesia one hour before the start of in-sulin infusion. This biopsy served as the resting, non-exercised control. An inin-sulin infusion
rate of 80 mUm-2min-1was used. The rate of glucose infusion required to maintain
euglyce-mia during the last 30 minutes of the insulin infusion was taken as an estimate of insulin-stim-ulated glucose disposal, since this insulin infusion rate effectively suppresses endogenous
glucose production [20].
Exercise bout with muscle biopsies. All subjects underwent a single bout of aerobic
exercise (Fig 1), which was conducted on a separate day after determination of VO2peak, as
de-scribed previously [6], and at least 1 week after the euglycemic hyperinsulinemic clamp.
Sub-jects reported to the Clinical Research Unit at about 7 AM after fasting overnight and exercised on a stationary bicycle. Immediately after completing exercise, the subject had a biopsy of the
vastus lateralismuscle within 30 min of the end of exercise. The total length of the exercise
Fig 1. Overall design of the study.The overall sequence of study days is shown above an expanded view of the acute exercise bout. During the acute exercise bout, subjects exercise for a total of 48 minutes, consisting of 4 sets of exercise, each set consisting of 8 minutes at 70% HR max, 2 minutes at 90% HR max, and 2 minutes of rest. A biopsy of thevastus lateralismuscle was taken at 30 minutes after completing the four sets of exercise. Bx, Biopsy; VO2, rate of oxygen consumption; HR, Heart Rate.
bout was 48 minutes, consisting of 4 sets, each composed of 8 minutes of cycling at 70% peak heart rate, 2 minutes at 90% peak, and 2 minutes rest.
RNA isolation, microarray processing and quantitative real time PCR analysis. Muscle
RNA was isolated as described [21]. Microarray analysis using the 4x44K Whole Human
Ge-nome Microarrays (Agilent Technologies, Palo Alto, CA) was performed as previously
de-scribed [22]. Quantitative real time PCR analyses for selected mRNAs were performed as
described [6]. Primers used for these analyses are given inS1 Table.
miRNA analysis. For miRNA analysis, RNA was isolated from frozen muscle using the miRNeasy kit (Qiagen, Valencia, CA). Small RNA libraries were prepared according to manufac-turer’s instructions for the NEBNext Multiplex Small RNA Kit (New England Biolabs; Ipswich, MA). miRNA sequencing was performed on Illumina HiSeq 2000 sequencers (Illumina, San Diego, CA) using Illumina’s standard protocol using the Illumina cBot and cBot Paired end clus-ter kit version 3. A total of 2227 miRNAs were sequenced; 16.0% of these probes were present in all specimens, 26.4% were present in greater than one half of subjects. In total, miRNA sequences were positively called for 27.3% of all 2227 possible sequences. The raw data files, metadata and matrix table were deposited in the Gene Expression Omnibus (GEO) (GSE66334).
Bioinformatics/statistics. Gene expression values were compared at the probe level. Ex-pression values for each probe on the array were log transformed. Pre and post exercise gene expression values in all subjects were compared by paired t-test, and P values were adjusted
using the Bonferroni correction (P<0.00000115). To test the hypothesis that insulin
sensitivi-ty is correlated with exercise-induced changes in gene expression, probe signals for mRNAs that significantly responded to exercise (stringent Bonferroni corrected P value) were correlat-ed with rates of insulin stimulatcorrelat-ed glucose disposal determincorrelat-ed with the euglycemic clamps,
using the Pearson product moment method (significance set at P<0.05). The raw data files,
metadata and matrix table were deposited in the Gene Expression Omnibus (GEO) (http://
www.ncbi.nlm.nih.gov/geo/query/acc.cgi?acc=GSE43219).
Analysis of the 5’untranslated regions (UTR) of genes responsive to exercise was conducted
using PScan software [23], using both the JASPAR [24] and TRANSFAC databases [25]. We
used the -950 to +50 5’UTR region of genes in PScan as the control for statistical analysis and
used the stringent Bonferroni P values to determine significance of enrichment of response ele-ments in promoters. Transcription factor binding motif enrichment concordant using both da-tabases was considered significant. For miRNA sequencing, SCS version 1.4.8 data collection software was used. Base-calling was performed using Illumina’s RTA version 1.12.4.2. A miRNA data analysis pipeline using Casava 1.8 and Flicker 3.0 was used to generate miRNA gene list counts. miRNA target analysis was performed using the microT-CDS tool available
through Diana Tools (http://diana.imis.athena-innovation.gr/DianaTools/index.php?r = site/
index) [26,27]. Database for Annotation, Visualization and Integrated Discovery (DAVID) (http://david.niaid.nih.gov) was used for all KEGG pathway and Gene Ontology (GO) analysis.
Analytical determinations. Plasma insulin concentrations were measured by
radioimmu-noassay (Diagnostic Product, Los Angeles, CA). Tracer to tracee ratio of glucose ([6,6-2H]
glu-cose/glucose) was determined using selective ion monitoring on a Finnigan Trace DSQ GS/MS (Thermo Electron Corporation, Waltham, MA, USA). Total cholesterol, triglyceride and HDL were measured by Sonora Quest Laboratories, Phoenix, AZ.
Results
Subject characteristics, insulin sensitivity, and exercise bout
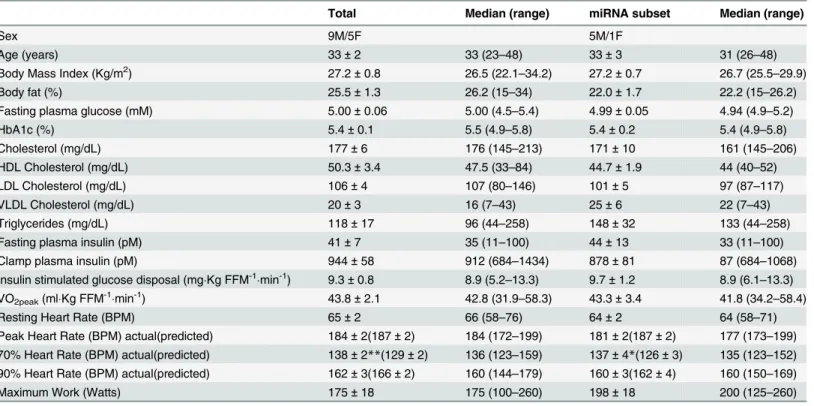
Participant characteristics are given inTable 1. A total of 14 subjects took part in the study. All
by design (5.2–13.3 mg(kg FFM)-1min-1). All subjects were sedentary. Peak aerobic exercise
capacity (VO2peak) for all 14 subjects was not correlated with insulin stimulated glucose
dispos-al (r = 0.08, P = NS), or BMI (r = -0.02, P = NS). Subjects achieved the desired 70 and 90% of maximum heart rates during each of the four sets of exercise. Characteristics of the subset of 6
(of the total of 14 subjects) who also had miRNA determinations also are given inTable 1.
Ex-ercise characteristics of the participants also are given inTable 1. Subjects achieved the desired
70 and 90% if peak heart rate values during each of the 4 sets of the exercise bout.
Effects of exercise on gene expression in skeletal muscle
Changes in gene expression were assessed using RNA isolated from muscle samples taken under resting conditions and 30 minutes after the completion of exercise. In all subjects,
exer-cise altered mRNA expression significantly for 215 probes (S2 Table, Bonferroni corrected
P<0.00000115). The majority of these probes, nearly 200, increased in expression. Prominent
among the genes represented by the probes that increased in expression were transcription fac-tors (54/215 significant probes), including MYC, JUN, FOS, ATF3, ID1-3, and CTGF. Probes for chemokines and related genes also were well represented (16/215), and included CX3CL1, CCL2, and two metallopeptidases, ADAMTS4 and ADAMTS1. Probes for genes involved in regulation of cell cycle (9/215) included GADD45B and RASSF1. Probes for genes encoding proteins involved in angiogenesis also were represented, including CYR61 and VEGFa. Table 1. Participant characteristics.
Total Median (range) miRNA subset Median (range)
Sex 9M/5F 5M/1F
Age (years) 33±2 33 (23–48) 33±3 31 (26–48)
Body Mass Index (Kg/m2) 27.2±0.8 26.5 (22.1
–34.2) 27.2±0.7 26.7 (25.5–29.9)
Body fat (%) 25.5±1.3 26.2 (15–34) 22.0±1.7 22.2 (15–26.2)
Fasting plasma glucose (mM) 5.00±0.06 5.00 (4.5–5.4) 4.99±0.05 4.94 (4.9–5.2)
HbA1c (%) 5.4±0.1 5.5 (4.9–5.8) 5.4±0.2 5.4 (4.9–5.8)
Cholesterol (mg/dL) 177±6 176 (145–213) 171±10 161 (145–206)
HDL Cholesterol (mg/dL) 50.3±3.4 47.5 (33–84) 44.7±1.9 44 (40–52)
LDL Cholesterol (mg/dL) 106±4 107 (80–146) 101±5 97 (87–117)
VLDL Cholesterol (mg/dL) 20±3 16 (7–43) 25±6 22 (7–43)
Triglycerides (mg/dL) 118±17 96 (44–258) 148±32 133 (44–258)
Fasting plasma insulin (pM) 41±7 35 (11–100) 44±13 33 (11–100)
Clamp plasma insulin (pM) 944±58 912 (684–1434) 878±81 87 (684–1068)
Insulin stimulated glucose disposal (mgKg FFM-1min-1) 9.3±0.8 8.9 (5.2
–13.3) 9.7±1.2 8.9 (6.1–13.3)
VO2peak(mlKg FFM-1min-1) 43.8±2.1 42.8 (31.9
–58.3) 43.3±3.4 41.8 (34.2–58.4)
Resting Heart Rate (BPM) 65±2 66 (58–76) 64±2 64 (58–71)
Peak Heart Rate (BPM) actual(predicted) 184±2(187±2) 184 (172–199) 181±2(187±2) 177 (173–199)
70% Heart Rate (BPM) actual(predicted) 138±2**(129±2) 136 (123–159) 137±4*(126±3) 135 (123–152) 90% Heart Rate (BPM) actual(predicted) 162±3(166±2) 160 (144–179) 160±3(162±4) 160 (150–169)
Maximum Work (Watts) 175±18 175 (100–260) 198±18 200 (125–260)
Data are given as Mean±SEM. The six volunteers in the miRNA subset are included in the total group of 14. Data are shown as Mean±SEM. Peak
heart rate was highest value achieved during the VO2peakdetermination. Maximum predicted heart rate = 220—age.
*P<0.05,
**P<0.01 vs. predicted value.
Kg, kilograms; mg, milligrams; dL, deciliter; pM, picomolar; FFM, fat free mass; BPM, beats per minute.
Although mRNA for only one gene encoding a mitochondrial protein was increased signifi-cantly (SLC25A25, mitochondrial phosphate carrier), a number of others increased but did not achieve the Bonferroni cutoff. Among these were several Complex I and ATP synthase sub-units, SLC2A4, or GLUT4 (P = 0.005) and PPARGC1B (P = 0.039). Only 17 mRNAs decreased significantly by the Bonferroni criterion. Among these were isoforms 1,4,6,7, and 8 of the GIMAP family of nucleotide binding proteins with GTPase activity. David analysis of the probes that had Bonferroni significant changes after exercise in all subjects showed 4.0 and
7.7-fold enrichment (false discovery rate5%) in MAP kinase and TGFβsignaling pathways
(S3 Table). Enrichment in GO molecular function terms was significant for regulation of tran-scription and GTP binding in the 215 probes entered into DAVID for analysis.
Quantitative rt-PCR assessment of gene expression
To confirm the microarray results, several mRNAs (EGR1, FOS, MYC, JUND, and CTGF) were selected for Q-rt-PCR assay of changes in gene expression induced by the exercise bout,
compared with microarray results (S1 Fig). Changes in gene expression determined by
Q-rt-PCR were concordant with changes in gene expression determined by microarray analysis (r = 0.86, P<0.05).
Analysis of 5’UTR of genes responding to exercise. To understand which transcription factors might be responsible for the exercise-induced responses of the 130 exercise-induced genes represented by the 215 probes, we analyzed the promoter regions (-950 to +50 bp) of these genes for enrichment in transcription factor response element binding motifs using
PScan [23]. We used response element profiles available in both the JASPAR [24] and
TRANS-FAC [28] databases. Transcription factors of interest that were enriched in the promoter
re-gions of exercise-responsive genes included SP1, KLF4, NFKB, RELA, and EGR1 (S4 Table).
The correlation between insulin stimulated glucose disposal and exercise induced changes in gene expression was significant for the transcription factors NFKB1 and RELA.
Relationships between insulin sensitivity and gene expression response
to exercise
To determine the relationships between insulin sensitivity and significant gene expression changes after exercise, fold changes in Bonferroni significant gene expression were correlated with rates of insulin stimulated glucose disposal during a euglycemic clamp. The comparison was done at the probe level, using P values corrected for a false discovery rate of 0.25 using the Benjamini Hochberg method. The results for the three significant correlations are shown in
Fig 2, and included MYC, ATF3, and SNF1LK.
Effects of exercise on miRNA expression. To quantify miRNA expression, we isolated
RNA separately (seeMethods) from a subset of 6 individuals who had sufficient muscle biopsy
material remaining after mRNA analyses. miRNA expression was quantified using next gener-ation sequencing techniques from biopsies taken basally and 30 minutes after completion of
the exercise bout. Data, expressed as normalized reads and log2(fold increase with exercise) are
given inTable 2. Thirteen miRNA species were altered significantly (Bonferroni corrected P
value) after exercise; all of these increased. Among these, several miRNAs in the miR-378
fami-ly, namely miR-378a-3p, -378a-5p, -378f, -378g, and -378i all increased. In general,“-3p”
spe-cies of miRNAs from a stem loop sequence are more abundant than the“-5p”species, being
selectively included in the RISC complex [29]. In keeping with this, miR-378a-3p was
sensitivity. Several miRNAs were in introns of genes involved in metabolic events, including miR-378a-3p and miR-378-5p (intron 1 of PPARGC1B, which also increased after exercise) and miR-378f (within the CNR2, cannabinoid receptor 2 gene). We also searched predicted mRNA targets of miRNAs that changed after exercise to determine overlap between those tar-gets and any exercise-induced mRNA changes. Only GIMAP8 and NRF4A3 mRNAs, predicted
targets of hsa-miR-10a-5p, also were exercise-responsive (S5 Table).
Fig 2. Relationships among response of genes (at the probe level) to exercise and insulin sensitivity. Shown are exercise-induced fold changes in expression for the indicated genes plotted against rates of insulin-stimulated glucose disposal during a euglycemic, hyperinsulinemic clamp. P values displayed for correlations were corrected using the Benjamini Hochberg method.
doi:10.1371/journal.pone.0127089.g002
Table 2. miRNA species changing significantly 30 minutes after exercise.
Mature miRNA Precursor Basal Post Exercise Log2(fold increase)
hsa-miR-10a-5p hsa-mir-10a 807±120 1056±134 0.408±0.101
hsa-miR-30a-5p hsa-mir-30a 3548±456 5155±327 0.570±0.102
hsa-miR-30d-5p hsa-mir-30d 4431±454 6425±595 0.541±0.127
hsa-miR-22-3p hsa-mir-22 7681±948 14180±1839 0.888±0.191
hsa-miR-128 hsa-mir-128-1 1593±173 3393±685 1.027±0.206
hsa-miR-128 hsa-mir-128-2 905±101 1941±410 1.022±0.235
hsa-miR-378a-3p hsa-mir-378a 24843±3181 40779±7614 0.688±0.169
hsa-miR-378f hsa-mir-378f 148±24 244±39 0.726±0.162
hsa-miR-378a-5p hsa-mir-378a 361±36 528±36 0.561±0.145
hsa-miR-378g hsa-mir-378g 75±16 117±32 0.611±0.160
hsa-miR-378i hsa-mir-378i 1550±230 2690±542 0.768±0.210
hsa-miR-422a hsa-mir-422a 74±16 124±36 0.689±0.163
hsa-miR-532-5p hsa-mir-532 298±59 682±152 1.160±0.339
Data are given as Means±SEM, units are number of specific reads normalized to total reads for a given sample. All changes shown for log2(fold stimulation) are P<0.0004 or less (Bonferroni correction to keep family-wise error rate at 0.05).
Discussion
A number of studies have examined how acute exercise alters gene expression in skeletal muscle
[9,10,13]. A recent global analysis showed that acute endurance exercise conducted by healthy,
middle-aged men has profound effects on gene expression in exercising muscle [1]. Among the
genes most profoundly increased in that study were NR4A family members, ADAMST1 (in-volved in extracellular matrix metabolism), and additional transcription factors including FOS,
JUNB, and EGR1 [1]. We confirmed here the previously reported exercise response for many of
those genes. However, we had shown previously that the period immediately following an exer-cise bout is critical for defining the exerexer-cise response particularly in relationship to insulin action
[6], and we proposed that lower gene expression responses to exercise in individuals with insulin
sensitivity on the lower end of the normal range might exacerbate a poor response to insulin. Therefore, the primary purpose of this study was to extend and enhance previous studies by de-termining how exercise-induced gene expression is influenced by insulin sensitivity in a global, unbiased manner.
To accomplish this, we performed microarray analysis of RNA isolated from muscle biop-sies taken at rest and 30 minutes after completion of exercise in 14 healthy subjects who also had euglycemic clamps to measure insulin sensitivity. This analysis revealed that, at the probe
level, 215 mRNAs were altered significantly (Bonferroni corrected P<0.0000015) by exercise.
The vast majority of these mRNAs (198) were increased following exercise. Genes encoding transcription factor or DNA binding proteins were the most represented (about 25%). Also represented were chemokines, cell cycle regulators, genes involved in angiogenesis, and extra-cellular matrix formation. Genes coding cell-signaling proteins also were represented, with the beta 2 adrenergic receptor and a proton-sensing G-protein coupled receptor (GPR4) increas-ing, along with mRNA for an orphan receptor, GPR157. Changes in mRNA of representative
genes were in general confirmed by Q-rt-PCR, as we noted previously [30]. Pathway and GO
term analysis using DAVID (http://david.niaid.nih.gov) confirmed that transcriptional
regula-tion and DNA binding GO terms were highly enriched. The MAP kinase pathway also was highly enriched, again reinforcing the notion that the immediate post-exercise period is charac-terized in healthy muscle by a broad response of transcription factors, stress response, growth and differentiation genes, and angiogenic factors. These early exercise-induced changes are likely to coordinate a longer term pattern of response. In this respect, the present findings
con-firm earlier results [1].
Because of the preponderance of transcription factors in exercise-responsive genes, we
fur-ther extended previous findings [1] and our earlier results [6] by analyzing the 5’-UTRs of all
exercise responsive genes to determine whether there might be a pattern of common
exercise-enhanced transcription factors that could be candidates for“master”regulators of the
immedi-ate post-exercise response. One of the more intriguing transcription factors that had a binding motif significantly enriched in exercise-responsive genes was EGR1, or early growth response 1
[31]. EGR1 itself had an 11.4-fold increase in expression after exercise. EGR1 is expressed in
re-sponse to a variety of stimuli [32] and is induced in electrically-contracted mouse muscle
with-in 30 mwith-inutes [33]. Other studies show that EGR1 is responsive to MAP kinase signaling [34],
which is interesting in light of the effect of exercise on MAP kinase pathway members. EGR1
also is involved in VEGF signaling [35]. These analyses, taken together with our earlier data
and previous findings, suggest the possibility that EGR1, through MAP kinase and VEGF sig-naling pathways, may integrate the early gene expression response to exercise.
However, the primary purpose of this study was to determine the relationship between insu-lin sensitivity in muscle and the gene expression response to exercise. It is commonly accepted
others reported previously that in healthy people muscle that has lower insulin sensitivity also
exhibits characteristics of“exercise resistance”, in that there are differences in gene expression
responses to exercise that might subsequently contribute to even lower insulin sensitivity or
al-tered mitochondrial function [6,7,11,36,37]. To address this question we correlated
exercise-induced changes in mRNA expression at the probe level with insulin sensitivity determined using a euglycemic clamp. To minimize false positives, for this analysis we only used probes that were changed at the Bonferroni significant level of 0.00000115. Among the genes that had Bonferroni-significant exercise-induced changes that were correlated with insulin sensitivity were transcription factors such as MYC and ATF3. These transcription factors are common to many genes, and therefore if their expression after exercise is dependent upon the level of insu-lin sensitivity, even in healthy individuals, this suggests that there could be a widespread effect of insulin sensitivity on the exercise response. Since these effects were seen merely 30 minutes after exercise, they likely are mediating differences at later time points, compelling a thorough, global time course analysis of gene expression after exercise that is beyond the scope of the present study. Another gene, SNF1LK, also had changes that were correlated with insulin sensi-tivity. This genes is involved in muscle development and differentiation. SNF1LK is a CREB de-pendent gene that phosphorylates HDAC4 and HDAC5, which promotes expression of MEF2 isoforms and their downstream genes that mediate growth and differentiation in skeletal
mus-cle [38]. Therefore, key exercise-induced processes involved in muscle gene expression, growth,
and differentiation appear to be affected by the level of insulin sensitivity in healthy individuals, with those on the lower end of the insulin action spectrum having lower responses. These find-ings reinforce and extend previous studies showing that responses to exercise are related to in-sulin sensitivity. Blunted responses at the lower end of the inin-sulin action spectrum that have
been observed include effects on whole body or leg glucose uptake [36], mitochondrial
re-sponse [37], and PGC-1αand downstream genes [6,7,37]. These findings lead to the working
hypothesis that lower insulin sensitivity leads to lower exercise-induced gene expression re-sponse and less muscle adaptation to exercise, which could in turn lead to lower insulin action.
A second reason for performing this study was to characterize the microRNA response to exercise in healthy people in an unbiased manner by using sequencing techniques. As was the case for mRNA changes, a number of miRNAs responded briskly within 30 minutes of the end of exercise. Among these, members of the miR-30, miR-128, and miR-378 families were well represented and abundant in human muscle. Next generation sequencing techniques allowed for high specificity of quantification. The known and predicted targets of these miRNAs in-clude several mRNAs that directly pertain to both exercise-induced mRNA responses and mus-cle insulin sensitivity. For example, there are multiple predicted miR-378 and miR-30 sites in the 3’UTR of the PPARA gene. Also pertinent may be that miR-378 and miR-30 have interac-tion sites in the 3’-UTR regions of both PPARGC1A and PPARGC1B. Because miR-378a is lo-cated within intron 1 of the PPARGC1B gene, these data support the idea that there may be a regulatory network consisting of PPARs, PGC-1 isoforms, and micro RNAs that participate in the exercise-induced gene expression response. It is conceivable that dysregulation of expres-sion of miRNA-378 could be a component of insulin resistance in skeletal muscle and might be
responsible for the decreased PGC-1αresponse seen after exercise in insulin resistant skeletal
muscle, possibly by a feedback mechanism [6]. Recently, miR-378 isoforms have been
implicat-ed in the control of mitochondrial function and energy balance in mice [39]. Carrer and
col-leagues used a mouse that had miR-378-3p and -5p deleted, while leaving the PPARGC1B gene
intact [39]. These mice were resistant to diet-induced obesity, possibly due to effects in liver.
exercise. Of these, only hsa-miR-10a-5p and predicted mRNA targets GIMAP8 and NRF4A3 stood out as being involved in exercise responses. GIMAP8 expression was one of the few mRNAs that decreased after exercise (along with other GIMAP isoforms), and so it may be sig-nificant that hsa-miR-10a-5p expression that increased. However, the changes in GIMAP ex-pression with respect to either exercise or skeletal muscle itself are unclear, as these genes do not have a described function in muscle. Finally, since miRNA responses were not related to in-sulin sensitivity, it can be concluded that alterations in these responses are not involved in the
phenomenon of“exercise resistance”[6]. Nevertheless, it is becoming more evident that
miRNA expression plays a role in muscle plasticity in response to aging or exercise [17,18].
Several other studies in addition to that by Catoireet al. [1] have examined gene expression
or protein abundance responses to an exercise bout, but have not addressed insulin sensitivity-related differences. Mahoney and colleagues studied mRNA changes in muscle from young, healthy subjects 3 after an hour of high intensity and found a number of transcription factors
and genes coding mitochondrial proteins to be increased [9]. Using rats that exercised for 2
hours, McKenzieet al. found mRNA for a number of transcription factors and signal
transduc-tion proteins to be increased one hour after exercise, including ATF3, agreeing with the current
results [10]. Jozsiet al. compared the response to a single bout of resistance exercise in young
and healthy older men [8]. In general, the older men had greatly reduced gene expression
responses, with the transcription factor EGR-1 showing an increase in older subjects and a decrease in the young men, while other genes involved in angiogenesis (VEGF) or c-jun, in-creased similarly. Using mice, Safdar and colleagues examined the expression of mRNAs for
se-lected genes, including PGC-1α, after a single bout of exercise [13]. As others have shown in
rodents and humans, PGC-1αmRNA increased after exercise [6,40]. A number of other
inves-tigators have examined how exercise training, as opposed to a single bout of exercise, alters gene expression or protein abundance in skeletal muscle. These studies have used designs com-paring trained and sedentary individuals, or comcom-paring the same individuals before and after
training. In general, the studies that use training [12,41] show more consistent increases in
genes coding for mitochondrial proteins or proteins involved in metabolism than were found in the current study.
In conclusion, a single bout of exercise robustly alters skeletal muscle gene expression in a manner that is related to insulin sensitivity. The response of transcription factor gene expres-sion to exercise, especially those transcription factors that have insulin sensitivity-related re-sponses provides avenues of research that may help to explain this phenomenon and its relevance. This study in humans may indicate the importance of the altered exercise response in insulin resistance, and point to MAP kinase and VEGF signaling, possibly through EGR1 and a limited number of transcription factors.
Supporting Information
S1 Fig. RNA was isolated as described in the text, and exercise-induced fold changes are shown for Q-rt-PCR results in relationship to microarray results.Data are Mean ± SEM (n = 6).
(EPS)
S1 Table. Primers used for quantitative PCR analysis.
(DOCX)
S2 Table. Probe level analysis of gene expression changes following exercise.Probes shown
were significantly altered by exercise at a Bonferroni-corrected P<0. 00000115; shown are P
transformed and are given cumulatively as mean ± STDERR, standard error. Data for each in-dividual also are shown (basal = pre exercise value; 30min = value 30 minutes after completion of exercise).
(XLSX)
S3 Table. DAVID analysis of probes that significantly changed after exercise in all subjects.
Genes were categorized into significantly enriched pathways as described in the Methods. (DOCX)
S4 Table. Enrichment of transcription factor binding sites in 5’UTRs of genes altered in ex-pression by acute exercise.Bonferroni P values refer to enrichment of transcription factors
rel-ative to random selection of 5’UTRs in genome (PScan).
P<0.05, correlation between
insulin stimulated glucose disposal and exercise-induced change in gene expression. (DOCX)
S5 Table. Predicted mRNA targets of microRNAs that were changed after exercise.Diana
Tools was used to predict targets (seeMethods). Also shown are predicted mRNA targets that
were changed significantly after exercise. (DOCX)
Acknowledgments
The expert nursing assistance of Dianne DeNardo at Arizona State University is gratefully ac-knowledged. Participation of the volunteers in this study is gratefully acac-knowledged. Dr. Law-rence J. Mandarino is the guarantor of this work, had full access to all the data, and takes full responsibility for the integrity of data and the accuracy of data analysis. The authors have no conflicts of interest.
Author Contributions
Conceived and designed the experiments: CSM PRL DKC LJM. Performed the experiments: CSM JMC DM. Analyzed the data: CSM CM JMC PRL BB DKC LJM. Contributed reagents/ materials/analysis tools: CM BB. Wrote the paper: DKC LJM.
References
1. Catoire M, Mensink M, Boekschoten MV, Hangelbroek R, Muller M, Schrauwen P, et al. Pronounced ef-fects of acute endurance exercise on gene expression in resting and exercising human skeletal muscle. PLoS One. 2012; 7(11):e51066. doi:10.1371/journal.pone.0051066PMID:23226462; PubMed Central PMCID: PMC3511348.
2. Coletta DK, Mandarino LJ. Mitochondrial dysfunction and insulin resistance from the outside in: extra-cellular matrix, the cytoskeleton, and mitochondria. Am J Physiol Endocrinol Metab. 2011; 301(5): E749–55. Epub 2011/08/25. ajpendo.00363.2011 [pii]doi:10.1152/ajpendo.00363.2011PMID: 21862724; PubMed Central PMCID: PMC3214002.
3. Goodyear LJ, Giorgino F, Balon TW, Condorelli G, Smith RJ. Effects of contractile activity on tyrosine phosphoproteins and PI 3-kinase activity in rat skeletal muscle. Am J Physiol. 1995; 268(5 Pt 1):E987– 95. Epub 1995/05/01. PMID:7762655.
4. Koval JA, Maezono K, Patti ME, Pendergrass M, DeFronzo RA, Mandarino LJ. Effects of exercise and insulin on insulin signaling proteins in human skeletal muscle. Med Sci Sports Exerc. 1999; 31(7):998– 1004. Epub 1999/07/23. PMID:10416561.
5. Christ-Roberts CY, Pratipanawatr T, Pratipanawatr W, Berria R, Belfort R, Kashyap S, et al. Exercise training increases glycogen synthase activity and GLUT4 expression but not insulin signaling in over-weight nondiabetic and type 2 diabetic subjects. Metabolism. 2004; 53(9):1233–42. Epub 2004/08/31. S0026049504001945 [pii]. PMID:15334390.
J Physiol Endocrinol Metab. 2008; 294(3):E607–14. Epub 2008/01/10. 00729.2007 [pii]doi:10.1152/ ajpendo.00729.2007PMID:18182465.
7. Hernandez-Alvarez MI, Thabit H, Burns N, Shah S, Brema I, Hatunic M, et al. Subjects with early-onset type 2 diabetes show defective activation of the skeletal muscle PGC-1{alpha}/Mitofusin-2 regulatory pathway in response to physical activity. Diabetes Care. 2010; 33(3):645–51. Epub 2009/12/25. dc09-1305 [pii]doi:10.2337/dc09-1305PMID:20032281; PubMed Central PMCID: PMC2827524. 8. Jozsi AC, Dupont-Versteegden EE, Taylor-Jones JM, Evans WJ, Trappe TA, Campbell WW, et al.
Aged human muscle demonstrates an altered gene expression profile consistent with an impaired re-sponse to exercise. Mech Ageing Dev. 2000; 120(1–3):45–56. Epub 2000/11/23. S0047-6374(00) 00178-0 [pii]. PMID:11087903.
9. Mahoney DJ, Parise G, Melov S, Safdar A, Tarnopolsky MA. Analysis of global mRNA expression in human skeletal muscle during recovery from endurance exercise. FASEB J. 2005; 19(11):1498–500. Epub 2005/06/30. 04-3149fje [pii] doi:10.1096/fj.04-3149fjePMID:15985525.
10. McKenzie MJ, Goldfarb AH. Aerobic exercise bout effects on gene transcription in the rat soleus. Med Sci Sports Exerc. 2007; 39(9):1515–21. Epub 2007/09/07. doi:10.1249/mss.
0b013e318074c25600005768-200709000-00012[pii]. PMID:17805083.
11. Roberts MD, Kerksick CM, Dalbo VJ, Hassell SE, Tucker PS, Brown R. Molecular attributes of human skeletal muscle at rest and after unaccustomed exercise: an age comparison. J Strength Cond Res. 2010; 24(5):1161–8. Epub 2010/05/05. doi: 10.1519/JSC.0b013e3181da786f00124278-201005000-00001[pii]. PMID:20440120.
12. Rowlands DS, Thomson JS, Timmons BW, Raymond F, Fuerholz A, Mansourian R, et al. Transcrip-tome and translational signaling following endurance exercise in trained skeletal muscle: impact of die-tary protein. Physiol Genomics. 2011; 43(17):1004–20. Epub 2011/07/07.
physiolgenomics.00073.2011 [pii]doi:10.1152/physiolgenomics.00073.2011PMID:21730029. 13. Safdar A, Abadi A, Akhtar M, Hettinga BP, Tarnopolsky MA. miRNA in the regulation of skeletal muscle
adaptation to acute endurance exercise in C57Bl/6J male mice. PLoS One. 2009; 4(5):e5610. Epub 2009/05/15. doi:10.1371/journal.pone.0005610PMID:19440340; PubMed Central PMCID: PMC2680038.
14. Schmutz S, Dapp C, Wittwer M, Vogt M, Hoppeler H, Fluck M. Endurance training modulates the mus-cular transcriptome response to acute exercise. Pflugers Arch. 2006; 451(5):678–87. Epub 2005/12/ 20. doi:10.1007/s00424-005-1497-0PMID:16362354.
15. Stepto NK, Coffey VG, Carey AL, Ponnampalam AP, Canny BJ, Powell D, et al. Global gene expres-sion in skeletal muscle from well-trained strength and endurance athletes. Med Sci Sports Exerc. 2009; 41(3):546–65. Epub 2009/02/11. doi:10.1249/MSS.0b013e31818c6be9PMID:19204596.
16. Davidsen PK, Gallagher IJ, Hartman JW, Tarnopolsky MA, Dela F, Helge JW, et al. High responders to resistance exercise training demonstrate differential regulation of skeletal muscle microRNA expres-sion. J Appl Physiol. 2011; 110(2):309–17. Epub 2010/10/30. japplphysiol.00901.2010 [pii] doi:10. 1152/japplphysiol.00901.2010PMID:21030674.
17. Drummond MJ, McCarthy JJ, Sinha M, Spratt HM, Volpi E, Esser KA, et al. Aging and microRNA ex-pression in human skeletal muscle: a microarray and bioinformatics analysis. Physiol Genomics. 2011; 43(10):595–603. doi:10.1152/physiolgenomics.00148.2010PMID:20876843; PubMed Central PMCID: PMC3110890.
18. Tan LJ, Liu SL, Lei SF, Papasian CJ, Deng HW. Molecular genetic studies of gene identification for sar-copenia. Human genetics. 2012; 131(1):1–31. doi:10.1007/s00439-011-1040-7PMID:21706341. 19. Lee J, Li Z, Brower-Sinning R, John B. Regulatory circuit of human microRNA biogenesis. PLoS
Com-put Biol. 2007; 3(4):e67. Epub 2007/04/24. doi:10.1371/journal.pcbi.0030067PMID:17447837; PubMed Central PMCID: PMC1853126.
20. Cusi K, Maezono K, Osman A, Pendergrass M, Patti ME, Pratipanawatr T, et al. Insulin resistance dif-ferentially affects the PI 3-kinase- and MAP kinase-mediated signaling in human muscle. J Clin Invest. 2000; 105(3):311–20. PMID:10675357
21. Richardson DK, Kashyap S, Bajaj M, Cusi K, Mandarino SJ, Finlayson J, et al. Lipid infusion decreases the expression of nuclear encoded mitochondrial genes and increases the expression of extracellular matrix genes in human skeletal muscle. J Biol Chem. 2005; 280(11):10290–7. Epub 2004/12/16. M408985200 [pii]doi:10.1074/jbc.M408985200PMID:15598661.
22. Tangen SE, Tsinajinnie D, Nunez M, Shaibi GQ, Mandarino LJ, Coletta DK. Whole blood gene expres-sion profiles in insulin resistant Latinos with the metabolic syndrome. PloS one. 2013; 8(12):e84002. doi:10.1371/journal.pone.0084002PMID:24358323; PubMed Central PMCID: PMC3866261. 23. Zambelli F, Pesole G, Pavesi G. Pscan: finding over-represented transcription factor binding site motifs
issue):W247–52. Epub 2009/06/03. gkp464 [pii] doi:10.1093/nar/gkp464PMID:19487240; PubMed Central PMCID: PMC2703934.
24. Bryne JC, Valen E, Tang MH, Marstrand T, Winther O, da Piedade I, et al. JASPAR, the open access database of transcription factor-binding profiles: new content and tools in the 2008 update. Nucleic Acids Res. 2008; 36(Database issue):D102–6. Epub 2007/11/17. gkm955 [pii]doi:10.1093/nar/ gkm955PMID:18006571; PubMed Central PMCID: PMC2238834.
25. Matys V, Kel-Margoulis OV, Fricke E, Liebich I, Land S, Barre-Dirrie A, et al. TRANSFAC and its mod-ule TRANSCompel: transcriptional gene regulation in eukaryotes. Nucleic acids research. 2006; 34(Da-tabase issue):D108–10. Epub 2005/12/31. doi:10.1093/nar/gkj143PMID:16381825; PubMed Central PMCID: PMC1347505.
26. Paraskevopoulou MD, Georgakilas G, Kostoulas N, Vlachos IS, Vergoulis T, Reczko M, et al. DIANA-microT web server v5.0: service integration into miRNA functional analysis workflows. Nucleic Acids Res. 2013; 41(Web Server issue):W169–73. doi:10.1093/nar/gkt393PMID:23680784; PubMed Cen-tral PMCID: PMC3692048.
27. Reczko M, Maragkakis M, Alexiou P, Grosse I, Hatzigeorgiou AG. Functional microRNA targets in pro-tein coding sequences. Bioinformatics. 2012; 28(6):771–6. doi:10.1093/bioinformatics/bts043PMID: 22285563.
28. Wingender E. The TRANSFAC project as an example of framework technology that supports the analy-sis of genomic regulation. Brief Bioinform. 2008; 9(4):326–32. Epub 2008/04/26. bbn016 [pii]doi:10. 1093/bib/bbn016PMID:18436575.
29. Bartel DP, Chen CZ. Micromanagers of gene expression: the potentially widespread influence of meta-zoan microRNAs. Nat Rev Genet. 2004; 5(5):396–400. Epub 2004/05/15. doi:10.1038/nrg1328 nrg1328[pii]. PMID:15143321.
30. Patti ME, Butte AJ, Crunkhorn S, Cusi K, Berria R, Kashyap S, et al. Coordinated reduction of genes of oxidative metabolism in humans with insulin resistance and diabetes: Potential role of PGC1 and NRF1. Proc Natl Acad Sci U S A. 2003; 100(14):8466–71. Epub 2003/07/02. doi:10.1073/pnas. 10329131001032913100[pii]. PMID:12832613; PubMed Central PMCID: PMC166252.
31. Pagel JI, Deindl E. Early growth response 1—a transcription factor in the crossfire of signal transduction cascades. Indian journal of biochemistry & biophysics. 2011; 48(4):226–35. PMID:22053691. 32. Pagel JI, Deindl E. Disease progression mediated by egr-1 associated signaling in response to
oxida-tive stress. International journal of molecular sciences. 2012; 13(10):13104–17. doi:10.3390/ ijms131013104PMID:23202940; PubMed Central PMCID: PMC3497314.
33. Irrcher I, Hood DA. Regulation of Egr-1, SRF, and Sp1 mRNA expression in contracting skeletal muscle cells. Journal of applied physiology. 2004; 97(6):2207–13. doi:10.1152/japplphysiol.00388.2004 PMID:15310743.
34. Lim RW, Zhu CY, Stringer B. Differential regulation of primary response gene expression in skeletal muscle cells through multiple signal transduction pathways. Biochim Biophys Acta. 1995; 1266(1):91– 100. PMID:7718627.
35. Liu L, Tsai JC, Aird WC. Egr-1 gene is induced by the systemic administration of the vascular endotheli-al growth factor and the epidermendotheli-al growth factor. Blood. 2000; 96(5):1772–81. PMID:10961876. 36. Dela F, Stallknecht B. Effect of physical training on insulin secretion and action in skeletal muscle and
adipose tissue of first-degree relatives of type 2 diabetic patients. Am J Physiol Endocrinol Metab. 2010; 299(1):E80–91. Epub 2010/04/22. ajpendo.00765.2009 [pii]doi:10.1152/ajpendo.00765.2009 PMID:20407006.
37. Nilsson MI, Greene NP, Dobson JP, Wiggs MP, Gasier HG, Macias BR, et al. Insulin resistance syn-drome blunts the mitochondrial anabolic response following resistance exercise. Am J Physiol Endocri-nol Metab. 2010; 299(3):E466–74. Epub 2010/07/08. ajpendo.00118.2010 [pii] doi:10.1152/ajpendo. 00118.2010PMID:20606077.
38. Berdeaux R, Goebel N, Banaszynski L, Takemori H, Wandless T, Shelton GD, et al. SIK1 is a class II HDAC kinase that promotes survival of skeletal myocytes. Nat Med. 2007; 13(5):597–603. doi:10. 1038/nm1573PMID:17468767.
39. Carrer M, Liu N, Grueter CE, Williams AH, Frisard MI, Hulver MW, et al. Control of mitochondrial metab-olism and systemic energy homeostasis by microRNAs 378 and 378. Proceedings of the National Academy of Sciences of the United States of America. 2012; 109(38):15330–5. Epub 2012/09/06. doi: 10.1073/pnas.1207605109PMID:22949648; PubMed Central PMCID: PMC3458360.