Reduction of Carbon Dioxide in Filtering
Facepiece Respirators with an Active-Venting
System: A Computational Study
Erik Birgersson1*, Ee Ho Tang2, Wei Liang Jerome Lee2, Kwok Jiang Sak2
1Department of Chemical and Biomolecular Engineering, National University of Singapore, Singapore,
2ST Dynamics, 249 Jalan Boon Lay, Singapore
Abstract
During expiration, the carbon dioxide (CO2) levels inside the dead space of a filtering
face-piece respirator (FFR) increase significantly above the ambient concentration. To reduce the CO2concentration inside the dead space, we attach an active lightweight venting system
(AVS) comprising a one-way valve, a blower and a battery in a housing to a FFR. The achieved reduction is quantified with a computational-fluid-dynamics model that considers conservation of mass, momentum and the dilute species, CO2, inside the FFR with and
with-out the AVS. The results suggest that the AVS can reduce the CO2levels inside the dead
space at the end of expiration to around 0.4% as compared to a standard FFR, for which the CO2levels during expiration reach the same concentration as that of the expired alveolar air
at around 5%. In particular, during inspiration, the average CO2volume fraction drops to
near-to ambient levels of around 0.08% with the AVS. Overall, the time-averaged CO2volume
fractions inside the dead space for the standard FFR and the one with AVS are around 3% and 0.3% respectively. Further, the ability of the AVS to vent the dead-space air in the form of a jet into the ambient–similar to the jets arising from natural expiration without a FFR–
ensures that the expired air is removed and diluted more efficiently than a standard FFR.
Introduction
The form and function of the human respiratory system ensures an efficient gas exchange with the environment. During expiration, hot, humid air that is rich in carbon dioxide (CO2) and depleted in oxygen is vented away from the body in the form of one jet from the mouth or two jets from the nostrils that entrains air from the surrounding; during inspiration, air from the immediate surroundings of the face is inhaled in a diffuse manner from all directions in front of the mouth/nostrils. This combination of directed expiration and diffuse inspiration ensures that rebreathing is kept to a minimum, because we inhale air close to our faces and exhale far away and in a manner that dilutes the expired air. Respiration thus also significantly changes the airflow pattern around us. Now, when we put on a facepiece respirator (FFR) covering our mouth and nostrils, we alter the air exchange by not only extending the physiological dead OPEN ACCESS
Citation:Birgersson E, Tang EH, Lee WLJ, Sak KJ (2015) Reduction of Carbon Dioxide in Filtering Facepiece Respirators with an Active-Venting System: A Computational Study. PLoS ONE 10(6): e0130306. doi:10.1371/journal.pone.0130306
Editor:Gongnan Xie, Northwestern Polytechnical University, CHINA
Received:September 26, 2014
Accepted:May 19, 2015
Published:June 26, 2015
Copyright:© 2015 Birgersson et al. This is an open access article distributed under the terms of the
Creative Commons Attribution License, which permits unrestricted use, distribution, and reproduction in any medium, provided the original author and source are credited.
Data Availability Statement:All relevant data are within the paper.
Funding:The financial support of ST Dynamics and National University of Singapore is gratefully acknowledged. ST Dynamics provided support in the form of salaries for authors EHT, WLJL, KJS, but did not have any additional role in the study design, data collection and analysis, decision to publish, or preparation of the manuscript.
space of the respiratory system by the dead-space volume of the FFR itself, but also by altering the airflow pattern during respiration.
In this context, it is therefore perhaps not surprising that FFRs are known to adversely affect the comfort of the wearer in terms of, for example, lowered thermal comfort [1–3] and elevated
CO2levels [4,5]. The decreased thermal comfort is mainly due to increased humidity and tem-perature inside the dead space of the FFR from respiration and thermal regulation, which together give rise to a significantly higher apparent temperature than the ambient under nor-mal conditions; apparent temperatures around 53°C have been measured by Roberge et al. [3] for ambient conditions of 22°C and 24% relative humidity. The elevated CO2levels originate from the CO2-rich expired air that is around one-hundred times higher in CO2concentration than that of atmospheric air; CO2volume fractions of around 3.0 ± 0.5% [6] have been mea-sured for subjects carrying out low-intensity exercise inside the dead space of a FFR. Especially the significantly increased CO2concentration is potentially hazardous: increased CO2levels have been linked to changes in visual performance, altered exercise endurance, headaches, shortness of breath, decreased reasoning and alertness as well as increased irritability [7].
In order to reduce the CO2levels in the dead space to near-ambient levels, we introduce an active venting system (AVS) that aims to mimic and thus restore the functionality of the human respiratory system even when a FFR is covering our mouth and nostrils. In short, the lightweight AVS comprises a housing for a one-way valve, a blower and battery that can be attached to the FFR with negligible mechanical deformation of the filter. The blower illustrated inFig 1vents the air out from the FFR and should thus reduce the CO2concentration inside the dead space.
We quantify the reduction by solving a computational-fluid-dynamics (CFD) model for conservation of mass, momentum and the dilute species CO2together with constitutive rela-tions for the respiratory cycle, filter and blower in the dead space between the face and the FFR as well as the filter and blower. The surrounding of the FFR and the likelihood of rebreathing CO2is then discussed in terms of simple scaling arguments. Here, the key advantage of solving a standard CFD model for passive transport is the high spatial and temporal resolution that can be achieved, whereas corresponding experimental measurements are usually carried out for average quantities [3,7]. As a point of reference, we validate our simulations with existing experimental measurements for a standard FFR.
Mathematical Formulation
We consider a three-dimensional representation of the dead space and filter of a FFR as well as the blower for the AVS-equipped FFR as depicted in Fig1cand1dbased on a computer-aided design of the human head [8] and additions carried out in Solidworks. Here, we have assumed that the face and mask are symmetric, whence we only need to consider half of the domain in Fig1aand1b.
The physical phenomena associated with respiration and passive transport of CO2are cap-tured via the equations of change for turbulent and laminar momentum in the dead space and filter respectively and for mass and the species CO2, boundary conditions and constitutive rela-tions for the breathing cycle, expired carbon dioxide, filter and blower. These are based on the following main underlying assumptions and characteristics:
1. CO2is dilute since its volume fraction ranges from around 0.04% in the ambient to around 5% in the alveolar air.
2. The ambient is well ventilated, such that any CO2vented out from the FFR is removed and not rebreathed—we shall later discuss this condition in detail.
3. The flow is isothermal, because the temperature variations,ΔT*15 K, arising from respi-ration are less than the total ambient temperature,Tamb*300 K; i.e.ΔT<<Tamb
4. The pressure variations in the dead space of the FFR and across the filter are small com-pared to the ambient pressure, because the pressure drop,Δp, across the filter for the air flow is*30 Pa for the conditions considered here; i.e.,Δp<<pamb*105Pa.
5. The flow is incompressible and the air behaves as an ideal gas.
6. In view of the above, the volume fraction is equal to the molar fraction.
7. The flow pattern can be captured with the standardk-εturbulent model in the dead space
and with the Brinkman equation in the filter.
8. Quiet breathing through the nostrils for a young adult man as summarized by Guyton et al. [9].
9. The transition of expired CO2from the anatomic dead space to the alveolar air can be described with linear functions.
10. The physiological dead space is equivalent to the anatomic dead space in the respiratory system.
Fig 1. Illustration of FFRs and the computational domains.(a) a standard FFR, (b) a FFR equipped with the blower of the AVS and (c-d) the computational domains comprising the dead space of the FFR, the filter and the blower; for the simulation of the standard FFR, the blower region was treated as a filter.
11. The respiratory cycle follows that described by Lee et al. [10].
12. The blower of the AVS is represented by a boundary condition.
13. The one-way valve that is part of the AVS is not resolved explicitly to reduce the degree of complexity; instead, the impact of the one-way valve on the fan characteristic curve is assumed accounted for by increasing the driving voltage of the blower, thus compensating for the increased pressure drop in the system.
While several of these assumptions could easily be relaxed or removed, they allow for the derivation of a relatively simple mathematical model that captures all the leading-order phe-nomena associated with the salient features of breathing in a FFR with and without AVS.
Governing equations
In the dead space of the FFR, we solve for incompressible, turbulent flow described by the stan-dardk-εmodel [15]:
r u¼0;
r@
u
@tþrðu rÞu¼ r pIþ ðmþmtÞðruþ ðruÞ T
Þ 2
3rk I
;
r@k
@tþrðu rÞk¼ r mþ
mt
sk
rk
þPk rε;
r@ε
@tþrðu rÞε¼ r mþ
mt
sε
rε
þCε1
ε
kPk Cε2r
ε2
k;
ð1Þ
Where
mt¼rCmk
2
ε;
Pk¼mt½ru:ðruþ ðruÞ T
Þ:
ð2Þ
Here,ρis the density of the air (kg m−3),uis the air velocity (m s−1),tis the time (s),pis the
pressure (Pa),μandμtare the dynamic and turbulent viscosities (Pa s),kis the turbulent
kinetic energy (m2s−2),
εis the turbulent dissipation (m2s−3) andσ
k,σε,Cμ,Cε1andCε2are
adjustable parameters (1).
In the filter, we solve for laminar flow in a porous medium, given by [16]
r u¼0;
r
g
@u
@t ¼ r pIþ
m
gðr
uþ ðruÞTÞ
m
k
u; ð3Þ
whereκis the permeability (m2) andγis the porosity (1). In the plainfluid, described by thek -εmodel, the dependent variables and parameters are Reynold's averaged quantities, whereas
the corresponding counterparts in the porous medium are volume-averaged quantities. Throughout the dead space and the filter, we solve for transport of dilute CO2:
@φ
@tþ r ðuφÞ ¼D
effr2
φ; ð4Þ
defined as
Deff ¼ DCO2þDt in the dead space and blower; g32D
CO2 in the filter:
ð5Þ
(
The turbulent diffusivity,Dt, is described by
Dt¼
mt
rSct; ð6Þ
where Sctis the turbulent Schmidt number (1). The effective diffusion coefficient in thefilter has been described with a standard Bruggeman relation withDCO2denoting the molecular
dif-fusion (m2s−1) of CO2in air.
Boundary and initial conditions
At the nostril inlet, we prescribe the airflow velocity, turbulent intensity and length scale:
un¼ V_
resp=Anose; It¼Inose;lt¼lnose; ð7Þ
and either fully developedflow during inspiration
rφn¼0; ð8Þ
or the volume fraction during expiration of CO2as
φ¼φexp: ð9Þ
Here,nis the unit normal pointing out of the domain,V_
respis the airflow from the respira-tion (m3s−1),I
tandltare the turbulent intensity and length scales respectively,Anoseis the cross-sectional area of the nostrils, andϕexpis the volume fraction of CO2(1) from the
respiration.
At the walls, we prescribe standard wall functions and zero flux of CO2, and at the exterior of the filter, we specify the gauge pressure
p¼0; ð10Þ
and either fully developedflow during expiration
rφn¼0; ð11Þ
or the volume fraction during inspiration of CO2as
φ¼φamb; ð12Þ
whereϕambis the volume fraction of CO2of the ambient.
For the FFR equipped with the AVS, we prescribe the following boundary condition for the blower:
p¼ pfan: ð13Þ
The initial conditions fort= 0 are set as follows:
u¼0;p¼0;φ¼φ
0: ð14Þ
The initial volume fraction of CO2,ϕ0, was found from the steady periodic behavior of the solution, as we shall see later. The initial values of the turbulent kinetic energy and dissipation were computed by the software COMSOL 4.4 (seeNumericsfor more details).
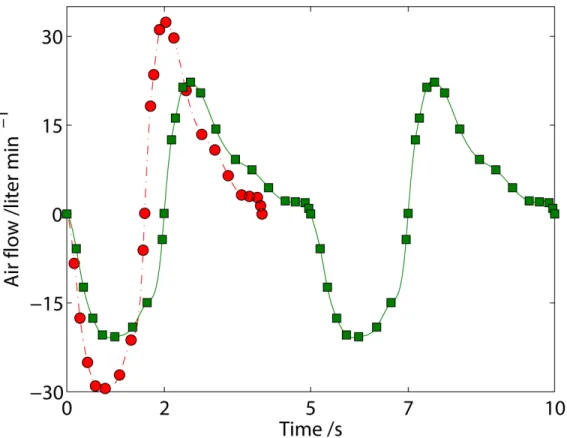
Respiration
In order to capture the air flow,V_resp, from the nostrils as a function of time, we start with the experiments for quiet breathing by Lee et al. [10], who measured the inspiration (1.6 s dura-tion) and expiration (2.4 s duradura-tion) for a breathing frequency of 15 breaths min−1and a tidal
volume of 0.58 liter as shown inFig 2.
For our respiratory cycle with a breathing frequency of 12 breaths min−1and a tidal volume
of 0.5 liter, we therefore multiply the time series for the measured air flow with the factor 15/12 to obtain the total period for respiration,tresp, of 5 s with 2 s and 3 s for inspiration and expira-tion respectively. We further multiply the magnitude of the air flow during inspiraexpira-tion and expiration with one constant each to reduce the tidal volume to 0.5 liter, which results in the breathing pattern depicted for 10 s inFig 2. Finally, the volume flow of air at any time is deter-mined via interpolation with cubic splines between the data points.
Filter
For the filter, we determine the permeability numerically such that the filter resistance is 10 mmAq for airflow of 85 liter min−1and a surface area of 100 cm2.
Blower
The fan characteristic curve for the centrifugal blower of the AVS is fitted to measurements by the manufacturer Risun Corp. [11], which results in the following functional form for the static fan pressure,pfan(Pa), and the volume flow through the blower,V_fan(m
3s−1):
pfan ¼ ð 1:6216e5V_fanþ67:1Þ½ð 1:6216e5V_fanþ67:1Þ>0: ð15Þ
(Note that we have not included the units of the constants for the sake of brevity.) The vol-ume flow through the fan is determined by integrating the air flow over the blower:
_
Vfan ¼2
ð ð
Afan=2
undA: ð16Þ
The factor 2 is included since we only consider half of the geometry and blower; see Fig1c
and1d.
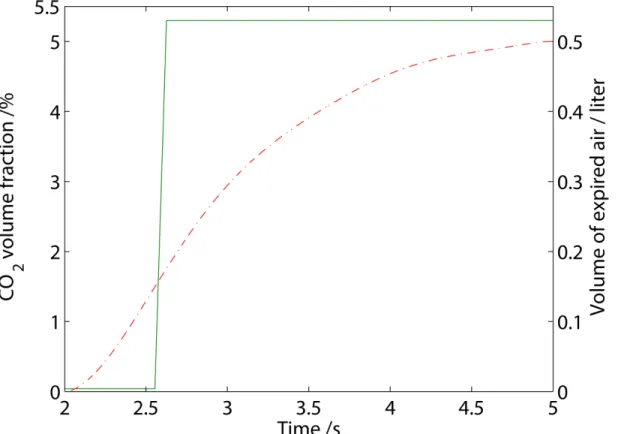
Carbon dioxide
In the ambient, we assume a volume fraction of 0.04% of CO2and well-ventilated conditions such that any expired CO2is removed once it is vented out of the FFR. For the CO2originating from expiration, we derive a function that is illustrated inFig 3.
air, and finally alveolar air rich with CO2, which can be written as
φexp¼φambðMðtÞ<tpdÞ þ ððφalv φambÞ=tmixðMðtÞ tpdÞ þφambÞðMtpdÞ½MðtÞ<ðtmixþtpdÞþ
φalvðMðtÞ ðtmixþtpdÞÞ;
ð17Þ
whereM(t)is the modulus, defined as
MðtÞ ¼Modðt;trespÞ: ð18Þ
The parameters,tpdandtmix, were fitted to ensure that
ðMðtrespÞ
MðtinsÞ _
Vexpφexpdt¼VCO2; ð19Þ
and
ðMðtpdÞ
MðtinsÞ _
Vexpdt¼Vads; ð20Þ
here,VCO2is the volume of CO2from one expiration,Vadsis the volume of the anatomic dead
space of the respiratory system andV_expis the airflow during expiration, i.e. the airflow with a
positive magnitude inFig 2. The end-tidal CO2in our derived expression is similar to that mea-sured by Zhao et al. [12].
Fig 2. Airflow for quiet breathing of a young man.(●) experiments(6)for a tidal volume of 0.58 liter at a breathing frequency of 15 breaths min−1and (
−) cubic spline interpolation thereof; (■) breathing pattern adjusted for a tidal volume of 0.5 liter at a breathing frequency of 12 breaths min−1and (
−) cubic spline interpolation thereof. (N.B.: The breathing pattern can easily be extended beyond the ten seconds shown here.)
Numerics
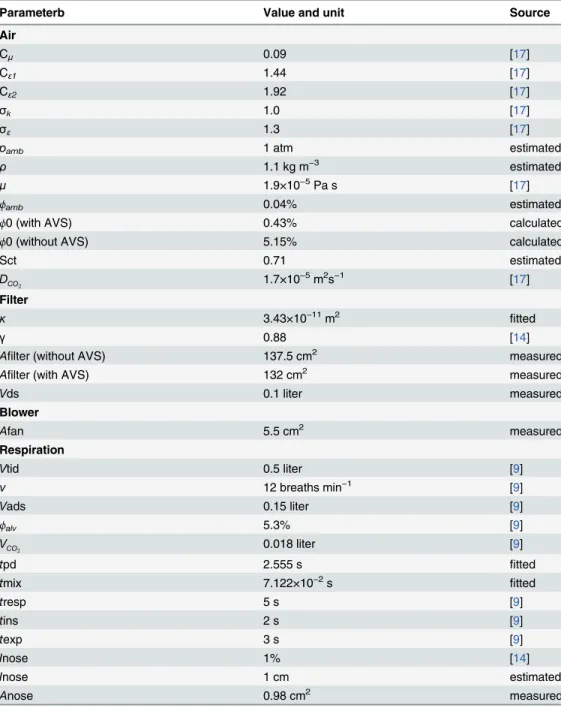
The CFD model for passive transport of CO2inside a FFR was implemented in the commercial finite-element software Comsol Multiphysics 4.4. Around 106elements, amounting to*106
degrees of freedom for the geometries with and without AVS were employed to ensure mesh-independent solutions for the dependent variablesu,p,k,εandϕ. The parameters are
summa-rized inTable 1. In particular, we note that the volume of the dead space,Vds, for the FFR is 0.1 liter and that the cross-sectional area of the nostrils is 0.98 cm2, which is close to the measured average of around 1 cm2by Gupta et al. [13]. Further, we note that the fitted permeability is of the same order of magnitude as that employed by Lei et al. [14].
Results and Discussion
As alluded to in theIntroduction, we expect the CO2concentration for respiration in a stan-dard FFR to increase significantly above that of the ambient—this is indeed the case as can be
inferred fromFig 4.
In particular, the volume-averaged CO2volume fraction, defined as
φðtÞ 2
Vds
ð ð ð
Vds=2
φðtÞdV; ð21Þ
has risen to around 5.2% at the end of expiration in the dead space of the standard FFR; let's call this volume fractionφend. During inspiration, the entire dead-space volume,Vds, with its high CO2concentration is inspired after which the dead spacefills up with ambient air around half-way through the inspiration. In other words, one can quickly estimate the volume fraction
Fig 3. The derived function for (−) the CO2volume fraction during expiration as well as (−) the total volume of expired air as a function of time.
of CO2that is inspired from
φins ¼φendVdsþφambðVtid VdsÞ
Vtid
φendVds
Vtid
1%: ð22Þ
Here, we have removed the contribution from the ambient, because it is roughly one-hun-dred times lower than the CO2volume fraction in the dead space at the end of expiration. In contrast and as a reference, inspiration without a FFR would lead toϕins=ϕamb= 0.04%; i.e. the mask adds 1% to the inspired CO2content. From these estimates, it is also clear that the
Table 1. Summary of parameters.
Parameterb Value and unit Source
Air
Cμ 0.09 [17]
Cε1 1.44 [17]
Cε2 1.92 [17]
σk 1.0 [17]
σε 1.3 [17]
pamb 1 atm estimated
ρ 1.1 kg m−3 estimated
μ 1.9×10⁻⁵Pa s [17]
ϕamb 0.04% estimated
ϕ0 (with AVS) 0.43% calculated
ϕ0 (without AVS) 5.15% calculated
Sct 0.71 estimated
DCO2 1.7×10
−5m2s−1 [17]
Filter
κ 3.43×10⁻¹¹m2 fitted
γ 0.88 [14]
Afilter (without AVS) 137.5 cm2 measured
Afilter (with AVS) 132 cm2 measured
Vds 0.1 liter measured
Blower
Afan 5.5 cm2 measured
Respiration
Vtid 0.5 liter [9]
ν 12 breaths min−1 [9]
Vads 0.15 liter [9]
ϕalv 5.3% [9]
VCO
2 0.018 liter [9]
tpd 2.555 s fitted
tmix 7.122×10⁻²s fitted
tresp 5 s [9]
tins 2 s [9]
texp 3 s [9]
Inose 1% [14]
Inose 1 cm estimated
Anose 0.98 cm2 measured
internal volume of a standard FFR should be as small as possible to reduce inspiration of trapped CO2in its dead space.
If we proceed by taking the time average of the volume-averaged volume fraction, defined as
1
tresp
ðtresp
0
φðtÞdt; ð23Þ
wefind a time- and volume-averaged CO2volume fraction of 3%, which is within the bounds of experimental measurements by Roberge et al. [6] and Sinkule et al. [7] for low-intensity physical activity with a FFR.
Turning our attention to the local flow pattern and CO2levels inside the mask inFig 5, we find that during inspiration that lasts for 2 seconds, air from the ambient is sucked in more or less uniformly from all around the mask. At 1 s, i.e. half-way through the inspiration, the alveolar air has been almost completely replaced with ambient air. The flow pattern then changes signifi-cantly for the subsequent expiration that lasts 3 seconds: the expired jet from the nostril
impinges on the filter and is then vented out all around the filter, which results in a steadily increasing CO2concentration. The dead space is filled with alveolar CO2at around 4 seconds. Clearly, the reason for the high levels of CO2in a standard mask is because the jet—which is
sup-posed to vent the air away from us—is stopped and the expired air vented in a diffusive manner.
Once we add the AVS with a view to restore the functionality of respiration, we reduce the CO2level significantly as expected inFig 4: the CO2levels do no increase monotonically during expiration, as was the case for the standard FFR, but rather peak around 2% and then drop towards 0.4% at the end of expiration. The AVS has thus managed to reduce the amount of
Fig 4. Volume-averaged volume fraction (%) of CO2in the dead space of a FPR without (- -) and with (−) an AVS for well-ventilated ambient
conditions.
Fig 5. Streamlines of the airflow during inspiration at 0.3, 0.5 and 1 s and during expiration at 2.5, 3 and 4 s for a standard FFR.The volume fraction of CO2is shown in color with a range of 0.04% (blue) to 5.3% (red).
CO2that remains in the dead space by around ten times; the time- and volume-averaged CO2 fraction has dropped from around 3% for the standard mask to 0.3% for the mask with the AVS. This reduction is significantly higher than the measured reduction of CO2by around 1% for an exhalation valve by Sinkule et al. [7] (albeit measured at a slightly higher frequency of breathing at 12.9 breaths min-1and a tidal volume of 0.92 liter). Somewhat unexpected though, is that the CO2concentration inside the mask increases to around 2% during expiration even with the AVS installed. In order to find the answer, let us observe the local flow pattern and CO2concentration inside the dead space inFig 6in more detail.
During expiration, we see that the jet circulates at around 2.5 to 3 seconds inside the mask, before being sucked out by the blower. There is thus an initial increase in CO2concentration for the peak airflow occurring at around 3 seconds, which corresponds to the expiratory peak inFig 2, after which the expired jet is sucked out directly by the blower around 4 seconds. The main reason for the observed circulation is the placement of the blower, which does not allow the entire impinging jet to be vented immediately—this could be remedied by introducing an
air guide for the expired jet. Now, having said that, the blower still manages to reduce the CO2 concentration at the end of expiration inside the dead space by around ten times, resulting in an inspired CO2that is correspondingly ten times less than that of a standard FFR. Returning toEq 22, we find the corresponding inspired CO2volume fraction to be 0.08% with the AVS, which is close to ambient levels.
We have so far assumed that the expired air is completely removed and replaced with fresh, ambient air during inspiration in our mathematical model. For conditions where this assump-tion is no longer valid, such as stagnant air, we need to carefully reassess our findings. For this purpose, let us again consider the physiology of breathing: During expiration, a human vents the air in the form of jets either from the nostrils or from the mouth with a speed of*1 m s−1.
This ensures that the expired air—with a relative humidity close to 100%, an average CO2level
of around 3–4% depending on the physical activity, and a temperature of around 36°C—is
transported sufficiently far away that the next inspiration takes mainly fresh air from the ambi-ent; during inspiration, the air flows from the entire surrounding into either the nostrils or the mouth at a lower local velocity than the jets during expiration. When a standard FFR is worn, those jets are damped out inside the dead space as we saw earlier and expired more or less evenly through the filter with a velocity that is around 100-times smaller (depending on the filter resistance and area) than that of the aforementioned jets as depicted inFig 7a, in which
junj 10 2m s−1for the airflow through thefilter. At these speeds, the expired air will not
travel far away from the mask's exterior.
It is therefore reasonable to assume that during the subsequent inspiration, some of the expired air is likely to be inhaled again. We can estimate the speed of the expired air out from the filtera priorito calculations by considering conservation of total mass:
rV_resprjunjAfilter; ð24Þ
in which the left-hand side represent the massflowing in from the nostrils and the right-hand side represents the massflowing out through thefilter of a standard FFR. Rearranging yields
junj _
Vresp
Afilter
20liter min
1
100cm2 10
2
m s 1: ð
25Þ
Fig 6. Streamlines of the airflow during inspiration at 0.3, 0.5 and 1 s and during expiration at 2.5, 3 and 4 s for the FFR equipped with the AVS.The volume fraction of CO2is shown in color with a range of 0.04% (blue) to 5.3% (red).
nj 1m s−1into the surrounding, as can be seen from the significantly higher air speed in the
blower inFig 7b. The AVS should thus significantly reduce the likelihood of rebreathing com-pared to a standard FFR.
Conclusions
We have carried out CFD simulations for quiet breathing through a standard FFR and one equipped with an AVS. In short, the model comprises the equations of change for momentum, mass and CO2for turbulent flow inside the dead space of a FFR and blower and laminar flow inside the filter together with the necessary constitutive relations as well as initial and boundary conditions. The model allows for the visualization of the airflow during respiration coupled with quantification of the CO2levels in space and time with a high resolution, as opposed to time- and volume-averages in experiments.
In agreement with experimental observations, the standard FFR gives rise to a time- and volume-averaged CO2volume fraction of around 3%. For the FFR with the AVS, the CFD sim-ulations suggest that the AVS is able to lower the time- and volume-averaged CO2volume frac-tion to 0.3%, which is a near-to ten-fold reducfrac-tion; and that the AVS reduces the average inspired CO2to 0.08%, which is close to the ambient level. While this reduction has yet to be validated with experiments, the base case with a standard FFR for passive transport of CO2 agrees well with experiments; this, together with the fact that the treatment of blowers and pas-sive species transport is well established and standard in CFD, lends credibility to the findings.
In addition, and as expected, the blower of the AVS—which seeks to mimic nature by
suck-ing the air out and away from the FFR—should reduce the likelihood of rebreathing CO2as
compared to the standard FFR.
Finally, we note that the model can be modified to account for various breathing patterns, ambient conditions and different types of FFRs and blowers.
Fig 7. The normal velocity (m s−1) during expiration at 3 seconds for (a) a standard FFR and (b) a FFR equipped with the AVS.The average speed out of the filter into the ambient of the standard FFR is*10−2m
s−1; the speed of the expired air through the blower for the AVS is
*1 m s−1.
Author Contributions
Conceived and designed the experiments: EB EHT. Performed the experiments: EB EHT WLJL KJS. Analyzed the data: EB EHT WLJL KJS. Contributed reagents/materials/analysis tools: EB EHT WLJL KJS. Wrote the paper: EB EHT.
References
1. Roberge RJ, Kim JH, Benson S. N95 Filtering Facepiece Respirator Deadspace Temperature and Humidity. Journal of Occupational and Environmental Hygiene 2012; 9: 166–171. doi:10.1080/
15459624.2012.660428PMID:22413894
2. Roberge RJ, Kim JH, Coca A. Protective Facemask Impact on Human Thermoregulation: An Overview. Ann. Occup. Hyg. 2012; 56:102–112. doi:10.1093/annhyg/mer069PMID:21917820
3. Roberge RJ, Benson S, Kim JH. Thermal Burden of N95 Filtering Facepiece Respirators. Ann. Occup. Hyg. 2012; 56:808–814. doi:10.1093/annhyg/mes001PMID:22294505
4. Williams WJ. Physiological response to alterations in [O2] and [CO2]: relevance to respiratory protec-tive devices. J Int Soc Respir Prot 2010; 27: 27–51
5. Smith CL, Whitelaw JL, Davies B. Carbon dioxide rebreathing in respiratory protective devices: influ-ence of speech and work rate in full-face masks. Ergonomics 2013; 56: 781–790. doi:10.1080/
00140139.2013.777128PMID:23514282
6. Roberge RJ, Coca A, Williams WJ, Powell JB, Palmiero AJ. Physiological impact of the n95 filtering facepiece respirator on healthcare workers. Respir care 2010; 55: 569–577. PMID:20420727
7. Sinkule E, Powell J, Goss F. Evaluation of n95 respirator use with a surgical mask cover: Effects on breathing resistance and inhaled carbon dioxide. Ann Occup Hyg 2013; 57: 384–398. doi:10.1093/
annhyg/mes068PMID:23108786
8. 3D Human Anatomy for Animation, Illustration, CAD and Software Development. Available:www. zygote.com.
9. Guyton AC: Textbook of medical physiology, 11th ed. Philadelphia: Elsevier Inc.; 2004.
10. Lee JH, Na Y, Kim SK, Chung SK. Unsteady flow characteristics through a human nasal airway. Respir Physiol Neurobiol 2010; 172: 136–146. doi:10.1016/j.resp.2010.05.010PMID:20471501
11. RFB3004 from Risun Expanse Corp. Available:http://www.risunmicrotec.com.
12. Zhao D, Miller D, Xian X, Tsow F, Forzani ES. A novel real-time carbon dioxide analyzer for health and environmental applications. Sens Actuators B Chem 2014; 195: 171–176. PMID:24659857
13. Gupta JK, Lin C, Chen Q. Characterizing exhaled airflow from breathing and talking. Indoor air 2010; 20: 31–39. doi:10.1111/j.1600-0668.2009.00623.xPMID:20028433
14. Lei Z, Yang J, Zhuang Z, Roberge R. Simulation and evaluation of respirator faceseal leaks using computational fluid dynamics and infrared imaging. Ann Occup Hyg 2013; 57: 493–506. doi:10.1093/
annhyg/mes085PMID:23243192
15. Versteeg H, Malalasekera W: An Introduction to Computational Fluid Dynamics. Edinburgh Gate: Addison Wesley Longman Limited; 1998.
16. Nield DA, Bejan A. Convection in porous media. 2nd ed. New York: Springer-Verlag; 1992.