Automatic 3D Extraction of Buildings, Vegetation and Roads from LIDAR Data
A. Bellakaout1, M. Cherkaoui1, M. Ettarid1 , A. Touzani2 1
Hassan II Institute of Agronomy and Veterinary Medicine, Morocco ([email protected], [email protected]; [email protected]),
2
Regional African Centre of Space Sciences and Technologies in French Language, Morocco ([email protected])
Commission III, WG III/2
KEY WORDS: Lidar, automatic extraction, 3D modelling of building
ABSTRACT:
Aerial topographic surveys using Light Detection and Ranging (LiDAR) technology collect dense and accurate information from the surface or terrain; it is becoming one of the important tools in the geosciences for studying objects and earth surface. Classification of Lidar data for extracting ground, vegetation, and buildings is a very important step needed in numerous applications such as 3D city modelling, extraction of different derived data for geographical information systems (GIS), mapping, navigation, etc...
Regardless of what the scan data will be used for, an automatic process is greatly required to handle the large amount of data collected because the manual process is time consuming and very expensive.
This paper is presenting an approach for automatic classification of aerial Lidar data into five groups of items: buildings, trees, roads, linear object and soil using single return Lidar and processing the point cloud without generating DEM.
Topological relationship and height variation analysis is adopted to segment, preliminary, the entire point cloud preliminarily into upper and lower contours, uniform and non-uniform surface, non-uniform surfaces, linear objects, and others.
This primary classification is used on the one hand to know the upper and lower part of each building in an urban scene, needed to model buildings façades; and on the other hand to extract point cloud of uniform surfaces which contain roofs, roads and ground used in the second phase of classification.
A second algorithm is developed to segment the uniform surface into buildings roofs, roads and ground, the second phase of classification based on the topological relationship and height variation analysis, The proposed approach has been tested using two areas : the first is a housing complex and the second is a primary school. The proposed approach led to successful classification results of buildings, vegetation and road classes.
1. INTRODUCTION
LIDAR systems are active sensors that incorporate a mechanism for direct georeferencing witch allow the collection of a significant number of points in three dimensions in a very short time, which requires a careful and powerful treatment. Automatic extraction of 3D objects from 3D LIDAR data has a very important role in the scientific community given its importance for modeling an urban scene, as it can significantly reduce the resources required for data analysis and 3D modeling of cities. Processing LIDAR point cloud in an automatic way by special algorithms permits to generate plans in an instant way.
2. STATE OF THE ART
2.1 Segmentation
The first step of processing LIDAR data is the segmentation of the point cloud into: ground and above ground. This segmentation can be obtained by using only LiDAR data or combining it with other sources of information such as 2D
cadastral data, the signal intensity. We cannot get a good interpretation from a bad segmentation result. We propose, through this paper, a study of the state of the art of different segmentation and modeling methods proposed in the literature. The segmentation can be conducted in three distinct approaches categorized on the basis of type of data used: The first is based on the point cloud; the second relates to derivative products and the third uses several complementary data sources, as non-limiting examples, satellite images, aerial photos, cadastral data, digital terrain models ... these are multi-source approaches.
2.1.1 Approaches based only on the raw point cloud
In the literature there are a limited number of algorithms for this approach such us: The octree structure, linear prediction, detection of 3D surfaces and kd-tree.
The octree structure is a data structure from tree type in which each node can have up to eight sub-nodes. The octree are most often used to partition a three dimensional space by recursively subdividing it into eight octants (Wang and Tseng, 2004). The linear prediction its principle is that each measure has a given The International Archives of the Photogrammetry, Remote Sensing and Spatial Information Sciences, Volume XLI-B3, 2016
accuracy, it operates iteratively. (Pfeifer and Kraus, 1998). Detection of 3D surfaces is a method introduced for classifying 3D objects in satellite images, a lot of work has been done in this direction, but they often focus only on the signal level. Rakesh and Ramakant studies provide an approach to detect and describe 3D objects by perceptual grouping; their purpose is to detect buildings in aerial images (Rakesh and Ramakant, 1989). Recently, Lari et al propose an algorithm that organizes the points cloud in tree (kd-tree) by calculating the neighborhood of each point in function of the local density and constructed surface shape by its neighbors then they group points that have the same characteristics .Subsequently, the result of this processing is filtered (Lari and al, 2011), (Lari and Habib, 2012).
2.1.2 Approaches based on derivative products
A significant number of algorithms and methods were developed to extract 3D objects especially the buildings from the image generated from the point cloud, this image can be a height picture (DEM), intensity image, or number of return image. Among these algorithms we can mention: The Maximum likelihood, The Bayesian network, the surface growth, The Fuzzy logic, the edge detection, the distribution analysis The Maximum likelihood is based on the DSM used to classify a set of points into several classes (Caloz and Collet, 2001). Maas in 1999 and later in 2005 proposed this method of classification which gives mathematically remarkable results (Maas, 1999) (Maas, 2005).
The Bayesian network it was applied to LIDAR data by Brunn et al in 1997 is used to discriminate between buildings and vegetation on the basis of a standardized DSM (Brunn et al, 1997).
The surface growth is used to segment the point cloud, Gorte Lee Schenk Rottensteiner, Pu and Vosselman, Rabbani and al, consider the region growing in remote sensing as the growth surface in lasergrammétrie.
Fuzzy logic is an idea that supports the possibility of belonging both at multiple classes; it is a probability of belonging to classes of objects it can appoint a "fuzzy clustering". It determines the "forces" with which an individual belongs to different classes; this method is introduced by Tovari and Vögtle for LIDAR data (Tovari and Vögtle, 2004).
Heath et al, Jiang and Bunke, Sappa and Devy have developed some algorithms for edge detection for image segmentation, but the major problem is the conversion of 3D data in 2.5 causing a huge loss of quality , precision and even data (Heath et al, 1998), (Jiang and Bunke, 1999), (and Sappa Devy 2001). Some studies combine several techniques to analyze the distribution of the points cloud including the Hough transform, RANdom sample consensus (RANSAC). Wang and Tseng in their approach organize the point cloud in a voxel space structured in octree trees and use the criteria of coherence and proximity to the segmentation (Wang and Tseng, 2010).
2.1.3 Approaches based on the combination of LIDAR data
and other sources.
LIDAR data only are not sufficient, according to some researchers, hence the necessity to be combined with other data sources. Chen and al in their study combines the topographic map and LIDAR data (Cheng and al, 2008). Habib and al propose the combination of image and LIDAR data to extract the buildings edges (Habib and al 2010; Cheng and al 2011).
According Awrangjeb and al integration of image and LIDAR data provides a more accurate result by combining the vertical accuracy of LIDAR data and planimetric continuity of the image (Awrangjeb et al, 2010).
2.2 Modeling
Modeling can be conducted in three distinct approaches: The first is based on the point cloud without reference to predefined templates or other sources of information; this is called nonparametric modeling; the second uses predefined templates, treatment refers to a set of building models; called parametric modeling. And the third modeling approach combines the two aforementioned approaches called a hybrid modeling.
2.2.1 Nonparametric modeling.
Several methods have been developed in this direction, in order to model a building without reference to predefined templates, these methods are based on mathematical models to detect the plans of existing roofs in the scene and assume that all uniforms surfaces necessarily represent the roofs of buildings.
Haala and Brenner, 1997 use DEM to extract the lines breaks in order to model plans roofs, RANSAC algorithm is also used in this range of 3D modeling methods. It was proposed by a group of researchers amongst them (Tarsha-Kurdi et al. 2007) for modeling buildings in combination with the Hough transformation, as it was proposed by (Reitberger et al. 2009) for the extraction and modeling of trees. The region growing proposed by (Al Harthy and Bethel, 2004) it is to gradually enlarge the areas around their starting point. The calculation of the mean planes passing through each pixel of the DEM generated by LIDAR data is a technique proposed by (Elaksher and Bethel, 2002). Also the mathematical morphology is proposed by (Rottensteiner and Briese, 2002) on the DEM to deduct buildings roofs in combinations with other methods such region growing.
2.2.2 Parametric modeling.
Parametric modeling refers to a catalog of predefined templates described by a set of parameters, in order to model a building just determine which model most resembles him.
From the literature there are two types of algorithms in this approach, those processing single buildings and those processing complex buildings.
In simple building cases, we find moment invariants and building outlines analysis, the moment invariants was used in image processing for a long time. The first publications date back to the 1960s (Hu 1962), According to Maas and Vosselman (Maas and Vosselman, 1999) a simple building can be described by a set of parameters that are calculated using the moments equations zero order, first order and second order. The building outlines analysis processes the DEM generated from the point cloud, firstly calculating the width and length of the building and thereafter its height; which yields the geometric parameters building (L1, L2 and h). (Weidner and Forstner, 1995; Weidner, 1996).
In complex building cases, we find the vertical profiles,Normal points;Calculation of primitives; floating model (Wang, 2008); bounding box (E. Kwak et al, 2012) and building roofs analysis (Milde et Brenner ,2009).
The Vertical profiles method combines the 3D point cloud with other external data (cadastral map, for example). Each complex building consists of a simple set of buildings. Using external The International Archives of the Photogrammetry, Remote Sensing and Spatial Information Sciences, Volume XLI-B3, 2016
data, the building is segmented and aligned in a 2D plane and their front equation is calculated, roof plans equations are formulated according to the study of the vertical profiles (Schwalbe et al. 2005), the major drawback is the availability of external data!
The normal point method segmenting point cloud on the basis of plans normal directions which are calculated using the roof points and their direct neighborhood in the DEM. (Haala et al. 1998).
The calculation of primitives proposed by Zhang and later Lafarge whose purpose is the combination of images and LIDAR data to model a complex building by breaking it into several primitive and calculates their parameters (Zhang et al. 2011).
3 AUTOMATIC SEGMENTATION OF LIDAR DATA
As presented in the state of the art, we found two principal segmentation approaches, the first uses only the point cloud so it conserves the original characteristics of LiDAR data but required memory, time, and gives us only one or two layer data such as building or building and vegetation or only treats the vegetal information. The second uses remote sensing methods which are fast and require less memory than the first one but the most important inconvenient is the loss of characteristics of LiDAR data so loss of the precision. Our approach use the LiDAR point cloud such an input data and gives as output data in the form of point cloud; the principal advantages of our process is the conservation of original characteristics of point cloud and the use of remote sensing methods to filter our data and to reduce the processing time, the second novelty in our method is the extraction of the different types of information such as building, soil, roof, road and vegetation.
3.1 Segmentation Process Developed in this Study
Algorithm developed in this research allows the automatic segmentation of LIDAR data in order to extract buildings, vegetation, soil and road. The data used are the 3D coordinates (X,Y,Z) of the first echo and number of return. The first step of this segmentation method creates immediately four classes, we list as follows: superior contour, inferior contour, uniform surface and non-uniform surface.
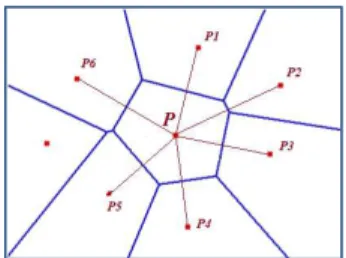
The algorithm uses the Voronoi diagram to select the set of points V={Pi} which is the closest to a given point (P) than any other point in the point cloud. Thereafter, we take all points of the set V and rank them in order of deposit growth (Figure 1).
Figure 1: Selection and ranking points (Pi) of the set {V} neighboring to a point (P) during treatment. The comparison of each point successively versus its neighbors in order highlights the class to which the point belongs by results analysis. The classification mechanism is, for each point
(P) of the cloud, to compare the elevations difference between LASER points (np) contained in a neighborhood V and (P) to an empirical threshold S1 chosen according to the desired small 3D element.
This analysis leads automatically to two cases:
Extraction of uniform and non-uniform surfaces:
If all the points of the V set have a difference between the thresholds S1 and -S1, in this case the treaty point belongs either to the uniform or non-uniform surface, if all gradients
(ΔZi<S1) are lower than S1, we move to a second treatment
which consists in separating these points into two classes; For this treatment, we calculate the equation of the plane based on the points of the set V; Thereafter, the distance (d) between the Treaty Point (p) and the plane (P) is calculated, based on the analysis of result, the point cloud is segmented into uniform and non-uniform surface (Figure 2).
Figure 2: The black dots represent the uniform surfaces, while the whites represent the non-uniform surfaces, for example,
trees.
Contour extraction :
The second case mentioned to explain it is where some of ΔZi is greater than S1, while other part is inside the interval {S1, -S1}. In this case, we are faced at points of the upper contour of the building. Another type of information to be extracted from LIDAR data, which is important in 3D modeling, is the information layer of the lower contour of 3D elements. These points are extracted in the case where a part is less than (-S1) and the other part is inside the interval {S1,-S1} as shown in figure 3.
Figure 3: Automatic extraction of upper contour class The International Archives of the Photogrammetry, Remote Sensing and Spatial Information Sciences, Volume XLI-B3, 2016
Extraction of roof class
After the detection of the aforementioned four classes, we extract the roof buildings class; it must be extracted from the uniform surface class which additionally contains the roofs of buildings, land,roads and other types of information such as, for example, vehicles. The second process developed for this extraction is based in part on the principle of the first process. Indeed, this segmentation is a series of upper contours extracting of the uniform surface layer until the number of contour points in the uniform surface layer is equal to 0 (Figure 4).
Figure 4: Automatic detecting the roof of buildings and roads and soil class.
Filtering segmented data:
To filter the results of this segmentation, we use masks as binary image of each extracted classes. Thereafter, the superposition of point cloud on the filters (treated binary image of each class) allows the elimination of noise. At first, we begin by processing the mask from building class by applying mathematical morphology which is divided into two stages: elimination of residual segments and then fill holes in the segments body. This is given by the succession of two operators: the opening used to remove small segments, and the closing used to fill holes in the ground surface segments. In the first stage which is the elimination of residual segments, we can found some small gaps in roof building caused by surveying lack which are automatically accentuated in that stage, so we applied the closing to fill holes in the roof surface segments and after that we superpose the original point cloud to the roof
surface mask to extract all roof points. That’s the particularity in
our algorithm (Figure 5). Thereafter, a dilatation are applied to results and multiplied by the upper and lower contour mask to obtain the points of buildings contour.
Figure 5: Roof buildings mask obtained before and after application of mathematical morphology operators.
Vegetation class is obtained by subtracting the upper Contour from upper Contour building and the lower Contour from lower Contour building. Finally the road class is obtained by separating ground and roads depending on the intensity (Figure
6) cconsidering that the point around buildings at given distance in the "Uniform Surfaces" class belongs at the class road
Figure 5: Extraction of Road class from “ground & road”.
Automatic segmentation of point cloud LiDAR presented in the previous section highlight several classes in an urban environment such as buildings, vegetation and roads. So to be usable, the results of the segmentation must be modeled in 3D form.
3.1 Modeling Process Developed in this Study
Modeling that we have developed are: the modeling of buildings, vegetation and roads. In our approach the modeling of a building is divided into five phases: Insulation of buildings, detection and extraction of building outlines, decomposition of building outline, extraction of buildings facades and modeling. The trees modeling consisted of three phases: Insulation of trees, detection and extraction of trees contours and modeling of trees. And road modeling consists of two phases: detection and extraction of road contours and road modeling.
we proceed in our approach to the isolation of each building or group of buildings using the region growing method, the resulting image is superimposed on the point cloud of the class "Roofs of buildings" to extract the points of each building. Figure 5 shows result of this process.
Figure 6: result of isolation of each building. After isolation of each building we extract contours of each building using the resulting mask of the previous stage, thereafter it is superimposed on the cloud point of the upper and lower edges to extract the two contours of each building (Figure 7). After the extraction of building outlines, the next step is to break down each polygon according to the building facades using the "Douglas and Peucker" algorithm.
S(roads) =
{Pi / imin <
Pi(intensite) <
}
Opening + Closing
Figure 7: result of contours extraction process. In general, for each segment we assigned two altitude values: the bottom value of the building processed and upper value which corresponds to the top of the same building. Thus, the building was modeled roughly and without considering the other details such as balconies and fireplaces. Finally, the polygons of roofs are combined with those of facades to model the building (Figure 8).
Figure 8: the modeling results
In modeling of trees we used the same algorithms and principle used for modeling of buildings, we started with the isolation of each tree, thereafter, we retrieve the upper and bottom contour of each tree based on the classes ' vegetation contours’ and", afterwards we proceeded to the modeling of trees.
Modeling the road returns to represent him in vectorial form. For this, we have adopted the same procedure used for the detection and extraction of building outlines, later we vectorized these contours to determine the models of the roads.
4. RESULTS AND DISCUSSION
To test our approach, we apply over two different sites; the first is a survey of an area of the city of Khemisset in Morocco surveyed by the National Agency of Land Conservation, Land Registry and Mapping (ANCFCC) whose density data is less than 1 point / m² and the second is free downloaded from the http://www.opentopography.org site, these data were chosen because the density of data in site 1 are lower and the density of data downloaded is greater than 4 points / m².
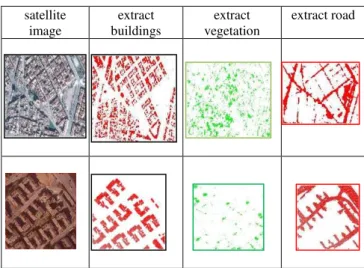
The time required to extract the different classes of the first site and second site covering more than 4ha of surface is lower than 1 min using an ordinary computermaking this method faster than other methods. Figure 9 shows the extracted buildings, vegetation and road on sites and satellite images of
. Table 1 shows extracting buildings error. The Area of site N°1 is 16.53ha with 106346 points and area of site N°2 is 3.52 ha with 158437 points. The average density of Site N°1 is (0.65 pts/m²), the segmentation threshold fixed to 2 m, and the noise element is fixed to (3*3) pixel knowing that surface of pixel in soil equal to 0.25 m².
satellite image
extract buildings
extract vegetation
extract road
Figure 9: Visualization of satellite image, building class, vegetation class and road class.
B : Number of buildings
BC : Number of buildings detected correctly MB: Number of missed buildings
BDE: number of buildings detected in errors CD: correct detections
MB: missed buildings DE: detections error
Table 1: Building extraction errors on both sites. As detailed in the methodology, the automatic modeling of buildings developed in this study are four basic steps, the result of these steps are presented in Figure 10
Site B BC MB BDE CD %
MB %
DE % 1 19
8 19
2 6 0 97 3 0
2 19 19 0 0 10
0 0 0
Figure 10: the modeling steps results
5. CONCLUSION
The originality of our research lies in the development of segmentation and modeling algorithms based on initial data and extracts the buildings, vegetation and roads in the same process. Thus, no interpolation of the point cloud is required. So the integrity, accuracy and quality of data is preserved during all steps. The process of segmentation and modeling that we have developed in this research is based on the first echo since the second echo is not always available or reliable and combines radiometric and geometric analysis.
The concept of automation deserves to be highlighted, since the developed process has the following advantages:
1. The stability regarding of the used thresholds; 2. The sequence of operations is an automatic way
without human intervention leading to a gain of time and reduction of human errors;
3. Applicable whatever the nature of the terrain and the density of the point cloud;
4. Applicable to extract buildings and vegetation of different size (as high and low trees like grass) and to extract the road and highlight their forms Evaluation of the results shows that they are satisfactory and confirms the reliability of segmentation and modeling approaches proposed. The quality of results depends strongly on the density of the point cloud.
In the future, new segmentation algorithms deserve to be developed to extract the electric lines, and railways, other modeling algorithms proves interesting to model in detail the construction by putting in obviously their details such as balconies, ducts ... and also to model trees.
REFERENCES
Antonarakis, A., Richards, K., Brasington, J., 2008. Object-Based Land-Cover Classification Using Airborne LIDAR. Remote Sensing of Environment 112, 2988–2998.
Awrangjeb, M., Ravanbakhsh, M., and Fraser, C.S., 2010. Automatic detection of residential buildings using LIDAR data and multispectral imagery, ISPRS Journal of Photogrammetry & Remote Sensing, 65, pp. 457-467.
Bao, Y., Cao, C., Chang, C., Li, X., Chen, E., Li, Z., 2007. Segmentation to the clouds of LIDAR data based on change of Kurtosis. In: International Symposium on Photo electronic Detection and Imaging . Beijing.
Bao, Y., Li, G., Cao, C., Li, X., Zhang, H., He, Q., Bai, L., Chang, C., 2008. Classification of LIDAR point cloud and generation of DTM from LIDAR height and intensity data in forested area. In: The International Archives of the Photogrammetry, Remote Sensing and Spatial Information Sciences, Beijing, China, Vol. XXXVII, Part B3b.
Bartels, M., Wei, H., 2006. Segmentation of LIDAR Data using measures of distribution. In: The International Archives of the Photogrammetry, Remote Sensing and Spatial Information Sciences, Enschede, the Netherlands, Vol, XXXVI, Part 7. Bartels, M., Wei, H., Mason, D., 2006. DTM Generation from LIDAR Data using Skewness Balancing. In: 18th International Conference on Pattern Recognition (ICPR'06) Volume 1, pp. 566-569.
Bartels, M., Wei, H., 2010. Threshold-free object and ground point separation in LIDAR data. In Pattern recognition letters 31, pp. 1089-1099.
Blaschke, T., 2010. Object Based Image Analysis for Remote Sensing. ISPRS Journal of Photogrammetry & Remote Sensing, 65, 2–16.
Boyer, K. L. and Sarkar, S., 1999. Perceptual organization in computer vision: status, challenges, and potential. Computer Vision and Image Understanding, 76(1), pp. 1.5.
Brunn, A., Weidner, U., 1997. Extracting buildings from digital surface models. IAPRS, 32, Stuttgart. International Archives of Photogrammetry and Remote Sensing (ISPRS). ISSN 1682-1750.
Caloz, R., Collet, C., 2001. Précis de télédétection, volume 3,
traitements numériques d’images de télédétection, Presses de l’université du Québec, Agence universitaire de la Francophonie, ISBN 2- 7605-1145-6(v-3). 386p.
Cheng, L., Gong, J., Chen, X., Han, P., 2008. Building boundary extraction from high resolution imagery and LIDAR data. International Archives of the Photogrammetry, Remote Sensing and Spatial Information Sciences, 37 (Part B3), pp. 693- 698.
Cheng, L., Gong, J.Y., Li, M.C., and Liu, Y.X, 2011. 3D Building Model Reconstruction from Multi-view Aerial Imagery and LIDAR Data. Photogrammetric Engineering and Remote Sensing, 77(2), pp. 125-139.
Coren, F., and Sterzai, P., 2005. Radiometric Correction in Laser Scanning. International Journal of Remote Sensing, 27(15), pp. 3097 -3014.
Crosilla F, Macorig D, Sebastianutti I, Visintini D, 2011. POINTS CLASSIFICATION BY A SEQUENTIAL HIGHER - ORDER MOMENTS STATISTICAL ANALYSIS OF LIDAR DATA. ISPRS Volume XXXVIII-5/W12,
Filin, S., 2004. Surface classification from airborne laser scanning data. Computers & Geosciences, v30, no (9-10), pp. 1033-1041,
Filin, S., Pfeifer, N., 2006. Segmentation of airborne laser scanning data using a slope adaptive neighbourhood. ISPRS Journal of Photogrammetry and Remote Sensing 60, 71-80. Gorte, Ben, 2002. Segmentation of TIN-structured laser altimetry points clouds, Symposium on Geospatial Theory, Processing and Application, 5 pages.
Habib, A.F., Zhai, R.F., and Kim, C.J., 2010. Generation of Complex Polyhedral Building Models by Integrating Stereo- Aerial Imagery and LIDAR Data. Photogrammetric Engineering and Remote Sensing, 76(5), pp. 609-623. Lo, C.Y., and Chen, L.C., 2011. Building
Heath, M., S. Sarkar, T. Sanocki, and K. Bowyery, 1998. Comparison of edge detectors a methodology and initial study, Computer Vision and Image Understanding, 69, 38-54
Hoover, A., Jean-Baptiste, G., Jiang, X., Flynn, P. J.,Bunke, H., Goldgof, D. B., Bowyer, K., Eggert, D. W.,Fitzgibbon, A. and Fisher, R. B., 1996. An experimental comparison of range image segmentation algorithms.
Höfle, B., and Pfeifer, N., 2007. Correction of laser scanning intensity data: Data and model-driven approaches. ISPRS Journal of Photogrammetry & Remote Sensing, 62(6): 415-433. Jiang, X. and H. Bunke, 1999. Edge detection in range images based on scan line approximation, Computer Vision and Image Understanding, 73, 183-199.
Jiang, X., Bunke, H. and Meier, U., 2000. High-level feature based range image segmentation. Image and Vision Computing, 18(10), pp. 817.822.
Koster, K. and Spann, M., 2000. MIR: an approach to robust clustering-application to range image segmentation.
Kraus, K., Pfeifer, N., 1998. Determination of terrain models in wooded areas with airborne laser scanner data. ISPRS Journal of Photogrammetry and Remote Sensing 53, pp. 193–203. Kraus, K., Mikhail, E.M., 1972. Linear least squares interpolation Photogramm. Eng. 38, 1016–1029.
Rakesh Mohan, Ramakant Nevatia: Using Perceptual Organization to Extract 3-D Structures
Lari, Z., A. Habib, and E. Kwak, 2011. An adaptive approach for segmentation of 3D laser point cloud. ISPRS Workshop Laser Scanning 2011, Calgary, Canada,
Lari, Z., and A. Habib, 2012. Segmentation-based classification of laser scanning data. ASPRS 2012 Annual Conference, Sacramento, California,.
Lee, I., Schenk, T., 2002. Perceptual organization of 3D surface points. Photogrammetric computer vision. ISPRS comm. III, Graz, Austria. Vol. XXXIV, part 3A/B, ISSN 1682-1750. Lee, Impyeong and Toni Schenk, 2002. Perceptual organization of 3D surface points, International Archives of Photogrammetry, Remote Sensing and Spatial Information Sciences, 34, 193-198.
Liu, X. and Wang, D. L., 1999. Range image segmentation using a relaxation oscillator network. IEEE Transactions on Neural Networks, 10(3), pp. 564.573.
Liu, Y., Li, Z., Hayward, R., Walker, R., Jin, H., 2009. Classification of Airborne LIDAR Intensity Data Using Statistical Analysis and Hough Transform with Application to Power Line Corridors. In: 2009 Digital Image Computing: Techniques and Applications, pp. 462-467.
Maas, H.-G., 1999a. The potential of height texture measures for the segmentation of airborne laserscanner data. Fourth International airborne remote sensing conference and exhibition / 21st
Maas, H.-G., 2005. Akquisition von 3D-GIS Daten durch Flugzeuglaserscanning. Kartographische Nachrichten, Vol. 55, Heft 1, S. 3-11. Canadian symposium on remote sensing, Ottawa, Ontario, Canada.
M. Bartels and H. Wei. 2006, Rule-based Improvement of Maximum Likelihood Classified LIDAR Data Fused with Co-Registered Bands. Annual Conference of the Remote Sensing and Photogrammetry Society, CD Proceedings, Cambridge, UK, 05-08
Palenichka, R.M., and Zaremba, M.B., 2010. Automatic Extraction of Control Points for the Registration of Optical Satellite and LIDAR Images. IEEE Transactions on Geoscience and Remote Sensing, 48(7), pp. 2864-2879.
Song, J., Han, S., Yu, K., and Kim, Y., 2002. Assessing the Possibility of Land-Cover Classification Using LIDAR Intensity Data. ISPRS Commission III, Symposium, Graz, Austria. P.B-259ff.
Pu, Shi, and George Vosselman, 2006. Automatic extraction of building features from terrestrial laser scanning, International Archives of Photogrammetry, Remote Sensing and Spatial Information Sciences, 36, 5 pages.
Rabbani, T., F. v. d. Heuvel, and G. Vosselman, 2006. Segmentation of point clouds using smoothness constraints, International Archives of Photogrammetry, Remote Sensing and Spatial Information Sciences, 36, 248-253.
Rottensteiner, F., 2003. Automatic generation of high-quality building models from LIDAR data, IEEE Computer Graphics and Applications, 23, 42-50.
Sappa, A.D. and M. Devy, 2001. Fast range image segmentation by an edge detection strategy, Proceedings of 3nd International Conference on 3-D Digital Imaging and Modeling, 292-299 Shea Hagstroma, David Messingera, Chester F, 2011. Line of sight analysis using voxelized discrete LIDAR. SPIE Vol. 8037 80370B-1
Tóvári. D., Vögtle. T., 2004. Classification methods for 3D objects in laserscanning data. XXth ISPRS workshop, Geo-Imagery Bridging Continents, Istanbul, International Archives of Photogrammetry and Remote Sensing, ISSN 1682-1750, Vol. XXXV, part B3.
Yan, W.Y., Shaker, A., Habib, A., and Kersting, A. P. 2012. Improving Classification Accuracy of Airborne LIDAR The International Archives of the Photogrammetry, Remote Sensing and Spatial Information Sciences, Volume XLI-B3, 2016
Intensity Data by Geometric Calibration and Radiometric Correction. ISPRS Journal of Photogrammetry and Remote Sensing, 67(1), pp. 35-44
Wang, M., Tseng, Y.-H., 2004. LIDAR data segmentation and classification based on octree structure.
Int. International Archives of Photogrammetry and Remote Sensing, ISSN 1682-1750, Vol. XXXV,
part B3.
Wang, M., and Tseng, Y.-H., 2010. Incremental segmentation of LIDAR pointclouds with an octree-structured voxelspace. The Photogrammetric Record, 26(133), pp. 32-57.