1
H NMR-Based Metabolite Profiling of Plasma in a Rat
Model of Chronic Kidney Disease
Ju-Ae Kim1,2, Hyo-Jung Choi3, Yong-Kook Kwon1,4, Do Hyun Ryu2, Tae-Hwan Kwon3*,
Geum-Sook Hwang1,4*
1Integrated Metabolomics Research Group, Seoul Center, Korea Basic Science Institute, Seoul, Korea,2Department of Chemistry, Sungkyunkwan University, Suwon, Korea,3Department of Biochemistry and Cell Biology, School of Medicine, Kyungpook National University, Taegu, Korea,4Graduate School of Analytical Science and Technology, Chungnam University, Daejeon, Korea
Abstract
Chronic kidney disease (CKD) is characterized by the gradual loss of the kidney function to excrete wastes and fluids from the blood.1H NMR-based metabolomics was exploited to investigate the altered metabolic pattern in rats with CKD induced by surgical reduction of the renal mass (i.e., 5/6 nephrectomy (5/6 Nx)), particularly for identifying specific metabolic biomarkers associated with early of CKD. Plasma metabolite profiling was performed in CKD rats (at 4- or 8-weeks after 5/6 Nx) compared to sham-operated rats. Principle components analysis (PCA), partial least squares-discriminant analysis (PLS-DA) and orthogonal partial least squares-discriminant analysis (OPLS-(PLS-DA) score plots showed a significant separation between the groups. The resulting metabolic profiles demonstrated significantly increased plasma levels of organic anions, including citrate, b-hydroxybutyrate, lactate, acetate, acetoacetate, and formate in CKD. Moreover, levels of alanine, glutamine, and glutamate were significantly higher. These changes were likely to be associated with complicated metabolic acidosis in CKD for counteracting systemic metabolic acidosis or increased protein catabolism from muscle. In contrast, levels of VLDL/LDL (CH2)nand N-acetylglycoproteins were decreased. Taken together, the observed changes of plasma metabolite profiles in CKD rats provide insights into the disturbed metabolism in early phase of CKD, in particular for the altered metabolism of acid-base and/or amino acids.
Citation:Kim J-A, Choi H-J, Kwon Y-K, Ryu DH, Kwon T-H, et al. (2014)1H NMR-Based Metabolite Profiling of Plasma in a Rat Model of Chronic Kidney
Disease. PLoS ONE 9(1): e85445. doi:10.1371/journal.pone.0085445
Editor:Leighton R. James, University of Florida, United States of America
ReceivedJune 11, 2013;AcceptedNovember 28, 2013;PublishedJanuary 20, 2014
Copyright:ß2014 Kim et al. This is an open-access article distributed under the terms of the Creative Commons Attribution License, which permits unrestricted use, distribution, and reproduction in any medium, provided the original author and source are credited.
Funding:This study was supported by the National Research Foundation of Korea (NRF) funded by the Ministry of Science, ICT & Future Planning, Korea (2010-0019393, 2010-0019394, 2013R1A1A2007266, and 2013M3A9B6046418); the Korea Healthcare Technology R&D Project, Ministry of Health & Welfare, Korea (A111345), Korea Basic Science Institute (T33409), the Creative Allied Project (CAP), and Kyungpook National University Research Fund, 2012. The funders had no role in study design, data collection and analysis, decision to publish, or preparation of the manuscript.
Competing Interests:The authors have declared that no competing interests exist. * E-mail: [email protected] (GSH); [email protected] (THK)
Introduction
Kidney is an organ which metabolizes a large number of substrates. Systemic metabolic disorder complicated in chronic kidney disease (CKD) is likely due to decreased renal function and altered metabolic activity of the kidney. These changes include disturbance of acid-base, water and electrolyte homeostasis, altered metabolism of glucose, amino acid, and lipid, accumula-tion of uremic toxins, and partial breakdown of endocrine funcaccumula-tion [1,2,3]. In particular, 3kidney plays a key role in the regulation of systemic acid–base balance by filtering blood and handling of acids and buffers. This includes the synthesis and secretion of ammonia, the excretion of titratable acids and free hydrogen ions, and the reabsorption and regeneration of bicarbonate (HCO3–) in the
renal tubular epithelial cells [4].
In healthy individuals, systemic acid–base balance is maintained by the actions of both kidneys and lungs. When glomerular filtration rate (GFR) decreases in CKD, the balance is severely disturbed [5,6], and metabolic acidosis could be complicated due to both decreased net acid excretion and impaired regeneration of bicarbonate [7]. In human patients, acid–base disorders caused by CKD are associated with a number of clinical manifestations, e.g., nausea and vomiting, electrolyte disturbances, increased
suscep-tibility to cardiovascular events, activation of muscle proteolysis, and protein degradation [5,8]. Moreover, animals with CKD induced by partial nephrectomy demonstrate that metabolic acidosis is associated with increased ammoniagenesis and activa-tion of alternative complement pathway leading to tubulointer-stitial inflammation and renal damage [9,10]. Importantly, a recent study demonstrated that bicarbonate supplementation to correct metabolic acidosis in CKD patients slows the disease progression and improves nutritional status [11].
1
insipidus [13]. Moreover, we did an integrated analysis of the transcriptome and metabolome in the kidney collecting duct cells, revealing that decreased extracellular osmolality is associated with decreased levels of organic osmolytes, glucose, intermediates of citric acid cycle, and branched chain amino acids [19]. In the present study, it is hypothesized that systemic metabolism, including metabolism of acid-base or amino acids, could be affected by renal failure and hence we aimed to identify specific metabolic biomarkers associated with early stage of CKD. The differences in the plasma levels of metabolites were investigated between rats with CKD induced by 5/6 nephrectomy (4- and 8-weeks) and corresponding sham-operated control rats by exploit-ing high resolution 1H NMR spectroscopy coupled with multi-variate statistical analysis.
Materials and Methods
CKD animal model (4- and 8-weeks after 5/6 nephrectomy in rats)
Pathogen-free male Sprague-Dawley (SD) rats (180–200 g) were obtained from Charles River (Orient Bio, Seongnam, Korea). The animal protocols were approved by the Animal Care and Use Committee of the Kyungpook National University, Korea. Experimental CKD was induced by the excision of about two-thirds of right kidney and left total nephrectomy using the so-called excision remnant kidney model, as we previously demonstrated [20,21]. Rats were anesthetized under enflurane inhalation. During surgery, they were placed on heated tables to maintain the rectal temperature at 37–38uC. Right kidney was exposed through right flank incision, gently dissected free from the adrenal gland, and approximately two-thirds of the right kidney, including the upper and lower poles, was excised. One week later, the rats were again anesthetized with enflurane inhalation, and left kidney was removed through left flank incision after dissecting it free from the adrenal gland. As a control group, rats were subjected to the sham operation identical to that used for the CKD rats except that
their kidneys and poles were not removed. Both 5/6 nephrecto-mized CKD rats and sham-operated control rats were monitored for either 4- or 8-weeks.
Plasma sample preparation
Plasma samples from the CKD rats and sham-operated rats at 4 weeks (CKD, n = 10; Sham, n = 10) or 8 weeks (CKD, n = 12; Sham, n = 12) were obtained after collecting venous blood from inferior vena cava in heparinized tubes (BD Vacutainer, Franklin Lakes, NJ). The plasma samples were stored at –80uC until NMR analysis. Before NMR analysis, the frozen plasma samples were thawed at room temperature and centrifuged (10 min at 13,000 rpm, 4uC). Next, 200mL of the supernatant was mixed with 400mL of saline buffer solution (10% D2O and 0.9% NaN3)
in 5 mm NMR tubes for analysis [12,15].
1H NMR spectroscopy
1
H NMR spectra were acquired on a VNMRS 600-MHz NMR spectrometer at 25uC using a triple resonance 5 mm HCN salt-tolerant cold probe (Agilent Technologies Inc., Santa Clara, CA). The Carr-Purcell-Meiboom-Gill (CPMG) spin-echo pulse se-quence (RD-90u-[t-180u-t] n-ACQ). A total T2 relaxation time
of 60 ms was used to attenuate broad signals from proteins and lipoproteins. The1H NMR spectrum was collected with a spectral width of 6720.4 Hz, relaxation delay of 2.0 s, and acquisition time of 4.0 s. Water solvent signal was suppressed by weak irradiating pulse on water peak during saturation delay. Free induction decay (FID) was acquired into 32,000 data points and the FID acquisitions were accumulated 128 times to increase signal-to-noise ratio. FIDs were weighted by an exponential function with a 0.3-Hz line broadening factor prior to Fourier transformation. All acquired NMR spectra were phase- and baseline-corrected, then referenced to the doublet at 1.32 ppm.
Data processing of the NMR spectra and multivariate statistical analysis
All NMR spectra were phased and baseline-corrected using AMIX software (version 3.9.4; Bruker Biospin GmbH, Rhein-stetten, Germany). Each 1H NMR spectrum from plasma collected 4 and 8 weeks after surgery was segmented into equal widths (0.005 ppm), corresponding to regions 0–9 ppm. The spectral data were normalized to the total spectral area. The data files were imported into MATLAB (R2008a; Mathworks, Natick, MA) and all spectra were aligned using the correlation-optimized warping method. The resulting data sets were then imported into SIMCA-P+version 12.0 (Umetrics, Umea, Sweden), and all data were Pareto-scaled for multivariate statistical analysis. Principal components analysis (PCA), an unsupervised pattern recognition method, was performed to examine the intrinsic variation in the data set. To maximize the separation between samples, partial least-squares discriminant analysis (PLSDA), was applied. Permu-tation test was performed to check overfitting of the PLS-DA models. The PLS-DA models were validated using jackknife cross-validation [22]. Next, orthogonal partial least squares-discriminant analysis (OPLS-DA) was used to maximize covariance between the measured data (peak intensities from the NMR spectra) and the response variable (predictive classifications). The OPLS-DA color-coded coefficient loading plot was then used, which showed metabolites contributing to the separation between the CKD and sham-operated rats. The qualities of the models were described using R2and Q2values. R2, which indicates the goodness of fit, is defined as the proportion of variance in the data explained by the model. Q2, which indicates predictability, is defined as the
Table 1.Changes of renal functions.
Parameter
Sham
24 wk CKD24 wk
Sham
28 wk CKD28 wk
n 10 10 12 12
BW (g) 43568.2 39067.9* 50468.6 478612.7 RK wt (g) 1.660.1 1.360.1* 1.660.1 2.260.2* p-osm 29960.4 30661.2* 29760.7 30761.5* (mosm/KgH2O)
p-Na+ 136
60.4 13560.9 13660.2 13660.3 (mmol/L)
p-K+ 3.8
60.1 4.260.1* 3.760.0 4.360.1* (mmol/L)
p- urea nitrogen
6.060.2 15.262.1* 5.760.1 16.261.2*
(mmol/L)
p-Creat 19.461.2 49.865.6* 21.461.3 59.763.9* (mmol/L)
n, number of rats; BW, body weight; RK, right kidney in sham-operated control rats and remnant kidney in CKD rats; p-osm, plasma osmolality; p-Na, plasma sodium, p-K, plasma potassium, p-urea nitrogen, plasma urea nitrogen; p-Creat, plasma creatinine. *P,0.05.
proportion of variance in the data predictable by the model [14]. A non-overlapping 1H signal from each metabolite was used to calculate the integral area and the identified metabolites were
quantified by relative peak intensity [23]. Resonant frequencies of each metabolite were referred from library of Chenomx NMR Sutie 7.1(Chenomx, Edomonton, Canada) and previous studies
Figure 1. Representative 600 MHz1H nuclear magnetic resonance (NMR) spectra of plasma obtained from 5/6 nephrectomized CKD rats and sham-operated control rats at 4 weeks (A) or 8 weeks (B) after 5/6 nephrectomy and sham operation.1, VLDL/LDL CH3; 2, Leucine/Isoleucine; 3, Valine; 4,b-hydroxybutyrate; 5, VLDL/LDL (CH2)n; 6, Alanine; 7, Lipid CH2CH2C = O; 8, Lipid CH2CH2C = C; 9, Arginine; 10, Acetate; 11, N-acetylglycoproteins; 12, Glutamine; 13, Methionine; 14, Lipid CH2C = O; 15, Acetoacetate; 16, Pyruvate; 17, Glutamate/Glutamine; 18, Citrate; 19, Dimethylamine (DMA); 20, Trimethylamine (TMA); 21, Creatinine; 22, Choline; 23, Trimethylamine-N-oxide (TMAO); 24, O-phosphocholine; 25, Myo-inositol; 26, Glycine; 27, Glucose/Maltose; 28, Lactate; 29, Urea; and 30, Formate. CKD, chronic kidney disease.
doi:10.1371/journal.pone.0085445.g001
[12,15,24,25,26]. The Mann–Whitney test and Welch’ t-test were performed to compare metabolite levels between the two groups. Statistical analyses were performed using Prism version 5 for Windows (GraphPad Software, San Diego, CA).
Results
CKD induced by 5/6 nephrectomy in rats
As shown in Table 1, CKD rats exhibited significantly decreased renal functions. The levels of plasma creatinine in CKD rats at 4 weeks (49.865.6mmol/L, n = 10, P,0.05) and 8 weeks (59.763.9mmol/L, n = 12, P,0.05) were significantly higher than their corresponding sham-operated control rats. Moreover, plasma urea nitrogen levels in CKD rats at 4 weeks (15.262.1 mmol/L, n = 10, P,0.05) and 8 weeks
(16.261.2 mmol/L, n = 12,P,0.05) were significantly increased (Table 1). In addition, CKD rats had higher plasma osmolality and plasma potassium levels, whereas plasma sodium concentrations were unchanged (Table 1). The weight of remnant kidneys in CKD was significantly lower at 4 weeks (1.360.1 g, n = 10,
P,0.05) than that of their corresponding sham-operated control rats (right kidney: 1. 660.1 g, n = 10, Table 1). In contrast, at 8 weeks the weight of remnant kidneys was significantly higher (2.260.2 g, n = 12, P,0.05) than their corresponding sham-operated control rats (right kidney: 1.660.1 g, n = 12, Table 1), indicating that the remnant kidneys in CKD were significantly hypertrophied.
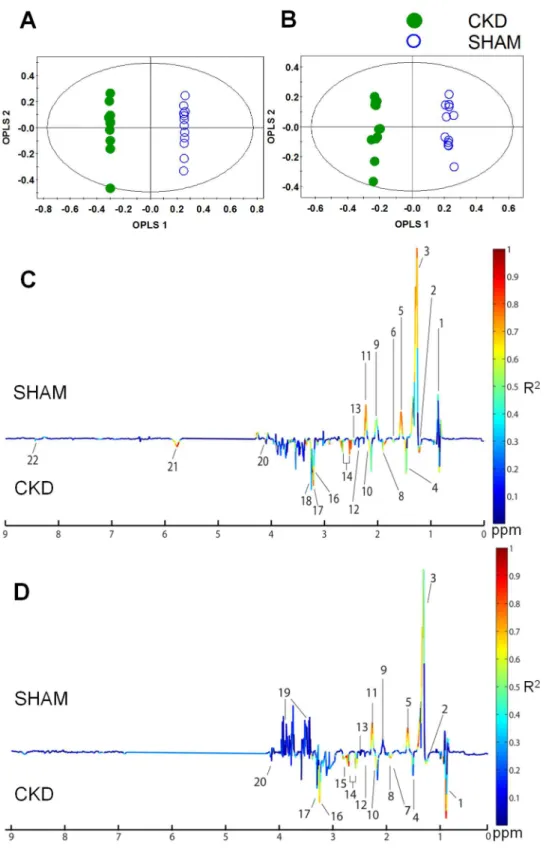
Figure 3. Orthogonal partial least-squares discriminant analysis (OPLS-DA) score and coefficient loading plots derived from the1H NMR spectra derived from plasma at 4 weeks (A, C) or 8 weeks (B, D) after 5/6 nephrectomy and sham operation.The OPLS-DA coefficient loading plot shows a significant difference in the metabolite levels between the two groups. 1, VLDL/LDL CH3; 2,b-hydroxybutyrate; 3, VLDL/LDL (CH2)n; 4, Alanine; 5, Lipid CH2CH2C = O; 6, Lipid CH2CH2C = C; 7, Arginine; 8, Acetate; 9, N-acetylglycoproteins; 10, Methionine; 11, Lipid CH2C = O; 12, Acetoacetate; 13, Glutamine/Glutamate; 14, Citrate; 15, Trimethylamine (TMA); 16, Choline; 17, Trimethylamine-N-oxide (TMAO); 18, O-phosphocholine; 19, Glucose/Maltose; 20, Lactate; 21, Urea; and 22, Formate. CKD, chronic kidney disease.
doi:10.1371/journal.pone.0085445.g003
1H NMR spectroscopic analysis of plasma
The plasma metabolites were investigated using 1H NMR spectroscopy coupled with multivariate data analysis to identify the metabolic characteristics of early stage of CKD. 1H NMR
(600 MHz) spectra of plasma samples obtained from sham-operated and CKD rats over 4 or 8 weeks are shown in Figure 1A and B. The spectral resonance of each metabolite was assigned on the basis of the 600-MHz library in Chenomx NMR suite 7.1 (Chenomx) and previous studies. Ambiguous peaks due to overlap or slight shifts were confirmed by spiking samples with the respective standard compounds. The plasma 1H NMR spectra contained a number of metabolites, including VLDL/LDL CH3,
leucine, isoleucine, valine, b-hydroxybutyrate, VLDL/LDL (CH2)n, alanine, lipid CH2CH2C = O, lipid CH2CH2C = C,
arginine, acetate, N-acetylglycoproteins, glutamine, methionine, lipid CH2C = O, acetoacetate, pyruvate, glutamate, citrate,
dimethylamine (DMA), trimethylamine (TMA), creatinine, cho-line, TMA-N-oxide (TMAO), O-phosphocholine, myo-inositol, glycine, glucose, lactate, urea, and formate. Those metabolites showing the greatest difference between the CKD and sham-operated groups were VLDL/LDL CH3, b-hydroxybutyrate,
VLDL/LDL (CH2)n, alanine, acetate, glutamine, methionine,
acetoacetate, citrate, TMA, creatinine, lactate, and formate.
Multivariate pattern recognition analysis
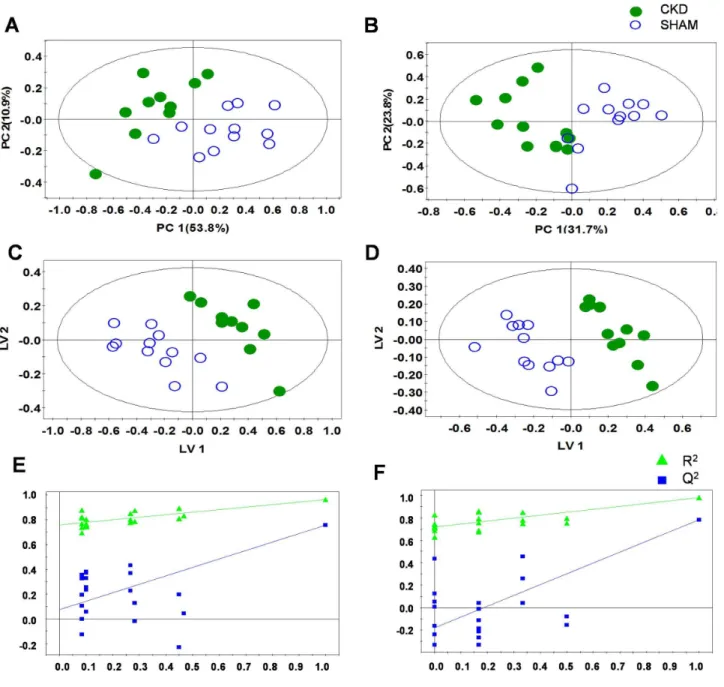
To examine intrinsic variations between the two plasma data sets, PCA was initially performed using1H NMR data [14]. As shown in Figure 2, the score plots for those samples collected at 4 weeks (Figure 2A: R2X = 0.722, Q2= 0.562) and 8 weeks
(Figure 2B: R2X = 0.672, Q2= 0.493) were distinct between the
CKD and sham-operated groups. Next, PLS-DA was employed, and it also indicated a clear difference, with increasing predict-ability of the separation between the two groups at 4 weeks (Figure 2C: R2X = 0.769, R2Y = 0.997, Q2= 0.924) and 8 weeks (Figure 2D: R2X = 0.464, R2Y = 0.982, Q2= 0.782). The PLS-DA models were validated using jackknife cross-validation. The accuracy of PLS-DA model for 4 weeks CKD models was 95% with 5 latent variables (LVs). The accuracy of PLS-DA models for 8 weeks CKD models was 100% with 3 LVs. The permutation tests of PLS-DA models showed that our models were not overfitted (Figures 2E and 2F). Next, to minimize the possible contribution of intergroup variability and to further improve the separation between the two groups, OPLS-DA was applied [15]. As shown in Figure 3, the score plots for 4 weeks (Figure 3A: R2X = 0.769, R2Y = 0.997, Q2= 0.845) and 8 weeks (Figure 3B: R2X = 0.728, R2Y = 0.996, Q2= 0.899) were clearly different between the CKD and sham-operated rats. The model parameters for explained variation, R2, and predictive capability, Q2, were calculated to assess the significance of the differences and were
Figure 4. PCA score scatter and loading plots of metabolites quantification through targeted profiling of plasma at 4 weeks (A, B) and 8 (C, D), respectively.The loading plots were produced from the score plots which showed a significant differentiation between the two groups. CKD, chronic kidney disease.
substantially high in plasma, indicating that the disease model of CKD was well established. Compared with the PCA model, our PLS-DA and OPLS-DA models indicated improved predictability, with increased Q2values. In terms of monitoring time, although the value of Q2 did not exhibit a sharp difference, better separation between the two groups was seen at 4 weeks than at 8 weeks. An OPLS-DA coefficient plot, coded by color, was constructed to investigate the underlying variables contributing to the differentiation between the two groups. In the plot, negative peaks indicate higher metabolite levels in the plasma of the CKD rats compared to the sham-operated rats, while positive peaks indicate higher metabolite levels in the plasma of the sham-operated control rats.
As shown in the OPLS-DA coefficient loading plot (Figure 3), the CKD groups at 4 weeks (Figure 3C) and 8 weeks (Figure 3D) after 5/6 nephrectomy were characterized by elevated levels ofb -hydroxybutyrate, lactate, alanine, acetate, acetoacetate, methio-nine, glutamine, glutamate, citrate, TMA, choline, phosphocho-line, TMAO, urea, and formate, and by decreased levels of VLDL/LDL (CH2)nand N-acetylglycoproteins, compared to the
sham-operated control rats. In particular, the metabolites VLDL/ LDL CH3, VLDL/LDL (CH2)n, lipid CH2CH2C = O, N
-acet-ylglycoproteins, lipid CH2C = O, b-hydroxybutyrate, alanine,
acetate, citrate, TMAO, and urea showed greater differences
between the groups than the other metabolites, regardless of whether their levels were increased or decreased. These data indicate an altered metabolic pattern between the two groups, as well as the identities of the metabolites responsible for the observed differences.
Quantitative analysis of the metabolites
NMR spectroscopy is a highly quantitative technique that can be used to accurately determine metabolite concentration, because integral area of metabolite peak is directly proportional to the metabolite concentration. A spectral peak from each metabolite was used to calculate the integral area and the identified metabolites were quantified by peak intensity. The metabolites were identified according to previous reports and the 600-MHz library from the Chenomx 7.1 NMR suite; several metabolites are displayed in Table 2. Differences in the levels of the relatively quantified plasma metabolites between the CKD and sham-operated groups were compared using multivariate analysis. PCA score plots derived from the quantification of plasma metabolites at 4 (Figure 4A; R2X = 0.72, Q2= 0.39) and 8 weeks (Figure 4C; R2X = 0.723, Q2= 0.279) show clear separation. In the same manner as global profiling, better separation of the two groups was shown at 4 weeks compared to 8 weeks based on the value of Q2. To identify the metabolites responsible for the differentiation
Figure 5. Quantification of changes of plasma metabolites in rats with CKD at 4 weeks and 8 weeks after 5/6 nephrectomy, respectively.*, **, *** indicate bonferroni correctedP,0.05,,0.01, and,0.001, respectively.
doi:10.1371/journal.pone.0085445.g005
between the two groups in the PCA score plots, PCA loading scatter plots were generated (Figure 4B, 4 weeks; Figure 4D, 8 weeks) through targeted profiling. Notably, on the basis of our quantitative data, most of the identified metabolites were substantially higher in the CKD rats than in the sham-operated rats. b-Hydroxybutyrate, lactate, alanine, acetate, acetoacetate, methionine, pyruvate, glutamine, glutamate, citrate, TMA, choline,O-phosphocholine, TMAO, creatinine, formate, and urea (4 weeks only) were elevated in the plasma of the CKD rats. In contrast, VLDL/LDL (CH2)n, lipid CH2CH2C = O, and N
-acetylglycoproteins were decreased in the rats with CKD. These results are consistent with the above OPLS-DA color-coded loading plots (Figure 3C and D). Those metabolites that differed markedly between the CKD and sham-operated groups wereb -hydroxybutyrate, alanine, lipid CH2CH2C = O, acetate,
acetoac-etate, methionine, glutamate, citrate, TMA, TMAO, urea (4 weeks only), and formate. To determine whether the differences between the CKD and sham-operated groups were significant, the Mann–Whitney test and Welch’s t-test were performed after the Shapiro–Wilk normality test. The p-value from Mann-Witney test and Welch’s t-test were adjusted by bonferroni correction for multiple comparisons. Those metabolites that were significantly different between the two groups are summarized in Table 2; the ratios of the relative metabolite concentrations in the CKDvs.the sham-operated group were shown in Table 2. In particular, significant increases in organic acids, includingb-hydroxybutyrate,
lactate, acetate, acetoacetate, citrate, and formate, and muscle-related amino acids were identified (Figure 5) and metabolic pathway related to the alteration of plasma metabolites in CKD was presented in Figure 6.
Discussion
We investigated the changes of plasma metabolites in CKD using1H NMR-based metabolite profiling approach to understand the systemic disturbance of metabolism associated with the early stage of CKD. The metabolite profiles of plasma from rats with CKD showed significantly increased levels of organic acids, including citrate,b-hydroxybutyrate, lactate, acetate, acetoacetate, and formate, accompanied by increased alanine and glutamine levels.
In the present study, the levels of various metabolites in plasma were rapidly measured using the metabolite profiling procedure and thereafter the differences in the levels of plasma metabolites were compared using multivariate analysis, e.g., PCA-DA and OPLS-DA. The metabolic profiling and multivariate pattern recognition approach we have used herein allow us to observe simultaneously a wide range of metabolites which concentrations could be changed under the progression of CKD. Since metabolites can be regulatedviaa number of metabolic pathways, investigation of the whole feature of metabolites rather than several selected metabolites enables us to understand the underlying pathophysiological status of CKD more
comprehen-Figure 6. A diagram for the changes in plasma metabolites in CKD.The metabolite profiles of plasma in rats with CKD showed significantly increased levels of lactate, pyruvate, acetoacetate,b-hydroxybutyrate, glutamine, glutamate, and citrate. Metabolic acidosis is commonly complicated in CKD, due to both decreased net acid excretion and impaired regeneration of bicarbonate. This could change the citrate reabsorption in renal tubular cells, which metabolism generates HCO3–ions producing an alkalinizing effect. Moreover, increased protein breakdown and insensitivity to epinephrine in muscle in CKD could induce the increases of alanine, glutamate, and glutamine in plasma.
sively. In this point, the current study differs from the previous reports and provides the significance of the observations.
In particular, plasma organic acids levels were significantly higher in rats with CKD. As the conjugate base of an acid, organic anions (e.g., citrate, b-hydroxybutyrate, lactate, acetate, acetoac-etate, and formate) are potential bases, because they are readily metabolized HCO3–. Generally, renal contribution to acid–base
homeostasis involves the regulated reabsorption of filtered HCO3–
ions and the regeneration of sufficient HCO3–ions to neutralize
the acid load. The kidneys also regulate alkaline compounds, including organic anions, to maintain the acid–base balance [4]. In the kidneys, HCO3–is freely filtered in the glomerulus and the
proximal tubule reabsorbs approximately 80% of the filtered HCO3– and creates new HCO3– by secreting H+ ions into its
lumen through a Na+
/H+
exchanger, and transporting HCO3–
ions via the basolateral Na+
/HCO3– co-transporter [27,28,29].
The secreted H+
ions react with filtered HCO3–to form carbonic
acid (H2CO3), which dissociates to CO2 and H2O. These
substances then enter the cell, forming H2CO3. The H2CO3is
converted into H+
and HCO3–intracellularly, thereby
regenerat-ing protons for the secretion into the lumen and the reabsorption of HCO3–into the blood [4,5,30,31,32]. Next, the thick ascending
limb of the loop of Henle reabsorbs 10–15% of the filtered HCO3–
that has escaped from the proximal tubule and then the distal tubule and collecting duct reabsorb nearly all of the remaining HCO3–[4,31,33,34,35].
In CKD, reduced net acid excretion and/or impaired reabsorption and regeneration of HCO3–could result in systemic
metabolic acidosis, due to the decreased glomerular filtration rates and the number of functioning nephrons. This was previously confirmed in CRF rats induced by 5/6 nephrectomy, demon-strating that blood pH and [HCO32] levels were significantly
decreased [36]. In this study, blood pH or [HCO32] levels were
not measured. However, CRF rats exhibited significantly in-creased blood urea nitrogen (BUN), creatinine, and potassium levels, compared with sham operated control rats. The finding
Table 2.1H chemical shift and relative concentrations of metabolites observed in plasma from CKD and sham-operated groups.
Metabolite Chemical chifts (d1H p.p.m) Fold change ratio CKD/SHAM
4 weeks 8 weeks
VLDL/LDL CH3 0.36 (m), 0.86 (m) 0.853 1.077
Isoleucine 0.94 (t), 1.03 (d), 1.46 (m), 3.66 (d), 1.090 1.094
Leucine 0.94 (t), 0.99 (d), 1.70 (m), 3.72 (m) 1.156 1.076
Valine 1.00 (d), 10.3(d) 1.201 0.957
b-hydroxybutyrate 1.12 (d), 2.3 (dd), 2.4 (dd), 4.1 (m) 1.329 1.857 *
VLDL/LDL (CH2)n 1.25 (m) 0.55** 0.745*
Lactate 1.32(d), 4.13 (m) 1.164* 1.102
Alanine 1.48 (d), 3.81 (q) 1.689* 1.395*
Lipid CH2CH2C = O 1.56 (br) 1.296 1.124
Arginine 1.63–171 (m), 1.91 (m), 323 (t) 1.366** 1.471
Lipid CH2CH2C = C 1.7 (br) 0.335** 0.428**
Acetate 1.91 (s) 1.649 1.314*
N-acetylglycoproteins 2.04 (s) 0.844* 0.947
Glutamate 2.06 (m), 2.41 (m), 3.76 (m) 1.848* 1.109
Glutamine 2.12 (m), 2.44 (m), 3.76 (m) 1.231* 1.031
Methionine 2.15 (s), 2.16 (m), 2.65 (dd), 3.87(m) 1.953 1.199
Acetoacetate 2.26 (s), 3.49(s) 1.290 1.332*
Pyruvate 2.4 (s) 1.320 1.168
Dimethylanine 2.50 (s) 0.950 1.228*
Citrate 2.54 (d), 2.69 (d) 2.846*** 1.834***
Trimethylamine 2.9 (s) 1.759*** 1.379**
Creatinine 3.04 (s), 4.05 (s) 1.645 1.382
Choline 3.19 (s), 3.50 (m), 4.07 (m) 1.224** 1.104
Glucose 3.23 (t), 3.40–3.48 (m), 4.64 (d), 5.23 (d) 1.083 0.924
Trimethylamine-N-oxide 3.27 (s) 1.338* 1.148
O-phosphocholine 3.3 (s), 4.21(t), 3.61 (t) 1.157 1.034
Urea 5.8 (br) 3.748** 4 weeks only
Tyrosine 6.88(d),7.18(d) 1.220 1.213
Formate 8.45 (s) 4.049* 1.214
Letters in parentheses denote the peak multiplicities: s, singlet; d, double; t, triplet; dd, doublet of doublet; m, multiplets and br, broad; The fold change ratio indicates the ratio of relative concentrations between CKD and sham-operated groups; Statistical analysis was performed by Mann-Whitney test and Welch’s t-test to assess the statistical significance between CKD vs. sham-operated groups; *, **, *** indicate bonferroni correctedP,0.05,,0.01, and,0.001, respectively.
doi:10.1371/journal.pone.0085445.t002
indicated that renal function was significantly deteriorated and metabolic acidosis was likely to be associated with 5/6 nephrec-tomy.
Citrate is an important metabolic substrate in the kidneys and the most prevalent of the organic anions, accounting for about 10% of the energy production [37]. We demonstrated that citrate levels were significantly increased in plasma of rats with CKD. Citrate has three carboxyl groups, and consequently the metab-olism of one citrate molecule generates three HCO3– ions
producing an alkalinizing effect [37,38]. Therefore, retention of citrate and other organic anions by the kidneys is beneficial for counteracting metabolic acidosis, while increased excretion is beneficial for attenuating metabolic alkalosis [32]. Citrate is freely filtered by the glomerulus and up to 99% of the filtered load is reabsorbed in the proximal tubuleviathe apical membrane Na+
/ citrate co-transporter [38]. Metabolic acidosis increases renal citrate reabsorption and decreases urinary excretion. Consistent with this, Brennan et al. [39] demonstrated that decreasing the luminal pH caused an increase in citrate reabsorption, while increasing the luminal pH resulted in a fall in citrate reabsorption. During metabolic acidosis, therefore, the changes in blood pH could be minimized partly by the changes in renal citrate transport and metabolism, which are brought about by an adaptive increase in the activity of the Na+
/citrate co-transporter [40]. The change of protein abundance of Na+
/citrate co-transporter in the kidneys of rats with CKD needs to be determined.
We also demonstrated that rats with CKD exhibited elevated levels of alanine, glutamine, and glutamate. Alanine and glutamine are the prime precursors in hepatic and renal gluconeogenesis, respectively, accounting for two-thirds of the total amino acids released from the muscle [41,42,43]. Previous studies demonstrat-ed that metabolic acidosis inducdemonstrat-ed by CKD was associatdemonstrat-ed with
higher levels of alanine, glutamine, and glutamate in blood, possibly due to abnormal nitrogen utilization and accelerated net protein breakdown stimulated by muscle proteolysis [44,45]. In addition, insensitivity to epinephrine affects the increases of alanine and glutamine in patients with CKD. Epinephrine is known to decrease the release and formation of alanine and glutamine by inhibiting the conversion of precursor amino acids to alanine and glutamine, and by reducing the rate of amino acid transport out of muscle cells [42]. Hence, the insensitivity to epinephrine observed in uremia, in turn, increases alanine and glutamine release from muscle [46].
In summary, we demonstrated the comprehensive systemic feature of metabolic disorders in the plasma in rats with CKD by exploiting 1H NMR-based metabolomic approaches combined with multivariate analyses. The metabolite profiles of plasma from rats with CKD demonstrated significantly increased levels of organic acids, alanine and glutamine levels. The observed changes of metabolites are likely to be clinically relevant to the well-known disturbed metabolism in early phase of CKD, in particular altered metabolism of acid-base and/or amino acids. However, since this study focused on 5/6 nephrectomy model, i.e. a surgical resection model of renal mass, further studies are needed to understand whether the observed changes in plasma metabolites are generally applicable to the CKD, irrespective of the underlying causes, e.g., diabetic kidney diseases or immune-mediated CKD.
Author Contributions
Conceived and designed the experiments: THK GSH. Performed the experiments: JAK HJC. Analyzed the data: JAK HJC YKK DHR. Contributed reagents/materials/analysis tools: DHR THK GSH. Wrote the paper: JAK HJC YKK THK GSH.
References
1. Bouby N, Hassler C, Parvy P, Bankir L (1993) Renal synthesis of arginine in chronic renal failure: in vivo and in vitro studies in rats with 5/6 nephrectomy. Kidney Int 44: 676–676.
2. RJ A, editor (2000) The kidney.6th: W.B. WB saunders Co. 455–519 p. 3. Zhao YY, Liu J, Cheng XL, Bai X, Lin RC (2011) Urinary metabonomics study
on biochemical changes in an experimental model of chronic renal failure by adenine based on UPLC Q-TOF/MS. Clin Chim Acta 413:642–649. 4. Weiner ID, Verlander JW, Wingo CS (2011) Renal acidification mechanisms.
Core Concepts in the Disorders of Fluid, Electrolytes and Acid-Base Balance: 203–233.
5. Kraut JA, Kurtz I (2005) Metabolic acidosis of CKD: diagnosis, clinical characteristics, and treatment. Am J Kidney Dis 45: 978–993.
6. Roderick P, Willis N, Blakeley S, Jones C, Tomson C (2007) Correction of chronic metabolic acidosis for chronic kidney disease patients. Cochrane Database Syst Rev 1:CD001890.
7. Kovesdy CP, Anderson JE, Kalantar-Zadeh K (2009) Association of serum bicarbonate levels with mortality in patients with non-dialysis-dependent CKD. Nephrol Dial Transplant 24: 1232–1237.
8. Charles JC, Heilman RL (2005) Metabolic acidosis. Hospital Physician 41: 37– 42.
9. Adeva MM, Souto G (2011) Diet-induced metabolic acidosis. Clin Nutr 30: 416–421.
10. Farber M, Szwed J, Dowell A, Strawbridge R (1976) The acute effects of respiratory and metabolic acidosis on renal function in the dog. Clin Sci Mol Med 50: 165–169.
11. de Brito-Ashurst I, Varagunam M, Raftery MJ, Yaqoob MM (2009) Bicarbonate supplementation slows progression of CKD and improves nutritional status. JASN 20: 2075–2084.
12. Choi J-Y, Yoon YJ, Choi H-J, Park S-H, Kim C-D, et al. (2011) Dialysis modality-dependent changes in serum metabolites: accumulation of inosine and hypoxanthine in patients on haemodialysis. Nephrol Dial Transplant 26: 1304– 1313.
13. Hwang GS, Yang JY, Ryu DH, Kwon TH (2010) Metabolic profiling of kidney and urine in rats with lithium-induced nephrogenic diabetes insipidus by1
H-NMR-based metabonomics. Am J Physiol Renal Physiol 298: F461–F470. 14. Jang ZH, Chung HC, Ahn YG, Kwon YK, Kim JS, et al. (2012) Metabolic
profiling of an alcoholic fatty liver in zebrafish (Danio rerio). Mol BioSyst 8:2001–2009.
15. Jung JY, Lee HS, Kang DG, Kim NS, Cha MH, et al. (2011)1
H-NMR-based metabolomics study of cerebral infarction. Stroke 42: 1282–1288.
16. Kirschenlohr HL, Griffin JL, Clarke SC, Rhydwen R, Grace AA, et al. (2006) Proton NMR analysis of plasma is a weak predictor of coronary artery disease. Nat Med 12: 705–710.
17. Schicho R, Shaykhutdinov R, Ngo J, Nazyrova A, Schneider C, et al. (2012) Quantitative Metabolomic Profiling of Serum, Plasma, and Urine by1
H NMR Spectroscopy Discriminates between Patients with Inflammatory Bowel Disease and Healthy Individuals. J Proteome Res 11: 3344–3357.
18. Kim CD, Kim EY, Yoo H, Lee JW, Ryu DH, et al. (2010) Metabonomic analysis of serum metabolites in kidney transplant recipients with cyclosporine A-or tacrolimus-based immunosuppression. Transplantation 90: 748–756. 19. Choi H-J, Yoon Y-J, Kwon Y-K, Lee Y-J, Chae S, et al. (2012) Patterns of Gene
and Metabolite Define the Effects of Extracellular Osmolality on Kidney Collecting Duct. J Proteome Res 11: 3816–3828.
20. Kwon TH, Frøkiaer J, Ferna´ndez-Llama P, Maunsbach AB, Knepper MA, et al. (1999) Altered expression of Na transporters NHE-3, NaPi-II, Na-K-ATPase, BSC-1, and TSC in CRF rat kidneys. Am J Physiol Renal Physiol 277: F257– F270.
21. Kwon TH, Frøkiaer J, Knepper MA, Nielsen S (1998) Reduced AQP1,-2, and-3 levels in kidneys of rats with CRF induced by surgical reduction in renal mass. Am J Physiol Renal Physiol 275: F724–F741.
22. Efron B, Gong G (1983) A leisurely look at the bootstrap, the jackknife, and cross-validation. Am Stat 37: 36–48.
23. Somashekar BS, Amin AG, Tripathi P, MacKinnon N, Rithner CD, et al. (2012) Metabolomic signatures in guinea pigs infected with epidemic-associated W-Beijing strains of Mycobacterium tuberculosis. J Proteome Res 11: 4873–4884. 24. Hong YS, Ahn YT, Park JC, Lee JH, Lee H, et al. (2010)1
H NMR-based metabonomic assessment of probiotic effects in a colitis mouse model. Arch Pharm Res 33: 1091–1101.
25. Shin JH, Yang JY, Jeon BY, Yoon YJ, Cho SN, et al. (2011) 1H NMR-based metabolomic profiling in mice infected with Mycobacterium tuberculosis. J Proteome Res 10: 2238–2247.
26. Soininen P, Kangas AJ, Wu¨rtz P, Tukiainen T, Tynkkynen T, et al. (2009) High-throughput serum NMR metabonomics for cost-effective holistic studies on systemic metabolism. Analyst 134: 1781–1785.
28. Boron WF, Boulpaep EL (1983) Intracellular pH regulation in the renal proximal tubule of the salamander. Basolateral HCO3-transport. J Gen Physiol
81: 53–94.
29. Romero MF, Hediger MA, Boulpaep EL, Boron WF (1997) Expression cloning and characterization of a renal electrogenic Na+/HCO32 cotransporter. Nature 387: 409–413.
30. Boron WF (2006) Acid-base transport by the renal proximal tubule. JASN 17: 2368–2382.
31. Laing CM, Toye AM, Capasso G, Unwin RJ (2005) Renal tubular acidosis: developments in our understanding of the molecular basis. Int J Biochem Cell Biol 37: 1151–1161.
32. Hamm LL (1990) Renal handling of citrate. Kidney Int 38: 728–735. 33. Choi I, Aalkjaer C, Boulpaep EL, Boron WF (2000) An electroneutral sodium/
bicarbonate cotransporter NBCn1 and associated sodium channel. Nature 405: 571–575.
34. Kwon TH, Fulton C, Wang W, Kurtz I, Frøkiaer J, et al. (2002) Chronic metabolic acidosis upregulates rat kidney Na-HCO3- cotransporters NBCn1 and NBC3 but not NBC1. Am J Physiol Renal Physiol 282: F341–F351. 35. Vorum H, Kwon TH, Fulton C, Simonsen B, Choi I, et al. (2000)
Immunolocalization of electroneutral Na-HCO32cotransporter in rat kidney. Am J Physiol Renal Physiol 279: F901–F909.
36. Maddox DA, Horn JF, Famiano FC, Gennari FJ (1986) Load dependence of proximal tubular fluid and bicarbonate reabsorption in the remnant kidney of the Munich-Wistar rat. J Clin Invest 77: 1639–1649.
37. Tanner GA, Tanner JA (2000) Citrate therapy for polycystic kidney disease in rats. Kidney Int 58: 1859–1869.
38. Alpern RJ (1995) Trade-offs in the adaptation to acidosis. Kidney Int 47: 1205– 1215.
39. Brennan S, Hering-Smith K, Hamm L (1988) Effect of pH on citrate reabsorption in the proximal convoluted tubule. Am J Physiol Renal Physiol 255: F301–F306.
40. Jenkins AD, Dousa TP, Smith LH (1985) Transport of citrate across renal brush border membrane: effects of dietary acid and alkali loading. Am J Physiol Renal Physiol 249: F590–F595.
41. Condon J, Asatoor A (1971) Amino acid metabolism in uraemic patients. Clin Chim Acta 32: 333–337.
42. Garber A, Karl I, Kipnis D (1976) Alanine and glutamine synthesis and release from skeletal muscle. I. Glycolysis and amino acid release. J Biol Chem 251: 826–835.
43. Garber AJ (1978) Skeletal muscle protein and amino acid metabolism in experimental chronic uremia in the rat: accelerated alanine and glutamine formation and release. J Clin Invest 62: 623–632.
44. May R, Kelly R, Mitch W (1986) Metabolic acidosis stimulates protein degradation in rat muscle by a glucocorticoid-dependent mechanism. J Clin Invest 77: 614–621.
45. May R, Kelly R, Mitch W (1987) Mechanisms for defects in muscle protein metabolism in rats with chronic uremia. Influence of metabolic acidosis. J Clin Invest 79: 1099–1103.
46. Garber AJ (1978) The regulation of skeletal muscle alanine and glutamine formation and release in experimental chronic uremia in the rat: subsensitivity of adenylate cyclase and amino acid release to epinephrine and serotonin. J Clin Invest 62: 633–641.