Phosphorylation (OXPHOS) Complex I in Friedreich
Ataxia (FRDA) Patients
Mohammad Hossein Salehi1, Behnam Kamalidehghan2, Massoud Houshmand3,4*, Goh Yong Meng5,6,
Majid Sadeghizadeh1, Omid Aryani4, Shahriar Nafissi7
1Department of Molecular Genetics, Tarbiat Modares University, Tehran, Iran,2Department of Pharmacy, Faculty of Medicine, University of Malaya (UM), Kuala Lumpur, Malaysia,3Department of Medical Genetics, National Institute for Genetic Engineering and Biotechnology, Tehran, Iran,4Department of Medical Genetics, Special Medical Center, Tehran, Iran,5Department of Preclinical Sciences, Faculty of Veterinary Medicine, Universiti Putra Malaysia, Selangor, Malaysia,6Institute of Tropical Agriculture, Universiti Putra Malaysia, Selangor, Malaysia,7Department of Neurology, Tehran University of Medical Sciences, Shariati Hospital, Tehran, Iran
Abstract
Friedreich ataxia (FRDA) is the most frequent progressive autosomal recessive disorder associated with unstable expansion of GAA trinucleotide repeats in the first intron of theFXNgene, which encodes for the mitochondrial frataxin protein. The number of repeats correlates with disease severity, where impaired transcription of the FXN gene results in reduced expression of the frataxin protein. Gene expression studies provide insights into disease pathogenicity and identify potential biomarkers, an important goal of translational research in neurodegenerative diseases. Here, using real-time PCR (RT-PCR), the expression profiles of mitochondrial (mtDNA) and nuclear DNA (nDNA) genes that encode for the mitochondrial subunits of respiratory oxidative phosphorylation (OXPHOS) complex I in the blood panels of 21 FRDA patients and 24 healthy controls were investigated. Here, the expression pattern of mtDNA-encoded complex I subunits was distinctly different from the expression pattern of nDNA-encoded complex I subunits, where significant (p,0.05) down-regulation of the mitochondrial ND2, ND4L, and ND6 complex I genes, compared to controls, were observed. In addition, the expression pattern of one nDNA-encoded gene, NDUFA1, was significantly (p,0.05) down-regulated compared to control. These findings suggest, for the first time, that the regulation of complex I subunit expression in FRDA is complex, rather than merely being a reflection of global co-regulation, and may provide important clues toward novel therapeutic strategies for FRDA and mitochondrial complex I deficiency.
Citation:Salehi MH, Kamalidehghan B, Houshmand M, Yong Meng G, Sadeghizadeh M, et al. (2014) Gene Expression Profiling of Mitochondrial Oxidative Phosphorylation (OXPHOS) Complex I in Friedreich Ataxia (FRDA) Patients. PLoS ONE 9(4): e94069. doi:10.1371/journal.pone.0094069
Editor:Dan Mishmar, Ben-Gurion University of the Negev, Israel
ReceivedDecember 4, 2013;AcceptedMarch 11, 2014;PublishedApril 4, 2014
Copyright:ß2014 Salehi et al. This is an open-access article distributed under the terms of the Creative Commons Attribution License, which permits unrestricted use, distribution, and reproduction in any medium, provided the original author and source are credited.
Funding:This work was supported by a grant(Project 187) from MH. The funders had no role in study design, data collection and analysis, decision to publish, or preparation of the manuscript.
Competing Interests:The authors have declared that no competing interests exist. * E-mail: [email protected]
Introduction
Friedreich ataxia (FRDA; OMIM# 229300) is the most common autosomal-recessively inherited ataxia that begins in childhood and leads to death in early adulthood. Patients exhibit neurodegeneration of the large sensory neurons and spinocere-bellar tracts, along with variable systemic manifestations that include hypertrophic cardiomyopathy, scoliosis, and diabetes mellitus. FRDA results from the partial loss of frataxin (FXN; Entrez Gene ID 2395), a small nuclear-encoded 18-kDa protein targeted to the mitochondrial matrix [1].
The mitochondrion is supported by the 37 mitochondrial DNA (mtDNA)-encoded genes, which are transcribed in two polycis-trones regulated by the heavy- and light-strand promoters [2]. Thirteen of these genes encode for protein subunits of the oxidative phosphorylation (OXPHOS) machinery, which are known to closely interact with nuclear DNA (nDNA)-encoded subunits within four of the five OXPHOS complexes (complexes I, III, IV and V). The mutation rate of the coding mtDNA is higher by an order of magnitude than that of most coding nDNA [3,4].
Most patients with FRDA have a pathogenic expansion of a trinucleotide repeat (GAA) within the first intron of theFXNgene, which is located on chromosome locus 9q13 [1,5,6], that impairs the transcription of frataxin, resulting in a significant reduction in mRNA and protein levels [7]. Less than 5% of patients with FRDA are compound heterozygotes with the GAA repeat in one allele and a frataxin point mutation, including missense, nonsense, or intronic mutations, in the other allele [8]. FRDA affects 1 in every 50,000 people [9], in which among affected individuals, the Caucasian and South Asian populations are overrepresented. In the general population, the repeat length is 30, while in FRDA patients the repeat length ranges from 66 to 1700 [6,10].
mitochon-drial respiratory chain activity [14], accumulation of iron in affected organs [15], faulty iron handling and impaired ISC synthesis [14]. Thus, a decrease in frataxin may also increase reactive oxygen species (ROS) produced by an increase in bioavailable iron [16,17], and the lack of iron detoxification [18]. Dysfunctional biosynthesis of mitochondrial iron-sulfur clusters and deficiency of ISC enzyme activity produces a defect in heme, which in turn causes a loss of cytochrome C. Electron transport activity impairment results in higher levels of ROS production [19,20]. Defects in ISC assembly is the primary event in frataxin-deficient cells [21], while ROS production is a secondary event [22].
Clinically, FRDA is characterized by multiple symptoms, including progressive gait and limb ataxia, dysarthria, diabetes mellitus and hypertrophic cardiomyopathy [23]. There is intra-mitochondrial iron accumulation in the heart, liver, nervous system and spleen of FRDA patients, as well as reduction in mitochondrial DNA, the Fe-S cluster-containing subunits of the mitochondrial electron transport chain (complex I–III), and the enzyme aconitase [24,25].
Complex I deficiency is the most common cause of respiratory chain dysfunction, accounting for 50% of all cases. Pathogenic mutations have been identified in nuclear genes that encode both complex I structural subunits and complex I assembly factors, and in all seven of the complex I mtDNA-encoded subunit genes [26]. Mitochondrial respiratory complex I deficiency and oxidative stress have been reported to occur in this disease, but mtDNA and nDNA that encode for the subunits of the chain complex could be considered a candidate modifier factor for FRDA disease [27].
The coordinated expression of known OXPHOS genes goes beyond a mitochondrial or even OXPHOS pattern of expression, to the level of individual complexes, in which the levels of mRNA are influenced by common promoter elements or a feedback mechanism from the assembled complexes [28]. Furthermore, It has been suggested that the regulation of expression of the OXPHOS complex I subunits in humans is complex and tends to undergo divergence of sub-clustered expression, rather than reflect global co-regulation [29].
In this study, the expression pattern profiles of NDUFA4, one of the nDNA-encoded subunits of complex IV, and 16 mitochondrial complex I subunits, including 7 mtDNA and 9 nDNA-encoded subunits, were analyzed in FRDA patients in order to determine whether the complex I genes were expressed through co-regulation or through sub-clustering.
Materials and Methods
Specimen Collection and Ethical Statement
Twenty-one FRDA patients, including 9 females and 12 males with a mean age of 17.8 years from 16 unrelated families, were diagnosed with clinical features that are summarized in Table 1. Blood samples from 21 FRDA patients and 24 random individuals of mixed ethnicities (as healthy controls) were obtained from the Special Medical Center, Tehran, Iran.
The exclusion criterion for the healthy control group was any history of cancer, metabolic diseases or mitochondrial DNA-related diseases that may affect mtDNA and nDNA. Written informed consent, including consent to participate in the study and consent to publish, was obtained from the patients, parents on behalf of children, and healthy controls for the present study in accordance with the Special Medical Center and Medical Ethics
RNA Extraction and cDNA Synthesis
RNA was extracted using the High Pure RNA Isolation Kit (Roche, Germany) and the products were transferred to280uC for storage. Total cDNA was produced using the RevertAid First Strand cDNA Synthesis Kit (Fermentas, USA), according to the manufacturer’s protocol. The products were transferred to220uC for storage. The cDNA was used for subsequent real time-PCR amplification of the nDNA-encoded NDUFA1, NDUFA4, NDUFA5, NDUFA10, NDUFA12, NDUFB10, NDUFB11, NDUFS2, NDUFC2, NDUFV1 genes, and the mtDNA-encoded ND1, ND2, ND3, ND4, ND4L, ND5 and ND6 genes. Glycer-aldehyde 3-phosphate dehydrogenase (GAPDH) and beta–actin (B-ACT) were used as the reference genes for gene expression analysis. The real time-PCR products were transferred to220uC for storage.
Real time-PCR Analysis
Relative quantification of the transcript levels of the genes encoding for the nDNA and mtDNA subunits of complex I and NDUFA4, a subunit from complex IV, was investigated using real time-PCR (Table 2). 100–300 ng of cDNA from the 21 patients and 24 controls were subjected to real time-PCR amplifications in 20ml reactions containing 1X Absolute SYBER Green ROX Mix, Thermo and 100 nM of each specific primer (Table 3). All primer pairs were initially tested via standard RT-PCR using the same conditions as described for real-time RT-PCR. Amplification of single products of expected size was verified by electrophoresis on 3% agarose gel and ethidium bromide staining (data not shown). The real time-PCR amplifications were carried out in a Rotor-Gene 6000 (Corbett) Real Time-PCR machine with the following protocol: 15 seconds at 95uC, followed by 40 cycles of denaturation for 30 seconds at 95uC, annealing for 1 minute at 60uC and extension for 30 seconds at 72uC. Each experiment was performed in duplicate tubes, and was repeated three times. To control for DNA contamination in the reaction mix, control tubes lacking DNA templates were included in duplicates, with the relevant set of primers in each experiment. Standard curves were generated in triplicates for each primer using ten-fold serial dilutions of a cDNA sample prepared from total RNA. PCR amplifications were also done without cDNA template, as negative control, to monitor the reagents utilized in the assay for possible contamination. The efficiencies of the eighteen pairs of primers were calculated. To determine their amplicon specificity, electro-phoresis analysis of the real time-PCR products was also carried out. The real time-PCR Rotor-Gene 6000 software was used to determine the amplification cycle in which product accumulation was above the threshold (Ct). Real time-PCR Ct values (see Tables 4 and 5) were analyzed using the 22DDCt
method [30]. In each experiment, the mean Ct of duplicate tubes for a given gene was normalized to the mean Ct value of the reference gene (GAPDH). A1, A4, A5, A10, A12, B10, B11, S2, C2, V1 are abbreviations of the the nDNA-encoded NDUFA1, NDUFA4, NDUFA5, NDUFA10, NDUFA12, NDUFB10, NDUFB11, NDUFS2, NDUFC2, NDUFV1 genes, respectively. Additionally, the expression levels of the nuclear NDUFA5 and NDUFB10 genes and the mitochondrial ND1 and ND5 genes of complex I were investigated using B-ACT as a housekeeping gene (see Figures 1, 2, 3, and 4), in order to confirm the reliability of the results achieved with GAPDH as a housekeeping gene (Table 5).
Statistical analysis
Table 1.Clinical characteristics of the 21 FRDA patients.
No. of
Patients Gender
Consanguineous marriages
History of family
Age of onset
Age of Diagnosis
Limb Ataxia
Lower-Limb Areflexia
Decreased Vibration Sense
Extensor Plantar Response
Axonal
Neuropathy Dysarthri Eye Movement Abnormality*
Optic Atrophy
Food Deformity
Diabetes or Glucose Intolerance
GAA Repeat
FRDA 01 F None 4 13 17 + + + + + + N _ + _ 384
FRDA 02 M First 1 11 13 + + + + + + N _ + _ 329
FRDA 03 M First 1 14 16 + + + + + + N _ + _ 426
FRDA 04 M None 7 12 25 + + + + _ + DS _ _ _ 566
FRDA 05 M None 7 17 21 + + + + + + DS _ + _ 269
FRDA 06 M None 7 7 19 + + _ + _ + N _ _ _ 890
FRDA 07 M None 1 5 21 + + _ + _ + SWJ _ _ _ 947
FRDA 08 M None 1 6 19 + + _ None _ + _ _ _ _ 878
FRDA 09 F First None 12 16 + + _ + _ + SWJ + _ _ 498
FRDA 10 M None 1 23 29 + + _ + + + DS _ + _ 247
FRDA 11 M None 1 15 19 + + _ None _ + _ _ _ _ 584
FRDA 12 M None 1 15 15 + + + + _ _ _ _ _ _ 618
FRDA 13 F First None 6 25 + + + + + + N _ + _ 908
FRDA 14 F None 3 13 28 + + _ + + + N _ + _ 405
FRDA 15 F None 1 2 4 + + + + + + N _ + _ 981
FRDA 16 M First 1 12 26 + + + + + + N _ + _ 432
FRDA 17 F None None 3 8 + + _ + _ + DS + _ + 812
FRDA 18 F First 2 13 16 + + + + + + DS _ + _ 479
FRDA 19 F First 2 9 10 + + + + + + N _ + _ 554
FRDA 20 M First 1 15 17 + + + + _ + N _ _ _ 360
FRDA 21 F None 1 8 10 + + + + _ + SWJ _ _ _ 714
*N: Nystagmus; DS: Dysmetric Saccades; SWJ: Square Wave Jerks. doi:10.1371/journal.pone.0094069.t001
Gene
Expressi
on
of
Mitochondria
l
Complex
I
in
ONE
|
www.ploson
e.org
3
April
2014
|
Volume
9
|
Issue
4
Table 2.The tested complex I subunits, their genome affiliation (mtDNA or nuclear DNA), and their location in complex I/IV, as well as NDUFA4 from complex IV.
Complex I/IV Gene Name Locus (mtDNA/nDNA) Location
Complex I
NDUFA1 nDNA Hydrophobic arm
NDUFA5 nDNA Hydrophilic arm
NDUFA10 nDNA Hydrophobic arm
NDUFA12 nDNA Hydrophilic arm
NDUFB10 nDNA Hydrophobic arm
NDUFB11 nDNA Hydrophobic arm
NDUFC2 nDNA Hydrophobic arm
NDUFS2 nDNA Hydrophilic arm
NDUFV1 nDNA Hydrophilic arm
ND1 mtDNA Hydrophobic arm
ND2 mtDNA Hydrophobic arm
ND3 mtDNA Hydrophobic arm
ND4 mtDNA Hydrophobic arm
ND4L mtDNA Hydrophobic arm
ND5 mtDNA Hydrophobic arm
ND6 mtDNA Hydrophobic arm
Complex IV
NDUFA4 nDNA Hydrophobic arm
doi:10.1371/journal.pone.0094069.t002
Table 3.Real time-PCR primers of selected nuclear and mitochondrial genes.
Gene Name Primer Sequences PCR Efficiency (%) Tm (6C) Amplicon Size (bp)
NDUFA1 F:ATGTGGTTCGAGATTCTCC R:GCAACCCTTTTTTCCTTGC 97.60 82.69 116
NDUFA4 F:CAGAGCCCTGGAACAAACTGGG R:GACCTTCATTCTAAAGCAGCG 96.69 76.82 137
NDUFA5 F:GAGAAGCTGGCTATGGTTAAAGCG R:CCACTAATGGCTCCCATAGTTTCC 96.18 77.18 154
NDUFA10 F: CACCTGCGATTACTGGTTCAG R:GCAGCTCTCTGAACTGATGTA 97.22 78.73 130
NDUFA12 F:ACATTCTGGGATGTGGATGG R:CTAGTGGTAGAATAAGGTAC 96.69 77.21 156
NDUFB10 F:TAGAGCGGCAGCACGCAAAG R:CTGACAGGCTTTGAGCCGATC 100.78 82.23 188
NDUFB11 F:GGAAAGCGGCCCCCAGAACCGAC R:CCACGCTCTTGGACACCCTGTGC 99.34 82.46 231
NDUFC2 F:GGTTTGCATCGCCAGCTTC R:CAGGAAAATCCTCTGGATG 102.47 75.87 137
NDUFS2 F:ACCCAAGCAAAGAAACAGCC R:AATGAGCTTCTCAGTGCCTC 97.22 83.30 214
NDUFV1 F:TGAGACGGTGCTGATGGACTTC R:AGGCGGGCGATGGCTTTC 99.34 85.22 113
ND1 3439H:CTACTACAACCCTTCGCTGAC 3655L:GGATTGAGTAAACGGCTAGGC 99.44 79.53 216
ND2 4892H:CATATACCAAATCTCTCCCTC 5166L:GTGCGAGATAGTAGTAGGGTC 90.08 77.85 274
ND3 10166H:TTACGAGTGCGGCTTCGACC 11455L:CCTAGTTTTAAGAGTACTGCG 90.64 78.19 189
ND4 11269H:CTAGGCTCACTAAACATTCTA 11455L:CCTAGTTTTAAGAGTACTGCG 96.74 77.23 186
ND4L 10528H:TAGTATATCGCTCACACCTC 10726L:GTAGTCTAGGCCATATGTG 96.63 81.33 198
ND5 3627H:TCGAATAATTCTTCTCACCC 13725L:TAGTAATGAGAAATCCTGCG 96.37 77.70 98
ND6 14359H:GTAGGATTGGTGCTGTGG 4258L:GGATCCTCCCGAATCAAC 97.98 77.75 119
GAPDH F:GAAGGTGAAGGTCGGAGTC R:GAAGATGGTGATGGGATTTC 99.35 80.78 200
Reference Gene Gene Name Ct Tg patient Ct Tg Control DCt TG Ct HK patient Ct HK Control DCt HK DDCt 22(DDCt)
GAPDH
ND1 23.6 25.75 22.15 21.53 23.11 21.58 20.57 1.5
ND2 23.39 21.78 1.61 21.53 23.11 21.58 3.19 0.1
ND3 19.63 22.02 22.39 21.53 23.11 21.58 20.81 1.8
ND4 19.92 20.78 20.86 21.53 23.11 21.58 0.72 0.6
ND4L 18.69 19.07 20.38 21.53 23.11 21.58 1.2 0.4
ND5 21.37 23.75 22.38 21.53 23.11 21.58 20.8 1.7
ND6 19.61 19.35 0.26 21.53 23.11 21.58 1.84 0.3
NDUFA1 23.86 24.07 20.21 21.53 23.11 21.58 1.37 0.4
NDUFA4 22.86 24.25 21.39 21.53 23.11 21.58 0.19 0.9
NDUFA5 26.07 27.86 21.79 21.53 23.11 21.58 20.21 1.2
NDUFA10 24.55 26.48 21.93 21.53 23.11 21.58 20.35 1.3
NDUFA12 25.53 27.35 21.82 21.53 23.11 21.58 20.24 1.2
NDUFB10 23.63 25.85 22.22 21.53 23.11 21.58 20.64 1.6
NDUFB11 25.04 26.75 21.71 21.53 23.11 21.58 20.13 1.1
NDUFC2 23.6 25.58 21.98 21.53 23.11 21.58 20.4 1.3
NDUFS2 24.66 26.44 21.78 21.53 23.11 21.58 20.2 1.1
NDUFV1 23.86 25.75 21.89 21.53 23.11 21.58 20.31 1.2
B-ACT
ND1 22.87 26.05 23.18 22.36 23.85 21.49 21.69 3.2
ND5 18.7 19.08 20.38 22.36 23.85 21.49 1.11 0.5
A5 26.07 28.01 21.94 22.36 23.85 21.49 20.45 1.4
B10 24.27 26.38 22.11 22.36 23.85 21.49 20.62 1.5
doi:10.1371/journal.pone.0094069.t004
Gene
Expressi
on
of
Mitochondria
l
Complex
I
in
ONE
|
www.ploson
e.org
5
April
2014
|
Volume
9
|
Issue
4
performed using Microsoft Office Excel 2010 and GraphPad Prism 6.0 software.
Results
The presence of GAA repeat expansions on both alleles in 21 FRDA patients, including 12 males and 9 females, were confirmed
using PCR. The gene expression of the nuclear and mitochondrial DNA genes encoding for complex I subunits were profiled using real time-PCR and the relative expression patterns of genes were normalized with GAPDH as the housekeeping gene. In order to evaluate amplification specificity and efficiency, electrophoresis was performed for the real time-PCR amplicons, where only a
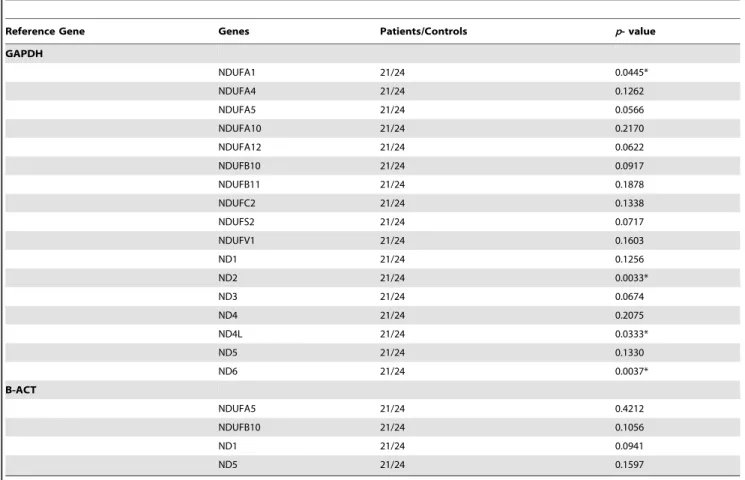
Table 5.Statistical analysis of the nuclear and mitochondrial complex I and IV genes.
Reference Gene Genes Patients/Controls p- value
GAPDH
NDUFA1 21/24 0.0445*
NDUFA4 21/24 0.1262
NDUFA5 21/24 0.0566
NDUFA10 21/24 0.2170
NDUFA12 21/24 0.0622
NDUFB10 21/24 0.0917
NDUFB11 21/24 0.1878
NDUFC2 21/24 0.1338
NDUFS2 21/24 0.0717
NDUFV1 21/24 0.1603
ND1 21/24 0.1256
ND2 21/24 0.0033*
ND3 21/24 0.0674
ND4 21/24 0.2075
ND4L 21/24 0.0333*
ND5 21/24 0.1330
ND6 21/24 0.0037*
B-ACT
NDUFA5 21/24 0.4212
NDUFB10 21/24 0.1056
ND1 21/24 0.0941
ND5 21/24 0.1597
The nDNA and mtDNA genes are normalized to GAPDH in FRDA patients compared to controls. The expression levels of four selected nDNA (NDUFA5 and NDUFB10) and mtDNA (ND1 and ND5) genes were normalized to B-ACT as a housekeeping gene in order to confirm the consistency of the result to those observed with GAPDH for quantitative gene expression analysis (P.0.05).
Statistical significance is expressed as *P,0.05vscontrols. doi:10.1371/journal.pone.0094069.t005
single band of the respective expected PCR product sizes were observed (data not shown).
Gene expression analysis was performed using the relative quantification method and compared to controls according to the Livak method [30] as summarized in Table 4. Additionally, the Ct range was assessed and the coefficient of variance for each gene across all samples was calculated in order to reveal the differences in transcript levels between the 17 nDNA and mtDNA genes.
In this study, the transcript levels of most mtDNA-encoded genes were lower than the transcript levels of the nDNA-encoded genes (Figure 1). However, the transcript variations of mtDNA-encoded genes were higher than that of the nDNA-mtDNA-encoded genes (Figure 2). The melting temperatures (Tm) of all PCR products ranged from 77.21uC for NDUFA12 to 85.22uC for NDUFV1 (Figure 3). The amplification efficiency of the primers varied from 90.08% for ND2 to 102.47% for NDUFC2. No primer dimers or non-specific amplification were observed. The PCR efficiency, melting temperature and amplicon size of selected genes are summarized in Table 3.
Our results indicated that there were significant differences at the transcript level between the nDNA and mtDNA subunit genes of complex I in patients compared to controls (Table 5). Specifically, mtDNA-encoded ND2, ND4L, and ND6 genes indicated significantly lower (p,0.05) gene expression than most of the other mtDNA-encoded genes in patients compared to controls, in which ND2 demonstrated the lowest relative gene expression level as compared to most of the mtDNA- and nDNA-encoded genes in patients compared to controls. Additionally, the relative gene expression level of the nDNA-encoded NDUFA1 subunit gene was lowest (p,0.05) compared to most of the nDNA-encoded genes in patients compared to controls and was expressed at a level similar to the mtDNA-encoded ND4L subunit gene in patients (Figure 4).
Discussion
In this study, in order to identify the subset of key genes responsible for the clinical phenotype seen in FRDA patients, the gene expression profiles of OXPHOS complex I genes in patients Figure 3. The melting curves of the nuclear and mitochondrial complex I genes as well as NDUFA4 from complex IV in FRDA patients compared to controls.
were compared to the control groups. We hypothesized that mitochondrial and nuclear genes that encode for oxidative phosphorylation (OXPHOS) complex I subunits tend to undergo divergence and have sub-clustered expression rather than co-regulation. As previously reported, the transcription of many OXPHOS genes in type 2 diabetes mellitus, a metabolic disorder, is governed by co-regulation [31,32], while another study revealed that the regulation of OXPHOS complex I subunit gene expression in humans is complex rather than reflecting global regulation [29]. Therefore, to examine gene expression as a co-regulation or sub-clustering mechanism, the 16 complex I subunit transcripts, including all seven mtDNA-encoded and nine nDNA-encoded subunits of complex I genes were investigated in FRDA patients. Additionally, one of the nDNA-encoded complex IV structural subunit genes, NDUFA4, formerly considered as a constituent of the complex I subunit, was also examined in this study [33].
Our findings showed the existence of two clusters of expression profiles in the OXPHOS complex I subunit genes, including all the mtDNA-encoded subunit genes and most of the tested nDNA-encoded subunit genes, where the mtDNA-nDNA-encoded subunit genes are the major contributors to the divergence compared to the nDNA-encoded subunit genes, with co-regulated expression.
FRDA is caused by a GAA trinucleotide expansion in the first intron of the frataxin gene [10], leading to reduced expression of the mitochondrial protein frataxin. Frataxin is critically involved in iron sulfur cluster assembly, iron homeostasis [1,8], and is a controller of intracellular oxidative stress by modulating the concentration of ROS [34]. In agreement with previous studies [1,35,36], our investigation revealed homozygous GAA triplet repeat expansions within the first intron of the FXN gene. Additionally, our results are clinically in line with previous studies [1,6,9], showing that FRDA is determined by progressive ataxia of gait and extremities, dysarthria and areflexia. Muscle weakness is evident particularly in the lower limbs, though signs of weakness or fatigue may be masked by more prominent features of FRDA.
It is noteworthy to mention that the frataxin is particularly abundant in tissues that are rich in mitochondria, such as liver, heart, pancreas, muscle, brown fat, thymus and kidney [6,37,38]. However, the choice of blood samples in the present study was due to scarce availability of the main target tissues. FRDA patients with low levels of frataxin may have heteroplasmic mtDNA mutations, where the combination of mitochondrial mutations, altered proteins, excess iron and increased ROS could contribute significantly to the disease state [39]. Deficiencies in the activities of the iron-sulfur cluster (ISC)-dependent aconitase, neural and cardiac cell degeneration as well as mitochondrial respiratory chain complexes I, II and III have been demonstrated in FRDA patients [40].
Accumulation and imbalance of iron can lead to oxidative stress, the generation of ROS and severe mitochondrial damage. Formation of ROS as a by-product of the OXPHOS process results in damaged DNA, RNA, proteins and lipids in many degenerative diseases, cancer and aging [39]. Frataxin deficiency causes more sensitivity to oxidative stress [35], mtDNA and nDNA instability, chromosomal mutations and enhanced recombination rates, probably through hydrogen peroxide intermediates [39].
Mitochondrial diseases with defects in the OXPHOS system are mediated by mutations in either nDNA or mtDNA, and therefore have distinct patterns of inheritance, depending on the genetic origin [41]. Complex I deficiency is the most common defect of the mitochondrial OXPHOS system, which accounts for about one third of all cases of OXPHOS disorders [42]. Analyses of complex I deficiency have revealed mutations in some nDNA-encoded and mtDNA subunit genes in OXPHOS disorders [41]. Our study showed the significant down-regulation of the nDNA-encoded subunit gene NDUFA1 and three mtDNA complex I genes ND2, ND4L and ND6 in FRDA patients compared to controls. A microarray-based analysis indicated evidence for co-transcription of OXPHOS genes, showing the preference of subunits of each OXPHOS complex to cluster separately [28]. It seems that mtDNA-encoded subunits are transcribed in a polycistronic fashion and are regulated by the same promoter (excluding ND6) [29,43]. However, the variation of complex I gene expression response in our study, might be attributed to existence of post-transcriptional regulatory mechanisms and/or differences in mRNA stability among mtDNA-encoded genes. Additionally, post-transcriptional regulation was previously ob-served for mtDNA-encoded tRNA genes, suggesting that such regulation is not restricted to protein coding mtDNA genes [44].
Conclusions
This study provides the first description of the gene expression patterns of 16 OXPHOS complex I subunit genes and the NDUFA4 gene, a subunit of complex IV - a total of 17 genes consisting of seven hallmark mtDNA-encoded genes and ten representative nDNA-encoded subunit genes in FRDA patients compared to controls. The expression of nDNA-encoded subunit genes clustered separately from those of the mtDNA-encoded subunit genes, in which most of the nDNA-encoded subunit genes, such as NDUFA4, NDUFA5, NDUFA10, NDUFA12, NDUFB10, NDUFB11, NDUFC2, NDUFS2, NDUFV1, revealed distinct co-regulated gene expressions, compared to the mtDNA-encoded subunit genes, indicating sub-clustering gene expression. Additionally, the down-regulation of the mtDNA-encoded ND2, ND4L and ND6 subunit genes revealed a divergence, due to mutations, from the rest of the mtDNA-endoded genes regulated by the same promoter. Taken together, our analysis on the mitochondrial complex I gene expression patterns has led to a better understanding of the therapeutic strategies and molecular mechanisms of FRDA in order to predict genetic risk and potentially pave the way for a new diagnostic tool for FRDA patients.
Acknowledgments
We would like to thank for all the participants for their blood donation at the Medical Genetics Department at the Special Medical Center, Tehran, Iran.
Author Contributions
Conceived and designed the experiments: MH. Performed the experi-ments: MHS. Analyzed the data: MS OA SN GYM. Wrote the paper: BK.
References
1. Campuzano V, Montermini L, Lutz Y, Cova L, Hindelang C, et al. (1997) Frataxin is reduced in Friedreich ataxia patients and is associated with mitochondrial membranes. Human molecular genetics 6: 1771–1780. 2. Bonawitz ND, Clayton DA, Shadel GS (2006) Initiation and beyond: multiple
functions of the human mitochondrial transcription machinery. Molecular cell 24: 813–825.
3. Grossman LI, Wildman DE, Schmidt TR, Goodman M (2004) Accelerated evolution of the electron transport chain in anthropoid primates. Trends in Genetics 20: 578–585.
5. Harding AE (1981) Friedreich’s ataxia: a clinical and genetic study of 90 families with an analysis of early diagnostic criteria and intrafamilial clustering of clinical features. Brain: a journal of neurology 104: 589–620.
6. Campuzano V, Montermini L, Molto` MD, Pianese L, Cosse´e M, et al. (1996) Friedreich’s ataxia: autosomal recessive disease caused by an intronic GAA triplet repeat expansion. Science 271: 1423–1427.
7. Ohshima K, Montermini L, Wells RD, Pandolfo M (1998) Inhibitory Effects of Expanded GAA?TTC Triplet Repeats from Intron I of the Friedreich Ataxia Gene on Transcription and Replicationin Vivo. Journal of Biological Chemistry 273: 14588–14595.
8. Cosse´e M, Du¨rr A, Schmitt M, Dahl N, Trouillas P, et al. (1999) Friedreich’s ataxia: point mutations and clinical presentation of compound heterozygotes. Annals of neurology 45: 200–206.
9. Tan G, Chen L-S, Lonnerdal B, Gellera C, Taroni FA, et al. (2001) Frataxin expression rescues mitochondrial dysfunctions in FRDA cells. Human molecular genetics 10: 2099–2107.
10. Cosse´e M, Schmitt M, Campuzano V, Reutenauer L, Moutou C, et al. (1997) Evolution of the Friedreich’s ataxia trinucleotide repeat expansion: founder effect and premutations. Proceedings of the National Academy of Sciences 94: 7452–7457.
11. Stemmler TL, Lesuisse E, Pain D, Dancis A (2010) Frataxin and mitochondrial FeS cluster biogenesis. Journal of Biological Chemistry 285: 26737–26743. 12. Rouault TA (2012) Biogenesis of iron-sulfur clusters in mammalian cells: new
insights and relevance to human disease. Disease models & mechanisms 5: 155– 164.
13. Lill R, Hoffmann B, Molik S, Pierik AJ, Rietzschel N, et al. (2012) The role of mitochondria in cellular iron–sulfur protein biogenesis and iron metabolism. Biochimica et Biophysica Acta (BBA)-Molecular Cell Research 1823: 1491– 1508.
14. Ro¨tig A, de Lonlay P, Chretien D, Foury F, Koenig M, et al. (1997) Aconitase and mitochondrial iron–sulphur protein deficiency in Friedreich ataxia. Nature genetics 17: 215–217.
15. Zecca L, Youdim MB, Riederer P, Connor JR, Crichton RR (2004) Iron, brain ageing and neurodegenerative disorders. Nature Reviews Neuroscience 5: 863– 873.
16. Mu¨hlenhoff U, Richhardt N, Ristow M, Kispal G, Lill R (2002) The yeast frataxin homolog Yfh1p plays a specific role in the maturation of cellular Fe/S proteins. Human molecular genetics 11: 2025–2036.
17. Shoichet SA, Ba¨umer AT, Stamenkovic D, Sauer H, Pfeiffer AF, et al. (2002) Frataxin promotes antioxidant defense in a thiol-dependent manner resulting in diminished malignant transformation in vitro. Human molecular genetics 11: 815–821.
18. Gakh O, Park S, Liu G, Macomber L, Imlay JA, et al. (2006) Mitochondrial iron detoxification is a primary function of frataxin that limits oxidative damage and preserves cell longevity. Human molecular genetics 15: 467–479.
19. Napoli E, Taroni F, Cortopassi GA (2006) Frataxin, iron-sulfur clusters, heme, ROS, and aging. Antioxidants & redox signaling 8: 506–516.
20. Calabrese V, Lodi R, Tonon C, D’Agata V, Sapienza M, et al. (2005) Oxidative stress, mitochondrial dysfunction and cellular stress response in Friedreich’s ataxia. Journal of the Neurological Sciences 233: 145–162.
21. Puccio H, Simon D, Cosse´e M, Criqui-Filipe P, Tiziano F, et al. (2001) Mouse models for Friedreich ataxia exhibit cardiomyopathy, sensory nerve defect and Fe-S enzyme deficiency followed by intramitochondrial iron deposits. Nature genetics 27: 181–186.
22. Yang J, Cavadini P, Gellera C, Lonnerdal B, Taroni F, et al. (1999) The Friedreich’s ataxia mutation confers cellular sensitivity to oxidant stress which is rescued by chelators of iron and calcium and inhibitors of apoptosis. Human molecular genetics 8: 425–430.
23. Mateo I, Llorca J, Volpini V, Corral J, Berciano J, et al. (2004) Expanded GAA repeats and clinical variation in Friedreich’s ataxia. Acta neurologica scandinavica 109: 75–78.
24. Bradley J, Blake J, Chamberlain S, Thomas P, Cooper J, et al. (2000) Clinical, biochemical and molecular genetic correlations in Friedreich’s ataxia. Human molecular genetics 9: 275–282.
25. Bulteau A-L, O’Neill HA, Kennedy MC, Ikeda-Saito M, Isaya G, et al. (2004) Frataxin acts as an iron chaperone protein to modulate mitochondrial aconitase activity. Science 305: 242–245.
26. McKenzie M (2013) Mitochondrial DNA Mutations and Their Effects on Complex I Biogenesis: Implications for Metabolic Disease. Mitochondrial DNA, Mitochondria, Disease and Stem Cells: Springer. pp. 25–47.
27. Heidari MM, Houshmand M, Hosseinkhani S, Nafissi S, Scheiber-Mojdehkar B, et al. (2009) A novel mitochondrial heteroplasmic C13806A point mutation associated with Iranian Friedreich’s ataxia. Cellular and molecular neurobiology 29: 225–233.
28. van Waveren C, Moraes CT (2008) Transcriptional expression and co-regulation of genes coding for components of the oxidative phosphorylation system. BMC genomics 9: 18.
29. Garbian Y, Ovadia O, Dadon S, Mishmar D (2010) Gene expression patterns of oxidative phosphorylation complex I subunits are organized in clusters. PloS one 5: e9985.
30. Livak KJ, Schmittgen TD (2001) Analysis of Relative Gene Expression Data Using Real-Time Quantitative PCR and the 22DDCT
Method. methods 25: 402– 408.
31. Stuart JM, Segal E, Koller D, Kim SK (2003) A gene-coexpression network for global discovery of conserved genetic modules. Science 302: 249–255. 32. Mootha VK, Lindgren CM, Eriksson K-F, Subramanian A, Sihag S, et al.
(2003) PGC-1a-responsive genes involved in oxidative phosphorylation are coordinately downregulated in human diabetes. Nature genetics 34: 267–273. 33. Balsa E, Marco R, Perales-Clemente E, Szklarczyk R, Calvo E, et al. (2012)
NDUFA4 is a subunit of complex IV of the mammalian electron transport chain. Cell Metabolism 16: 378–386.
34. Chantrel-Groussard K, Geromel V, Puccio H, Koenig M, Munnich A, et al. (2001) Disabled early recruitment of antioxidant defenses in Friedreich’s ataxia. Human molecular genetics 10: 2061–2067.
35. Condo` I, Ventura N, Malisan F, Rufini A, Tomassini B, et al. (2007) In vivo maturation of human frataxin. Human molecular genetics 16: 1534–1540. 36. Pianese L, Turano M, Casale ML, De Biase I, Giacchetti M, et al. (2004) Real
time PCR quantification of frataxin mRNA in the peripheral blood leucocytes of Friedreich ataxia patients and carriers. Journal of Neurology, Neurosurgery & Psychiatry 75: 1061–1063.
37. Koutnikova H, Campuzano V, Foury F, Dolle´ P, Cazzalini O, et al. (1997) Studies of human, mouse and yeast homologues indicate a mitochondrial function for frataxin. Nature genetics 16: 345–351.
38. Puccio H, Kœnig M (2000) Recent advances in the molecular pathogenesis of Friedreich ataxia. Human molecular genetics 9: 887–892.
39. Karthikeyan G, Santos JH, Graziewicz MA, Copeland WC, Isaya G, et al. (2003) Reduction in frataxin causes progressive accumulation of mitochondrial damage. Human molecular genetics 12: 3331–3342.
40. Heidari MM, Houshmand M, Hosseinkhani S, Nafissi S, Khatami M (2009) Complex I and ATP content deficiency in lymphocytes from Friedreich’s ataxia. The Canadian Journal of Neurological Sciences 36: 26–31.
41. Diaz F, Kotarsky H, Fellman V, Moraes CT (2011) Mitochondrial disorders caused by mutations in respiratory chain assembly factors. Seminars in Fetal and Neonatal Medicine 16: 197–204.
42. Tucker EJ, Compton AG, Calvo SE, Thorburn DR (2011) The molecular basis of human complex I deficiency. IUBMB life 63: 669–677.
43. Asin-Cayuela J, Gustafsson CM (2007) Mitochondrial transcription and its regulation in mammalian cells. Trends in biochemical sciences 32: 111–117. 44. King MP, Attardi G (1993) Post-transcriptional regulation of the steady-state