Neutral Evolution following Domestication
Ce´line H. Fre`re1*, Peter J. Prentis1,2, Edward K. Gilding1, Agnieszka M. Mudge1, Alan Cruickshank3, Ian D.
Godwin1
1School of Agriculture and Food Sciences, The University of Queensland, St Lucia, Queensland, Australia, 2Biogeosciences Discipline, Queensland University of Technology, Brisbane, Queensland, Australia,3Agri-Science Queensland, Department of Employment, Economic Development and Innovation, Warwick, Queensland, Australia
Abstract
Detecting artificial selection in the genome of domesticated species can not only shed light on human history but can also be beneficial to future breeding strategies. Evidence for selection has been documented in domesticated species including maize and rice, but few studies have to date detected signals of artificial selection in theSorghum bicolorgenome. Based on evidence that domesticatedS. bicolorand its wild relatives show significant differences in endosperm structure and quality, we sequenced three candidate seed storage protein (kafirin) loci and three candidate starch biosynthesis loci to test whether these genes show non-neutral evolution resulting from the domestication process. We found strong evidence of non-neutral selection at the starch synthase IIa gene, while both starch branching enzyme I and the beta kafirin gene showed weaker evidence of non-neutral selection. We argue that the power to detect consistent signals of non-neutral selection in our dataset is confounded by the absence of low frequency variants at four of the six candidate genes. A future challenge in the detection of positive selection associated with domestication in sorghum is to develop models that can accommodate for skewed frequency spectrums.
Citation:Fre`re CH, Prentis PJ, Gilding EK, Mudge AM, Cruickshank A, et al. (2011) Lack of Low Frequency Variants Masks Patterns of Non-Neutral Evolution following Domestication. PLoS ONE 6(8): e23041. doi:10.1371/journal.pone.0023041
Editor:Gro V. Amdam, Arizona State University, United States of America
ReceivedMarch 22, 2011;AcceptedJuly 5, 2011;PublishedAugust 10, 2011
Copyright:ß2011 Fre`re et al. This is an open-access article distributed under the terms of the Creative Commons Attribution License, which permits unrestricted use, distribution, and reproduction in any medium, provided the original author and source are credited.
Funding:This study was funded by the Pork CRC and the Australian Research Council grant numbers DP0986043 and LP0883808. The funders had no role in study design, data collection and analysis, decision to publish, or preparation of the manuscript.
Competing Interests:The authors have declared that no competing interests exist.
* E-mail: [email protected]
Introduction
Since the release of the seminal book ‘On the origin of species’ [1], there has been much interest in identifying the evolutionary processes underlying crop and animal domestication. Elucidating the origins of domesticated species can not only shed light on human history (e.g. [2,3] but can also benefit future breeding strategies [4]. This is particularly evident when genes can be causally linked to adaptive phenotypes of interest in domesticated species (e.g. quality, pest resistance, drought tolerance, etc.).
Currently, two common approaches are used to find adaptive genes; the first is a top-down approach, and the second is the bottom-up approach [5]. Top-down approaches rely on QTL and LD mapping to isolate candidate genes associated with traits of interest and then use molecular population genetic methods to test for selection. In contrast, the bottom-up approach relies on molecular population genetic methods to identify regions or candidate genes under selection before aiming to link it back to a phenotypic trait. Population genetic theory predicts that intense directional selection (e.g. domestication) will lead to a significant loss of genetic diversity in the genomic region of selection (e.g. [6]). Thus, genes that have undergone selection during domestication should show a significant reduction in genetic diversity [7] and an excess of low frequency polymorphism [8]. Evidence for selection has been greatly documented in maize and rice (e.g. [9,10,11]), but few studies have to date detected signals of selection inSorghum bicolor[12,13].
Sorghum bicoloris a tropical grass that is considered the fifth most important cereal crop providing staple food for more than 500 million people worldwide. Domesticated sorghum has high levels of abiotic stress resistance, for example drought [14], heat [15] and salinity (e.g. [16,17]) tolerance, making it the most important cereal crop in the semiarid zones of Sub-Saharan Africa.Sorghum bicolorwas first domesticated in eastern Africa around 3000 to 6000 years ago [18], before being spread to regions including India (approx. 1500–1000 BC), the Middle East (approx. 900–700 BC) and the Far East (approx. AD 400).
the nutritional value of sorghum flours [22,23,24,25]. Modern breeding programs, however, have focused on selecting for traits including photoperiod insensitivity, reduced height, drought tolerance and pest and disease resistance [26].
Based on the evidence that domesticated S. bicolor and wild relatives show significant differences in endosperm structure, we targeted three candidate seed storage protein (kafirin) loci and three candidate starch loci to test whether these genes show non-neutral evolution resulting from the domestication process. Identifying evolutionary bottlenecks is critical for the future of crop improvements as the maintenance of genetic diversity in crop species prevents genetic vulnerability and provides scope for future improvement [27,28,29]. Here, we present evidence of departures from neutral mutation-drift equilibrium and discuss the challenges associated with measuring positive selection in species character-ized by low genetic diversity and complex demographic histories.
Materials and Methods
Plant Materials and DNA extraction
A total of 35S. bicoloraccessions were sampled for this study (Table 1). These 35 accessions were selected to include a wide range of phenotypic diversity in end-uses (breads, porridges, brewing, animal feed, broomcorns) and endosperm traits, which were measured using near-infrared reflectance spectroscopy. This germplasm was part of the Queensland Government Department of Employment, Economic Development and Innovation Diver-sified Gene Pool program [30]. DNA was extracted using a Qiagen DNeasy Plant Maxi Kit (QIAGENH, Hilden, Germany).
Targeted gene regions
To investigate the selective forces acting on starch biosynthesis and kafirin genes, we targeted three partial gene regions of starch metabolic pathway genes (branching, debranching and starch synthase genes) and three kafirin seed storage protein genes (b–,c– and d–kafirin genes). Using primer information from Hamblin et al. [31], we amplified a 1158 bp fragment of Branching Enzyme I (SBEI, Sb10g030776.1), a 1367 bp fragment of the Debranching Enzyme, pullulanase (PUL1, Sb06g001540.1), and a 1003 bp fragment of Starch Synthase IIa (SSIIa, Sb10g008200.1). Using primer information from Laidlaw et al. [32], we amplified a 785 bp fragment of theb-kafirin gene (bKaf, Sb09g000360.1), a 683 bp fragment of the d–kafirin gene (dKaf, Sb10g013050.1), and a 813 bp fragment of the c–kafirin gene (gKaf, Sb02g025510.1). Additionally, a 955 bp fragment of the ADH1
gene (Sb01g008730.1) was amplified and used as neutral control locus according to the protocol of [33]. Primers and locations of landmarks within the amplicons for the gene models cited are given in Table S1. The PCR products were cleaned using ExoSAP-IT from Affymetrix Inc products (USA, usb.affymetrix.-com). Cycle sequencing was conducted with the BigDyeTM Terminator Cycle Sequencing Ready Reaction kit (Applied Biosystems, Foster City, California). After a MgSO4 clean-up,
the sequencing fragments were run on an ABI 3730 DNA Sequencer (Applied Biosystems, Foster City, California). The sequences were visualised and edited manually using Geneious Pro version 5.0. The sequences have been submitted to GenBank (Submission number 1385804), see Table S2. See Table 1 for details about samples used in this study.
Nucleotide diversity and neutrality tests
The software package DNAsp Version 4.20.2 (http://www.ub. es/dnasp) was used to calculate summary data statistics. We measured the number of polymorphic sites (S), the number of
unique haplotypes (h), nucleotide diversity per-site (Pi (p)), [34], and Watterson’s HW [35]. Median-joining networks [36] were
constructed for each locus separately using polymorphic sites between haplotypes, both with and without indels as a fifth character state in Network program (Ver. 4.516, fluxus-engineer-ing.com).
To detect departures of the site frequency spectrum from neutral expectations we used the following four summary statistics: Tajima’s D [37]; Fay and Wu’sH[38]; and Normalized Fay and Wu’s H and normalized Zeng et al. ‘E test [39]. Each of these tests utilize the frequency spectrum distribution in different ways. Tajima’s [37] D tests whether the frequency of low variants is higher or lower than high frequency variants. Fay and Wu’s [38] H considers the abundance of high frequency relative to intermediate variants. Last, both the normalized Fay and Wu’s
Table 1.Accessions ofSorghum bicolorused in this study.
Sample Name Country of Origin
B9401379-2-1-1-1-W Australia
ETS 2174 Ethiopia
ICSV400 Mali
SC425-14E Sudan
SPV 475 India
SC 49-14E Sudan
SC 62-14E Sudan
KARPER 669 USA
SC725-14E Japan
BUDY Kenya
TAM 422 USA
QL41 Australia
KS115 USA
BTx623 USA
R9188 USA
SC1017-14E Ethiopia
SC1215-13E Niger
SC424-14E Japan
QL12 Australia
SU 2477 Sudan
‘‘BLACK 430’’ USA
SC382-14E Nigeria
B9401379-2-1-1-1-N Australia
Striker Australia
SC798-14E Sudan
A1*9_B004216/R002133 Australia
F9_R007620-2-1 b Australia
BTx3054 USA
F4_B05049-2-4 Australia
F6_R04044-129 Australia
FF_B004214 Australia
IS 8525 Ethiopia
SC165-14E Nigeria
SC265-14E Burkina Faso
IS 25199 Ethiopia
H and the normalized E test allow for contrasting patterns between high and low frequency variants to be taken into account [39]. In order to control for background selection and demogra-phy, the significance of each test statistic described above was determined using DHEW compound test [40]. This test uses the combination of Tajima’sD, Fay and Wu’s normalizedH, and the Ewens–Watterson test of neutrality to detect positive selection. The rejection region for this test was determined through 50,000 coalescent simulations conditional on the observed value ofHW.
We used a nominal threshold ofP= 0.05 in the calculation of this region for each locus.
Finally, we used a polymorphism–divergence-based test, the Hudson–Kreitman–Aguade (HKA) test, to search for candidate genes with reduced levels of polymorphism relative to divergence. We used two outgroups for this test, a close relative (S. propinquum) and a distant relative (Z. mays). Two outgroups were chosen because of the high genetic similarity (99%) betweenS. propinquum
and S. bicolorat many coding genes. This high level of sequence similarity may reduce the power of the HKA test to detect positive
selection. Zea mays was therefore chosen as a second outgroup because it is more divergent and may increase the power of the HKQ test to detect positive selection. The HKA test [41] is one of the most commonly used [42] and has also been shown to be the most powerful test to measure positive selection with simulated data [43]. The HKA test compares patterns of polymorphism and divergence at multiple loci and uses coalescent parameters to estimate mutation rates based on the both the variation within species and divergence between species at a neutral loci. Significant departure from a constant ratio of polymorphisms to divergence among loci indicates a history of selection at the non-neutral gene; e.g. positive selection [43]. The HKA test was conducted using DNAsp Version 4.20.2. The ADH1 gene was used as a neutral control locus for the HKA test. As outgroups we used both a close (S. propinquum) and a distant (Z. mays) relative. Starch sequences fromS. propinquumwere kindly made available by Dr. Hamblin. Starch sequences fromZ. Mays were downloaded from GenBank (SSIIa –AY499410.0, SBEI –AF072724.1, PUL1 – DQ195078.1). Kafirin sequences fromS. propinquum and Z. mays
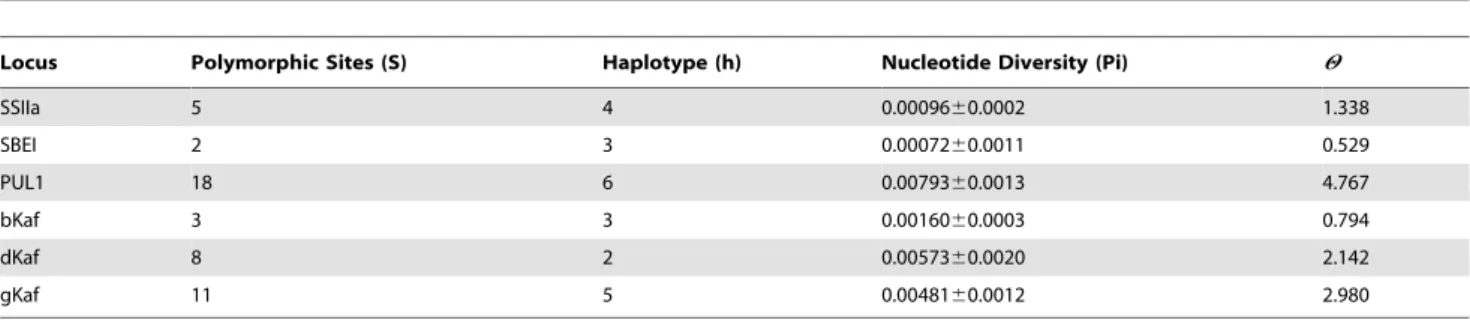
Table 2.Summary statistics of sequence variation at the six candidate loci.
Locus Polymorphic Sites (S) Haplotype (h) Nucleotide Diversity (Pi) H
SSIIa 5 4 0.0009660.0002 1.338
SBEI 2 3 0.0007260.0011 0.529
PUL1 18 6 0.0079360.0013 4.767
bKaf 3 3 0.0016060.0003 0.794
dKaf 8 2 0.0057360.0020 2.142
gKaf 11 5 0.0048160.0012 2.980
This table includes the number of polymorphic sites (S), the number of haplotypes (h), the nucleotide diversity per-site (Pi), and Watterson (HW). doi:10.1371/journal.pone.0023041.t002
Figure 1. Median-joining networks.Red nodes represent high frequency haplotypes. Blue nodes represent intermediate frequency haplotypes. Green nodes represent low frequency haplotypes. And yellow nodes representSorghum propinquum.
were also downloaded from GenBank (S. propinquum: bKaf – GU732406.1, dKaf – GU732412.1, and gKaf – GU732410.1;Z. maysbKaf – EU952800.1, dKaf – EU952615.1, and gKaf – too divergent).
Results
Sequence Diversity
Measures of genetic diversity in the screened accessions (excluding outgroups) were generally high for cultivated sorghum, ranging from 0.72/kbp–7.93/kbp and 0.529/kbp–4.767/kbp for nucleotide diversity (p), and Watterson’s H
W respectively. Two starch biosynthesis genes, SBEI and SSIIa, and one kafirin gene, bKaf, displayed reduced nucleotide diversity compared to the other four genes sequenced (Table 2). The number of polymorphic sites within the kafirin loci varied from 3 to 11, while the number of haplotypes varied from 2 to 5 (Table 2). The number of polymorphic sites within the starch loci varied from 2 to 18, while the number of haplotypes varied from 3 to 6 (Table 2). Across our six candidate loci, we found only three nonsynonymous mutations: one at the bKaf locus and two at the PUL1 locus.
Haplotype Structure and Distribution
The number of haplotypes within the starch loci varied from 3 to 6, while the number of haplotypes within the kafirin loci varied from 2 to 5 (Table 2). The frequency spectrum of different variants for all loci is best displayed in median-joining networks without indels (Figure 1). SSIIa displayed two high frequency haplotypes (44% each) and two low frequency haplotype (6% each). SBEI displayed one high (64%) and two intermediate (20% and 16%) frequency haplotypes. PUL1 displayed two groups of haplotypes. One group contained one high (36%) and two low (10% each) frequency haplotypes and the other contained one intermediate (24%) and two low (10% each) frequency haplotypes. bKaf displayed one high (72%) and two intermediate (16% and 12%) frequency haplotypes. dKaf displayed one high (80%) and one intermediate (20%) frequency haplotypes. Last, gKaf displayed one high (64%), one intermediate (16%) and three low (6.67%) frequency haplotypes.
Tests of Neutral Evolution
We found strong evidence of non-neutral selection at the SSIIa gene with a significant Tajima’s D and normalized E using the DHEW compound test (Table 3). The HKA test for the SSIIa gene showed a significantly decreased number of segregating sites
than expected under neutral conditions with both outgroup species. The SBEI and the bKaf genes showed weaker evidence of non-neutral selection with significant Fay and Wu’s H, normalized H using the DHEW compound test (Table 3). HKA tests for both loci also showed a significant reduction in the number of segregating sites expected under neutral evolution in the domesticated sorghum gene pool, but only with Z. mays as an outgroup. The PUL1 and dKaf genes showed evidence of non-equilibrium evolution using Fay and Wu’s H and normalized H (Table 3). The other two loci gKaf and ADH1 displayed no evidence of either non-neutral or non-equilibrium evolution.
Discussion
The frequency of sequence polymorphism found in this study was consistent with previous studies in domesticated sorghum with one SNP every 82 bp, a value that is within the previously reported range of one SNP every 80–125 bp [13,44]. In contrast, we observed a two-fold increase in the levels of sequence diversity (p) compared to those reported in previous sorghum studies [13,44]. However, the level of sequence diversity at the three targeted starch loci was indistinguishable to the results for the same three genes in a recent study [31]. We deliberately selected a group of accessions with great diversity in endosperm traits and end uses and thus probably drove the high level of sequence diversity.
Consistent lines of evidence of positive selection associated with domestication have been demonstrated in a diverse range of crop species [10,43,45]. In maize, Whitt et al. [11] found evidence of positive selection at three starch pathway loci and Wright et al [46] estimated 2–4% of maize genome had been the target of recent artificial selection. Detecting similar evidence in sorghum has, however, been more problematic [13,44]. In contrast to other studies that have examined evidence for positive selection at starch biosynthesis genes in sorghum, we found relatively consistent evidence of positive selection at the starch synthase IIa gene. In addition, we also found weaker evidence for patterns of non-neutral evolution at both the SBEI and the bKaf loci. Tajima’s D was not significant at these two genes because of the lack of low frequency variants (Figure 1), a pattern previously observed for a number of genes in domesticated sorghum [44]. While both gKaf and PUL1 loci showed presence of low-frequency alleles, Tajima’s D was found non-significant. This is because, both gKaf and PUL1 loci are also characterised by the presence of medium frequency variants, resulting in a non-significant Tajima’s D (Figure 1). Overall our study further supports that the
genome-Table 3.Neutrality tests.
S. propinquum S. propinquum Z. mays
Locus D H normH normE HKA (Obs/Exp SS)
SSIIa 20.72* 0.528 0.468 20.913* 5/10.49*- 4/11.17*
SBEI 0.94 20.146* 20.237* 0.798 2/4.86 2/9.66*
PUL1 1.75 20.900* 20.324* 1.593 18/20.51 17/17.36
bKaf 0.39 23.243* 24.079* 3.639 3/6.07 4/13.7*
dKaf 0.26 25.101* 23.198* 3.052 8/8 9/13.8
gKaf 0.11 20.758 20.368 0.423 21/21.95 NA/NA
Significant departure from neutrality for the Tajima’sD, Fay and Wu’sH, normHand normEwere assessed using the DHEW compound test. For the HKA test, we used ADH1 locus as the neutral locus and the following outgroups:Sorghum propinquumandZea mays. Thec–kafirin gene showed little similarity betweenZ. maysandS. bicolor. As a result, the HKA was not conducted for this particular candidate locus (NA).
wide excess of high-frequency alleles as well as the lack of low-frequency alleles in theS. bicolorgenome may obscure signals of artificial selection. Indeed, Tajima’s D relies on the site-frequency spectrum for detecting selection, and will therefore only be significant when a locus is characterised by the presence of low frequency and high frequency variants.
A confounding factor when detecting directional selection in tests with outgroups is the genetic divergence between the chosen outgroup and the target species at the locus of interest. While recognised as a powerful test to detect evidence of directional selection, the HKA test presented inconsistent results in this study. For example, we found evidence of directional selection at both SBEI and the bKaf loci when maize was the outgroup but not when S. propinquum was the outgroup. We speculate that the genetic similarity between S. propinquum and our samples of S. bicolor (99%) resulted in a lack of power to detect evidence of directional selection. Incorporating sequence information from multitude individuals of more distantly related wild sorghum species may help address this problem. The incorporation of multiple outgroup samples would be particularly important when conducting linkage disequilibrium analyses.
The difficulty in detecting selection at candidate gene loci in cultivated sorghum has been reported previously [44]. Ancestral population structure, a recent domestication bottleneck, subse-quent expansions to new areas, founder effects in new areas and varieties, and introgression from wild relatives have all been suggested as possible complicating factors precluding the detection of selection in sorghum [13,44]. The pattern of diversity to divergence and frequency spectrum of segregating sites in our study also confirm strong departures from a simple equilibrium model of evolution. The use of the DHEW compound test [40] helped in the detection of positive selection at candidate loci in this
study. This compound test helps control for the confounding effects of complex demographic histories and population structure while detecting departures from neutral evolution at specific loci [47]. While, the identification of artificial selection in theS. bicolor
genome has been difficult, we believe that the use of the DHEW compound test and more sophisticated future tests will allow more precise detection of artificial selection of crop genomes. These methodological advances combined with full genome resequencing of wild and domesticated sorghum genotypes will illuminate the effects of artificial selection on theS. bicolorgenome.
Supporting Information
Table S1 Primers and locations of landmarks within the amplicons for the gene models.
(DOC)
Table S2 Haplotype identity for each accessions of Sorghum bicolor used in this study for each gene referred to in GenBank (Submission number 1385804).
(DOC)
Acknowledgments
We wish to thank Martha Hamblin for kindly making available sequence data from Sorghum propinquum. We also want to thank John Black for comments on an earlier version of this manuscript.
Author Contributions
Conceived and designed the experiments: CHF PJP IDG. Performed the experiments: CHF AMM. Analyzed the data: CHF PJP. Contributed reagents/materials/analysis tools: AC AMM EKG IDG. Wrote the paper: CHF PJP.
References
1. Darwin C (1859) On the origin of Species. London: Murray.
2. Larson G, Lui R, Zhao X, Yuan J, Fuller D, et al. (2010) Patterns of East Asian pig domestication, migration, and turnover revealed by modern and ancient DNA. Proc Natl Acad Sci U S A 107: 7686–7691.
3. Yi P, Shi H, Qi XB, Xiao CJ, Zhong H, et al. (2010) The ADH1B Arg47His polymorphism in East Asian populations and expansion of rice domestication in history. BMC Evol Biol. 10 p.
4. McCouch S (2004) Diversifying slection in plant breeding. PLoS Biology 2: e347.
5. Ross-Ibarra J, Morrell PL, Gaut BS (2007) Plant domestication, a unique opportunity to identify the genetic basis of adaptation. Proc Natl Acad Sci U S A 104: 8641–8648.
6. Buckler ES, Thornsberry JM, Kresovich S (2001) Molecular diversity, structure, and domestication of grasses. Gen Res 77: 213–218.
7. Guo J, Wang Y, Song C, Zhou J, Qiu L, et al. (2010) A single origin and moderate bottleneck during domestication of soybean (Glycine max): implications from microsatellites and nucleotide sequences. An Bot 106: 505–514. 8. Prezeworski M (2002) The signature of positive selection at randomly chosen
loci. Genetics 160: 1179–1189.
9. Li C, Zhou A, Sang T (2006) Rice domestication by reducing shattering. Science 311: 1936–1939.
10. Sigmon B, Vollbrecht E (2010) Evidence of selection at the ramosa1 locus during maize domestication. Mol Ecol 19: 1296–1311.
11. Whitt SR, Wilson LM, Tenaillon MI, Gaut BS, Buckler ES (2002) Genetic diversity ad selection in the maize starch pathway. Proc Natl Acad Sci U S A 99: 12959–12962.
12. Casa AM, Mitchell SE, Jensen JD, Hamblin MT, Paterson AH, et al. (2006) Evidence for a selective sweep on chromosome 1 of cultivated sorghum. Plant Gen 46: S27–S40.
13. de Alencar Figueiredo LF, Calatayud C, Dupuits C, Billot C, Rami J-F, et al. (2008) Phylogeographic Evidence of Crop Neodiversity in Sorghum. Genetics 179. 14. Tao YZ, Henzell RG, Jordan DR, Butler DG, Kelly AM, et al. (2000) Identification of genomic regions associated with stay green in sorghum by testing RILs in multiple environments. Theo App Gen 100: 1225–1232. 15. Howarth CJ, Skot KP (1994) Detailed characterization of heat-shock
protein-synthsis and induced themotolerance in seedlings of sorghum bicolor. J Exp Bot 45: 1353–1363.
16. Heidari M (2009) Antioxidant activity and osmolyte concentrarion of Sorghum (Sorghum bicolor) and Wheat (Triticum aestivum) genotypes under salinity stress. A J Pl Sci 8: 240–244.
17. Marambe B, Ando T (1995) Physiologicl basis of salinity tolerance of sorghum seeds during germination. J Agro Cp Sci 174: 291–296.
18. Smith CW, Frederiksen RA (2000) Sorghum: origin, history, technology, and production. New York: John Wiley and Sons.
19. House LR (1985) International Crops Research Institute for the Semi-Arid tropics. A guide to sorghum breeding. 2nd edn ed. Patancheru, India. 206 p. 20. Shapter FM, Lee LS, Henry R (2008) Endosperm and starch granule
morphology in wild cereal relatives. Pl Gen Res 6: 85–97.
21. Dillon SL, Shapter FM, Henry R, Cordeiro G, Izquierdo L, et al. (2007) Domestication to Crop Improvement: Genetic Resources for Sorghum and Saccharum (Andropogoneae). An Bot 100: 975–989.
22. Lindeboom N, Chang PR, Tyler RT (2004) Analytical, biochemical and physicochemical aspects of starch granule size, with emphasis on small granule starches: a review. Starch - Starke 56: 89–99.
23. Serna-Saldivar S, Rooney L (1995) Structure and chemistry of sorghum and millets. In: Dendy DAV, ed. Sorghum and millets, chemistry and technology. St PaulMN: American Association of Cereal Chemists. pp 69–124.
24. Chandrashekar A, Kirleis AW (1988) Influence of protein on starch gelatinization in sorghum. Cer Chem 65: 457–462.
25. Zhang G, Hamaker BR (1998) Lowa-amylase starch digestibility of cooked sorghum flours and the effect of protein. Cer Chem 75: 710–713.
26. Reddy BBS, Ramesh S, Reddy PS (2006) Sorghum genetic resources, cytogenetics and improvement. In: Singh RJ, Jauhar PP, eds. Genetic resources, chromosome engineering, and crop improvement. Boca RatonFL: CRC Taylor and Francis. pp 309–363.
27. Tang H, Sezen U, Paterson AH (2010) Domestication and plant genomes. Cur Op Pl Biol 13: 160–166.
28. Tanksley SD, McCouch S (1997) Seed banks and molecular maps: unlocking the genetic potential form the wild. Science 277: 1063–1066.
29. Jordan DR, Tao YZ, Godwin ID, Henzell RG, Cooper M, et al. (1988) Loss of genetic diversity associated with selectioin for resistance to sorghum midge in Australian Sorghum. Euphytica 102: 1–7.
31. Hamblin MT, Salas Fernandez MG, Tuinstra R, Rooney LW, Kresovich S (2007) Sequence variation at candidate loci in the starch metabolism pathway in Sorghum: Prospects for linkage disequilibrium mapping. Pl Gen. 46 p. 32. Laidlaw HKC, Mace ES, Williams SB, Sakrewski K, Mudge AM, et al. (2010)
Allelic variation of theb–,c– andd– kafirin genes in diverseSorghumgenotypes. Theo App Gen 121: 1227–1237.
33. Dillon SL, Lawrence PK, Henry R, Price HJ (2007)Sorghumresolved as a distinct genus based on combined ITS1, ndhF and Adh1 analyses. Pl Sys Evol 268: 29–43.
34. Nei M (1987) Molecular Evolutionary Genetics. New York: Columbia University Press.
35. Watterson GA (1975) On the number of segregating sites in geneticalmodels without recombination. Theo Pop Biol 7: 256–76.
36. Bandelt HJ, Forster P, Ra˜hl A (1999) Median-joining networks for inferring intraspecific phylogenies. Mol Biol Evol 16: 37–48.
37. Tajima F (1989) Statistical method for testing the neutral mutationhypothesis by DNA polymorphism. Genetics 123.
38. Fay JC, Wu CI (2000) Hitchhiking under positive darwinian selection. Genetics 155.
39. Zeng K, Fu Y-X, Shi S, Wu C-I (2006) Statistical Tests for Detecting Positive Selection by Utilizing High-Frequency Variants. Genetics 174: 1431–1439.
40. Zeng K, Shi S, Wu C-I (2007) Compound Tests for the Detection of Hitchhiking Under Positive Selection. Mol Biol Evol 24: 1898–1908.
41. Hudson RR, Kreitman M (1987) A test of neutral molecularevolution based on nucleotide data. Genetics 116: 153–159.
42. Prada D (2009) Molecular population genetics and agronomic alleles in seed banks: searching for a needle in a haystack? J Exp Bot 60: 2541–2552. 43. Zhai W, Nielsen R, Slatkin M (2009) An Investigation of the Statistical Power of
Neutrality Tests Based on Comparative and Population Genetic Data. Mol Biol Evol 26: 273–283.
44. Hamblin MT, Casa AM, Sun H, Murray SC, Paterson AH, et al. (2006) Challenges of detecting directional selection aft er a bottleneck: Lessons from
Sorghum bicolor. Genetics 173: 953–964.
45. Blackman JK, L. SJ, Raduski AR, Michaels SD, Rieseberg LH (2010) The Role of Recently Derived FT Paralogs in Sunflower Domestication. Cur Biol 20: 629–635.
46. Wright SI, Bi IV, Schroeder SG, Yamasaki M, Doebley JF, et al. (2005) The Effects of Artificial Selection on the Maize Genome. Science 308: 1310–1314. 47. Eckert AJ, Liechty JD, Tearse BR, Pande B, Neale DB (2010) DnaSAM: