R E S E A R C H A R T I C L E
Open Access
Reference genes for quantitative reverse
transcription-polymerase chain reaction
expression studies in wild and cultivated peanut
Carolina V Morgante
1,2, Patricia M Guimarães
1, Andressa CQ Martins
1,3, Ana CG Araújo
1, Soraya CM Leal-Bertioli
1,
David J Bertioli
3,4and Ana CM Brasileiro
1*Abstract
Background:Wild peanut species (Arachisspp.) are a rich source of new alleles for peanut improvement. Plant transcriptome analysis under specific experimental conditions helps the understanding of cellular processes related, for instance, to development, stress response, and crop yield. The validation of these studies has been generally accomplished by quantitative reverse transcription-polymerase chain reaction (qRT-PCR) which requires
normalization of mRNA levels among samples. This can be achieved by comparing the expression ratio between a gene of interest and a reference gene which is constitutively expressed. Nowadays there is a lack of appropriate reference genes for both wild and cultivatedArachis. The identification of such genes would allow a consistent analysis of qRT-PCR data and speed up candidate gene validation in peanut.
Results:A set of ten reference genes were analyzed in fourArachisspecies (A. magna;A. duranensis; A.
stenospermaandA. hypogaea) subjected to biotic (root-knot nematode and leaf spot fungus) and abiotic (drought) stresses, in two distinct plant organs (roots and leaves). By the use of three programs (GeNorm, NormFinder and BestKeeper) and taking into account the entire dataset, five of these ten genes,ACT1(actin depolymerizing factor-like protein),UBI1(polyubiquitin),GAPDH(glyceraldehyde-3-phosphate dehydrogenase),60S(60S ribosomal protein L10) andUBI2(ubiquitin/ribosomal protein S27a) emerged as top reference genes, with their stability varying in eight subsets. The former three genes were the most stable across all species, organs and treatments studied. Conclusions:This first in-depth study of reference genes validation in wildArachisspecies will allow the use of specific combinations of secure and stable reference genes in qRT-PCR assays. The use of these appropriate references characterized here should improve the accuracy and reliability of gene expression analysis in both wild and cultivated Arachis and contribute for the better understanding of gene expression in, for instance, stress tolerance/resistance mechanisms in plants.
Background
Cultivated peanut (Arachis hypogaea) is one of the most widely grown grain legumes in the world, thanks to its high protein and unsaturated oil contents [1]. It is grown extensively in Asia, Africa, United States and Latin America, but is subject to attacks from various pests and diseases, necessitating substantial pesticide use. By contrast, wildArachisspecies, which are exclu-sively South American in origin, are a rich source of
new alleles for peanut improvement, with sufficient polymorphism for their genetic characterization [2-4]. Basic resources for gene discovery, interpretation of genomic sequences and marker development have been developed for a number of wild Arachis species [5-7], and constitute important tools for the analysis of the complexities of gene expression patterns and functions of transcripts in Arachis. Additionally, recent research has identified a number of stress responsive genes from wild and cultivated Arachis. These genes, generated by several research groups, are candidate disease resistance and drought tolerance genes and need further analysis to be validated [2,7-12]. The use of a common set of
* Correspondence: [email protected] 1
EMBRAPA Recursos Genéticos e Biotecnologia. Parque Estação Biológica, CP 02372. Final W5 Norte, Brasília, DF - Brazil
Full list of author information is available at the end of the article
standards would help in the comparison of research results generated in different labs.
Quantitative reverse transcription-polymerase chain reaction (qRT-PCR) is currently the most sensitive techni-que for quantification of low abundance transcripts, and at the same time is suitable for abundant transcripts. For these reasons, and because of relative ease of use, qRT-PCR has become widely preferred to classic transcriptome analysis tools, such as Northern blotting, semi-quantitative RT-PCR, micro and macroarrays, RNase protection analy-sis, andin situhybridization [13,14]. qRT-PCR technology can be either used to quantify with extremely high sensi-tivity the input copy number of a particular transcript (absolute quantification) or to measure the change in expression of a target gene relative to a reference gene (relative quantification). By far, the latter is the analytic method of choice for the majority of gene expression studies as it is usually unnecessary to know the absolute transcript copy number. The method continues to be improved, with recent developments enabling qRT-PCR reactions to be performed at lower reagents cost, less hands-on time and with higher throughput than pre-viously possible [15,16].
Nevertheless, in spite of these advantages there are a number of variables that strongly interfere with the accu-racy and reliability of qRT-PCR. These include initial sam-ple amount, RNA recovery, RNA integrity, efficiency of cDNA synthesis, and differences in the overall transcrip-tional activity of the tissues or cells analyzed [17,18]. The effect of all of these variables can be largely corrected for by the normalization of mRNA levels among samples. Different approaches have been proposed for the normali-zation of expression level measurements, but it is generally done by using an internal ‘reference gene’, under the assumption that this has a constant level of expression in the chosen tissue, is not affected by the treatment, and has no inter-individual variability [14,17-19].
Reference control genes have been identified for several plant species [15,16,20-26]. However, a number of studies reported that some of the most common internal control genes such asb-actin, glyceraldehyde-3-phosphate dehy-drogenase (GAPDH), 18S or 26S ribosomal RNA anda -tubulin were expressed irregularly and unsteadily in some experiments, questioning the concept of an ideal, universal internal control gene [19,27,28]. In fact, it is now a con-sensus that it is almost impossible to obtain only one invariable gene, and that multiple internal control genes must be evaluated and utilized to quantify gene expres-sion, in order to improve the accuracy of a qRT-PCR ana-lysis and interpretation [15,22,29].
Recently, reference genes for qRT-PCR have been ana-lyzed on a set of five tissues (full pod; mature seed; leaf; gynophores; and root) of cultivated peanut (A. hypogaea) showing some intra- and inter-tissue variation in gene
stability [30]. Ten generally used housekeeping primers for reference genes were designed for peanut and analyzed by GeNorm and NormFinder programs. Alcohol dehydrogen-ase (ADH3) showed to be the most stably expressed gene across samples, followed by 60S ribosomal protein L7 (60S) and yellow leaf specific 8 (YLS8) [30]. However, to date, no endogenous control genes have been identified for other Arachisspecies, including the wild relatives which constitute a source of resistances to biotic and environmental constraints. In the present work, a simpli-fied qRT-PCR protocol based on SYBR reagent was used for the identification of genes with minimal expression variation in fourArachisspecies (A. magna;A. duranensis;
A. stenosperma and A. hypogaea) subjected to biotic
(Meloidogyne arenaria,Cercosporidium personatum) and abiotic (drought) stresses in roots and leaves. For that, we used our ESTs databank of wildArachis[7] to survey for potential internal control genes and three distinct pro-grams (GeNorm, NormFinder, and BestKeeper) for their evaluation. Our data show that the combined use of these new internal control genes for normalization of target gene expression in qRT-PCR improves the accuracy and reliability of the analysis of gene expression in different species of the genusArachisunder different stresses.
Methods
Plant materials and bioassays
Arachis stenosperma (accession V10309), A. magna
(accession KG30097),A. duranensis(accession K7988),
andA. hypogaea (cultivar IAC- Tatu - ST) seeds were
obtained from the Active Germplasm Bank at Embrapa Genetic Resources and Biotechnology-Cenargen (Brasília, Brazil). Plants were kept in open plan greenhouse and treatments were imposed at the 30-leaf stage. For the leaf spot fungi (C. personatum) bioassays, ten plants of each, the resistant (A. stenosperma) and susceptible genotypes (A. duranensisandA. hypogaea), were inoculated with a of 50,000 spores/mL suspension diluted in Tween 20, as previously described [31]. Leaves and roots were col-lected from inoculated and non-inoculated plants 72 hours after inoculation (HAI). For nematode challenge, ten plants of nematode-resistantA. stenospermaand the susceptible cultivatedA. hypogaeawere inoculated with 10,000 root-knot nematodeM. arenariarace 1 juveniles (J2), as previously described [32,33]. Roots from chal-lenged and non-chalchal-lenged plants were collected nine days after inoculation (DAI). For abiotic stress assays, ten plants of drought tolerant speciesA. magnaandA.
dura-nensiswere subjected to gradual water deficit in soil
RNA purification and cDNA synthesis
Collected leaves and roots from stressed and control plants were immediately frozen in liquid nitrogen and stored at -80°C. Total RNA was extracted from 250 mg of plant material using a modified lithium chloride pro-tocol [35] with an additional RNA precipitation step (3M sodium acetate and ethanol 96%), followed by puri-fication on Invisorb Spin Plant RNA Mini columns (Invitek, Berlin, Germany) to eliminate impurities. RNA integrity was checked by gel electrophoresis. Total RNA was quantified at 260 nm using the NanoDrop® ND-1000 spectrophotometer (Thermo Scientific, Waltham, USA) and its purity confirmed as a 260/280 nm ratio above 1.8. Each sample contained 2 μg of total RNA and comprised a pool of equal RNA quantities of all individuals collected at the same point.
Thus, a total of 24 samples was examined in this study, representing the three stress conditions tested: (i) Fungus bioassay: three species (A. stenosperma,A.
dura-nensis and A. hypogaea); two plant organs (roots and
leaves) and two treatments (inoculated and non-inocu-lated); total of 12 samples; (ii) Nematode bioassay: two species (A. stenosperma andA. hypogaea); one plant organ (roots) and two treatments (inoculated and non-inoculated); total of four samples; and (iii) Drought stress: two species (A. duranensis andA. magna); two plant organs (roots and leaves) and two treatments (stressed and non-stressed); total of eight samples.
After sampling, DNAse treatment and cDNA synth-esis were carried out in subsequent steps, in the same tube. Genomic DNA contaminants were removed from total RNA by treatment with DNase (TURBO DNA-free™, Ambion, USA), according to the manufacturer’s instruction, followed by first strand cDNA synthesis performed at 42°C for 60 min on a Master Cycler ther-mocycler (Eppendorf AG, Hamburg, Germany) using SuperScriptTM II RT and Anchored Oligo(dT)20 pri-mer (Invitrogen, Carlsbad, CA, USA), according to the manufacturer’s instruction. Both enzymes (DNase and Reverse Transcriptase) were heat inactivated in the tube and the resulted cDNA was directly used in qRT-PCR assays.
DNA contamination in cDNA samples was checked by RT-PCR using a pair of conserved primers flanking an
intron region in Arachis (Leg066Fwd-5’
AGCTC-CACCTCTTTCCGACAGA3’and Leg066Rev-5’AGTTT
CTACAGCACGTATCCTTTCC3’), as previously
described [5,36], which allows the distinction between PCR products amplified from genomic DNA and cDNA templates.
PCR primer design
Ten Arachis candidate genes were selected based on
their previous description as good plant internal control
genes for qRT-PCR analysis in a number of species [21,22,24,25,28]. Nine of these selected genes were retrieved from our wildArachisEST libraries (A. magna
and A. stenosperma) and from A. hypogaea database
available at GenBank (Table 1), whilst UBI2 was
included as it was previously used as a reference gene in
A. hypogaea gene expression qRT-PCR analysis [10].
Amplification primers for qRT-PCR were designed with Primer3Plus software [37], using the following para-meters: amplicon length between 150 and 200 bp; size between 19 and 22 bp; melting temperature (Tm) between 59 and 61°C; GC content between 40 and 55%. Amplicon length of selected primers was checked by RT-PCR using as template an equimolar pool of all 24 samples, according to the parameters described above.
Real-Time PCR conditions
Real-time reactions used Platinum®
SYBR®
Green qPCR Super Mix-UDG w/ROX kit (Invitrogen, Carlsbad, CA, USA) as follows: 2μL of cDNA diluted 10 times, 5μL of the mix and 0.2μM of each primer, in a final volume of 10 μL. Reactions were carried out using three independent technical replicates for each sample and, to certify the absence of genomic DNA in RNA samples, NAC (No Amplification Control) was carried out using total RNA as reaction template. The StepOne system (Applied Biosys-tems) was used and PCR cycling consisted of four steps: 50°C for 2 min, 95°C for 10 min, 40 cycles of 95°C for 15 s and 60°C for 1 min, and a final dissociation curve step of 95°C for 15 s, 60°C for 60 s, and 95°C for 15 s. The amplifi-cation efficiencies and correlation coefficients R2values were calculated by standard curve method using as a tem-plate an equimolar pool of all samples. Two independent biological replicates for each of the 24 samples were used for real-time PCR analysis, with each replicate representing a pool of five plants.
Result analysis
NormFinder software is based on a variance estimation approach and also calculates an expression stability value (M) for each gene analyzed. It enables estimation of the overall variation of the reference normalization genes and the variation between subgroups of the sample set, taking into account intra and intergroup variations for normalization factor (NF) calculations. BestKeeper pro-gram indicates the best reference gene by the pairwise correlation analysis of all pairs of candidate genes and calculates the geometric mean of the best suited ones. Reference genes with standard deviation (SD) values greater than 1 are considered by BestKeeper as inconsis-tent and should be excluded.
For reference gene validation, statistical analyses between Cq values were performed with R software 2.12.0 http://www.r-project.org and REST software was used for relative expression profile and the linear regression ana-lyses [39].
Results and discussion RNA quality and cDNA synthesis
A set of 24 pooled samples including two different tissues (root and leaves) of four Arachisspecies submitted to three different stresses was used to analyze the expres-sion stability of ten candidate genes for normalization of
qRT-PCR. Total RNA extracted from wildArachis spe-cies was highly viscous, suggesting contamination with polysaccharides and/or other polymers. Therefore, the use of a modified LiCl protocol [35] and an additional column purification step were required to produce good yields of intact and good quality RNA.
Performing the DNase treatment and cDNA synthesis in the same tube produced a higher yield of cDNA of improved quality for qRT-PCR reactions and reduced the loss of RNA or cDNA during the precipitation and washing steps, being a viable alternative for materials with limited amounts of initial RNA. This procedure also generated cDNA samples without genomic DNA contamination.
Analysis of Cq variability and PCR efficiency
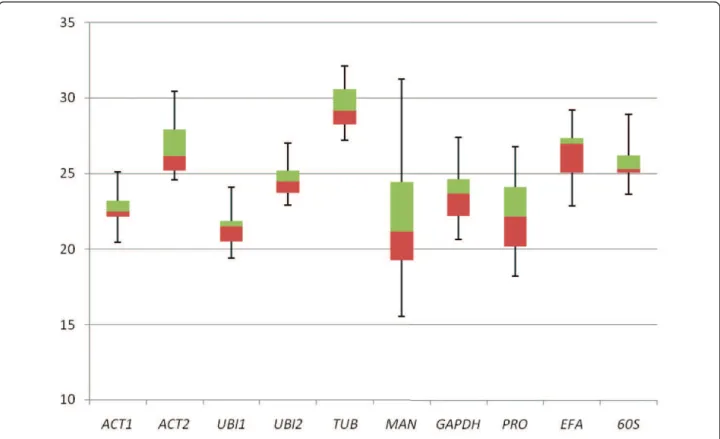
The expression level of the genes tested differed and, in qRT-PCR, they reached fixed thresholds at medians Cq values ranging from 21 to 29, with most lying between
22 and 26 (Figure 1). UBI1 andMAN were the most
expressed genes and TUB the least. Standard curves were generated for each pair of primers using an equi-molar pool of all cDNA samples in ten-fold serial dilu-tions. No amplification was detected in the absence of template. The amplification efficiency of the reactions
Table 1 Genes and primers used for qRT-PCR analysis
Gene Abbreviation
Arachis
species
GenBank ID
Gene description Primer sequence Forward/ Reverse
Amplicon size (bp)
PCR efficiency (%)
Regression coefficient R2
60S A.
stenosperma
EH042095.1 60S ribosomal protein L10
TGGAGTGAGAGGTGCATTTG/ TCTTTTGACGACCAGGGAAC
155 99.872 0.994
ACT1 A. magna Not
available Actin depolymerizing factor-like protein
TGGTCTCGGTTTCCTGAGTT/ AATACCACTCCAAAGCAAACG
114 98.330 1.000
ACT2 A. hypogaea GO326795.1 Actin GAGCTGAAAGATTCCGATGC/
GCAATGCCTGGGAACATAGT
178 108.360 0.994
EFA A.
stenosperma
EH046450.1 Chloroplast elongation factor tub
CGATGTCACTGGCAAGGTTA/ TAGCGAACCTCATTCCCTGT
137 101.936 1.000
GAPDH A. magna Not
available
Glyceraldehyde-3-phosphate dehydrogenase
CAACAACGGAGACATCAACG/ ATCACTGCCACCCAGAAAAC
190 91.802 0.958
MAN A.
stenosperma
EH048114.1 Mannose/glucose-binding
lectin
ATTAAATCCGCTGCAACCAC/ AATCCAACCATACCCCATTC
185 92.192 1.000
PRO A.
stenosperma
EH047960.1 Proline-rich protein precursor
GCACCCAATTGAAAAACCAC/ GAGGGTACTTGCCATGAGGA
185 90.180 1.000
TUB A.
stenosperma
EH047237.1 Beta-tubulin AGTCAGGTGCGGGTAACAAC/ CCAGTACCACCTCCCAAAGA
151 97.668 1.000
UBI1 A.
stenosperma
EH047293.1 Polyubiquitin TCTTGTCCTCCGTCTTAGGG/ AGCAAGGGTCCTTCCATCTT
196 99.997 0.999
UBI2* A. hypogaea HO115753.1 Ubiquitin/ ribosomal protein S27a
AAGCCGAAGAAGATCAAGCAC/ GGTTAGCCATGAAGGTTCCAG
145 99.218 0.999
was estimated based on the calculated slopes of the curves, which ranged from 90.2 to 108.4%, with the cor-relation coefficients R2 varying from 0.958 to 1.000 (Table 1), both within the range expected for a qPCR reaction [40]. For all genes analyzed, single peaked melt-ing curves were generated (Additional file 1), indicatmelt-ing the presence of a specific amplicon and the absence of primer-dimer formation. The values of primer pair effi-ciencies were used in subsequent qRT-PCR analysis.
Expression stability of candidate genes
In order to evaluate the stability of the selected candidate reference genes, the level of transcript accumulation of the samples was verified with respect to biotic and abiotic stress, roots and leaves and fourArachisspecies (A.
dura-nensis, A. stenosperma, A. magna, andA. hypogaea). The
data was analyzed considering all samples together and in separate groups (organs, type of stress and species). The expression stability of the ten candidate genes was evalu-ated by three different softwares: GeNorm, NormFinder, and BestKeeper enabling a more comprehensive analysis of the gene expression data.
Taking into account the entire dataset, for all species, organs and stresses, ACT1andUBI1 (M = 0.553) were the most stable genes by GeNorm analysis (Table 2).
Among the selected genes, only MAN did not reach
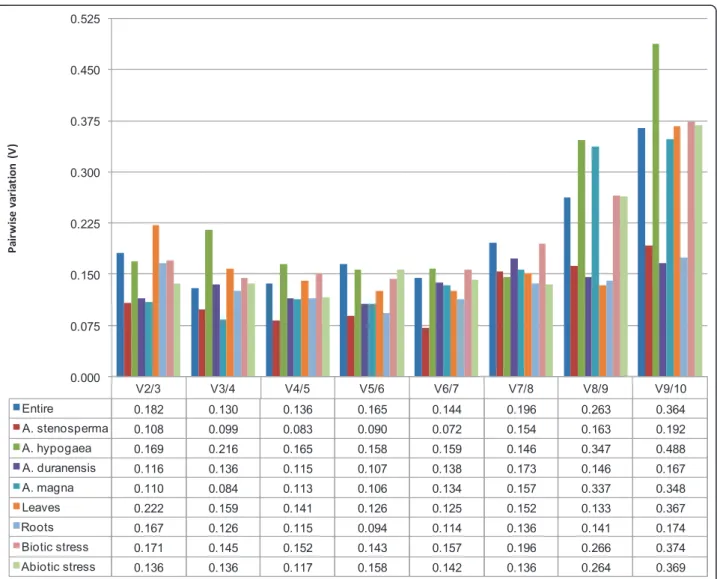
high expression stability (M = 1.865), with M value above the default limit of M = 1.5 [29] (Additional files 2 and 3). The pairwise variation V3/4 value (0.130) for the entire dataset was smaller than the recommended cutoff value of 0.150 (Figure 2), below which the inclu-sion of an additional reference gene is not required [29]. It indicates that the top three ranked genes (ACT1,
UBI1, and UBI2) in GeNorm software should be used
for qRT-PCR normalization (Figure 2; Additional files 2 and 3). BestKeeper program also indicatedACT1(SD = 0.871) as the gene with the most stable expression (Table 2). On the other hand, six out of the ten genes
analyzed (EFA, TUB, GAPDH,ACT2, MAN, and PRO)
showed SD values higher than 1, which is an indication that these genes have an unstable expression, according to BestKeeper software (Additional file 3) [38]. Norm-Finder software highlighted GAPDHas the best refer-ence gene (M = 0.056), and ranked UBI1(M = 0.090) and ACT1 (M = 0.118) in the second and third posi-tions, respectively (Table 2; Additional file 3).
The only previous work that assessed reference genes for qRT-PCR inArachis [30] analyzed exclusively the cultivated A. hypogaeaspecies in five tissues, including roots and leaves. Overall, taking into account all tissues
and treatments, this study concluded that ADH3, 60S andYLS8were the most appropriate reference genes in expression analysis involving seed development. How-ever, in contrast with our analysis, the previously
mentioned study [30] considered ubiquitin as an unstable gene that should be avoided in expression stu-dies. A possible reason for this apparently contradictory result is the difference on set composition between the
V2/3 V3/4 V4/5 V5/6 V6/7 V7/8 V8/9 V9/10
Entire 0.182 0.130 0.136 0.165 0.144 0.196 0.263 0.364
A. stenosperma 0.108 0.099 0.083 0.090 0.072 0.154 0.163 0.192
A. hypogaea 0.169 0.216 0.165 0.158 0.159 0.146 0.347 0.488
A. duranensis 0.116 0.136 0.115 0.107 0.138 0.173 0.146 0.167
A. magna 0.110 0.084 0.113 0.106 0.134 0.157 0.337 0.348
Leaves 0.222 0.159 0.141 0.126 0.125 0.152 0.133 0.367
Roots 0.167 0.126 0.115 0.094 0.114 0.136 0.141 0.174
Biotic stress 0.171 0.145 0.152 0.143 0.157 0.196 0.266 0.374
Abiotic stress 0.136 0.136 0.117 0.158 0.142 0.136 0.264 0.369
0.000 0.075 0.150 0.225 0.300 0.375 0.450 0.525
P
a
ir
w
ise
v
a
ria
tio
n
(
V
)
Figure 2Pairwise variation of candidate genes as predicted by GeNorm. Pairwise variation of the ten candidate genes as predicted by GeNorm. The pairwise variation (Vn/Vn+1) was calculated between the normalization factors NFn and NFn+1, with a recommended cutoff threshold of 0.150.
Table 2 Optimal reference genes for quantification of the entire dataset and individual (species, organs or stress) subsets
Program Entire Subsets
Species Organ Stress
A. stenosperma
A. hypogaea A.
duranensis
A. magna Leaves Roots Biotic stress Abiotic
stress
GeNorm (M)
ACT1/UBI1
(0.553)
ACT1/60S
(0.269)
ACT1/UBI1
(0.535)
ACT1/UBI2
(0.350)
UBI2/60S
(0.242)
ACT1/UBI1
(0.483)
UBI2/60S
(0.492)
ACT1/60S
(0.549)
UBI2/60S
(0.376)
NormFinder (M)
GAPDH
(0.056)
ACT1
(0.062)
60S
(0.045)
60S
(0.057)
ACT2/PRO
(0.013)
ACT1(0.090) GAPDH
(0.063)
GAPDH
(0.076)
GAPDH
(0.091)
BestKeeper (SD)
ACT1(0.871) 60S
(0.284)
UBI2
(0.661)
EFA
(0.677)
UBI1(0.623) UBI2(0.603) ACT1(0.524) ACT1
(0.945)
UBI1
(0.464)
two studies which included different species, treatments and tissues. Our study focused on other species and treatments, and therefore is complementary to Brand and Hovav [30]. This reinforces the need of detailed reference gene analysis for specific plant species, experi-mental conditions and tissues and also corroborates the general belief that is essential to apply different refer-ence genes for a more accurate and reliable normaliza-tion [15,22,29].
Species subsets
Considering each species separately (species subsets),
GeNorm and NormFinder also pointed outACT1(M =
0.269 and 0.062, respectively) as the best reference gene for A. stenosperma(Table 2). All the ten genes had an M value below the GeNorm 1.5 threshold of for this species (Addi-tional files 2 and 3). The pairwise variation V2/3 value (0.108) indicated the use of the two top ranked genes (ACT1and60S) for normalization (Figure 2; Table 2). BestKeeper rankedACT1in the second position (SD = 0.343), and60Sin the first position (SD = 0.284). This result is quite similar to that obtained by GeNorm, which rankedACT1and60Sin the first position.EFA,MAN, and PROshowed BestKeeper SD values higher than 1 (Addi-tional file 3). Altogether, the three statistical analyses pointedACT1and60Sas the best reference genes for
A. stenospermaqRT-PCR normalization (Table 2). These
results are in accordance to our previous work withA.
ste-nospermaroots using macroarray analysis [8] in which
actin and60Swere also successfully used as reference genes. GAPDH and b-tubulin, which previously also showed no significant variation on their expression, are here ranked in the third (M = 0.106) and fourth (M = 0.125) position, respectively, by NormFinder analysis (Additional file 3).
ForA. hypogaea, GeNorm program indicatedACT1and
UBI1 as the most stable candidate genes (M = 0.535), whereasPRO,EFA, andMANdid not reach high expres-sion stability (M > 1.5) (Table 2; Additional files 2 and 3). The pairwise variation V7/8 value (0.146) suggested the use of seven genes for normalization (Figure 2). ACT1 occupies the second position of the BestKeeper ranking (SD = 0.724), andUBI2, the first position (SD = 0.661) (Additional file 3). As for GeNorm, BestKeeper analysis
considers thatPRO,EFA, andMAN showed unstable
expression (SD values higher than 1), as well asACT2,
GAPDHandTUB. NormFinder, differently from the other
programs, ranked60Sas the best reference gene (M = 0.045),UBI2andUBI1in the fifth (M = 0.107) and sixth (M = 0.121) positions, respectively, andACT1only in the eighth position (M = 0.197) (Additional file 3). In agree-ment with this result, Brand and Hovav [30] also
consid-ered60S, combined withADH3andYLS8, as collectively
the most stable reference genes for qRT-PCR on five
different A. hypogaea tissues, using the GeNorm and NormFinder programs. Moreover, previous studies have successfully used ubiquitin as internal reference gene for normalization of real-time data [10,11], and the elongation factor as reference gene for normalizing the transcript pro-files of genes expressed following root-knot nematode exposure inA. hypogaea[12].
No consensus between programs was obtained forA.
duranensis. ACT1/UBI2(M = 0.350),60S(M = 0.057),
andEFA(SD = 0.677) were indicated as the best reference genes by GeNorm, NormFinder, and BestKeeper, respec-tively (Table 2). However, analyzing all results together, 60Swas the best ranked gene (Additional file 3). The pair-wise variation V2/3 value (0.116), calculated by GeNorm, suggested the use ofACT1andUBI2for normalization (Figure 2 and Additional file 3).MANshowed GeNorm M values higher than 1.5 indicating its unstable expression (Additional files 2 and 3). OnlyEFAand60Sare consid-ered as stable by BestKeeper since it presented SD values lower than 1.
A consensus was not possible for A. magna either.
UBI2/60S(M = 0.242),ACT2/PRO(M = 0.013), andUBI1
(0.623) were highlighted as the most stable genes by GeN-orm, NormFinder, and BestKeeper, respectively (Table 2). Considering the classification generated by the three pro-grams,UBI2followed by60Swere the best ranked genes. The GeNorm pairwise variation V2/3 value (0.110) indi-cated the use of the two top ranked genes (UBI2and60S)
for normalization.ACT2, TUB, PRO,EFA, and MAN
showed SD values, calculated by BestKeeper, higher than 1 (Figure 2 and Additional file 3) and were therefore consid-ered unstable.
Taking into account all the dataset of the fourArachis species analyzed by the three programs and considering
“species” as experimental subsets, we could consider
thatACT1,60S,UBI1andUBI2were the top four
suggested a systematic validation of reference genes and the use of at least two validated reference genes involved in distinct cellular functions.
Organ subsets
When the data was analyzed by organ subsets, roots and leaves, GeNorm and NormFinder programs pointed ACT1 as the most stable gene in leaves (M = 0.483 and 0.090, respectively) (Table 2). GeNorm ranked ACT1 andUBI1as the best reference genes for leaves and gen-erated a pairwise variation V4/5 value of 0.141 (Figure 2; Additional file 3). OnlyMANshowed GeNorm M values higher than 1.5. GeNorm and NormFinder ranks were similar, with ACT1, UBI1, and 60S in the three first
positions. BestKeeper program showed UBI2 as the
most stable gene (SD = 0.603) (Additional file 3).
How-ever, UBI1 (SD = 0.807) and ACT1 (SD = 0.897)
appeared in the second and third positions, respectively.
EFA,ACT2, GAPDH,PRO, andMANshowed SD values
higher than 1 by BestKeeper analysis.
For roots,UBI2/60S(M = 0.492),GAPDH(M = 0.063), andACT1(SD = 0.524) were indicated as the most stable genes by GeNorm, NormFinder, and BestKeeper, respec-tively (Table 2). Combining these results,UBI2and60S were the best ranked genes, as they were also classified as good reference genes by GeNorm (first and second posi-tions); NormFinder (fourth and sixth positions) and Best-Keeper (second and third positions) (Additional file 3). GeNorm pairwise variation V3/4 value (0.126) indicated the use of the three best ranked genes (UBI2, 60S, and UBI1) for normalization (Figure 2). All ten genes had a
GeNorm M value below 1.5.GAPDH,TUB, PRO, and
MANshowed SD values higher than 1, as calculated by BestKeeper (Additional file 3). In similar approaches, selection of best reference genes among samples from dif-ferent tissues or organs in difdif-ferent plant species have enabled more accurate and reliable normalization of qRT-PCR results for gene expression studies [20,21,24]. Inter-estingly,60Sand ubiquitin genes, the latter considered here as the most stable gene for both root and leaf subsets, showed quite a low level of stability in a set of five diverse peanut tissues (including roots and leaves) analyzed by GeNorm and NormFinder [30].
Stress subsets
Analyzing the data by stress type, subsets biotic and
abio-tic, GeNorm and BestKeeper highlighted ACT1(M =
0.549 and SD = 0.945, respectively) as the most stable gene in the samples subjected to biotic stress (Table 2). The calculated pairwise variation V3/4 value (0.145) indi-cated the use of the three top GeNorm ranked genes (ACT1,60S, andUBI1) for qRT-PCR normalization (Fig-ure 2; Additional file 3). OnlyMANshowed an M value higher than 1.5. GeNorm and BestKeeper had very similar
outcomes, pointing the same four best reference genes (ACT1,60S,UBI1, andUBI2), with a slight difference in the ranking (Additional file 3). OnlyACT1 andUBI2 presented SD values lower than 1, as calculated by Best-Keeper. The results generated by NormFinder program were in disagreement with those obtained by GeNorm and BestKeeper programs. NormFinder highlightedGAPDHas the most stable gene (M = 0.076), whilst it was ranked in the fifth (M = 0.709) and eighth (SD = 1.560) positions by GeNorm and BestKeeper, respectively.ACT1appeared only in the fifth position of NormFinder classification (M = 0.130). Previous work successfully usedUBI2gene as a normalizer in qRT-PCR analysis of resistantA. hypogaea genotypes challenged toC. personatum[10]. In the pre-sent work, a biotic stress subset was comprised of a set of plant samples inoculated, and their respective non-inocu-lated controls, with pathogens that cause important dis-eases and reduce dramatically peanut yields. The leaves of the resistant wild peanut speciesA. stenosperma were challenged with the foliar fungusC. personatumand the roots with the root-knot nematodeM. arenariaseparately. The results presented here will be used in the forthcoming expression profile studies by qRT-PCR ofArachis candi-date genes involved in these host-pathogen interactions. The further characterization of these resistance candidate genes are important steps to understand the molecular mechanisms associated with the resistance and susceptibil-ity of wild and cultivated species of peanut, and other legumes, to fungi and nematode challenge and the intro-gression of resistance genes fromA. stenospermainto the peanut crop [2,8,10,12,41].
Contrastingly, no consensus among programs was obtained for the subset abiotic stress. UBI2/60S(M =
0.376), GAPDH (M = 0.091), and UBI1 (SD = 0.464)
were the most stable genes by GeNorm, NormFinder, and BestKeeper programs, respectively (Table 2). Among the three programs,UBI2 was the best ranked gene, appearing in the first (M = 0.376), second (M = 0.114), and third (SD = 0.682) positions by GeNorm, NormFinder, and BestKeeper, respectively (Additional file 3). GeNorm pairwise variation V2/3 value (0.136) indicated the use of UBI2 and 60S for normalization (Figure 2) and onlyMAN showed M value higher than 1.5 (Additional file 3). ACT2, EFA, TUB, MAN, and
PRO had a BestKeeper SD value higher than 1 and
Reference gene validation
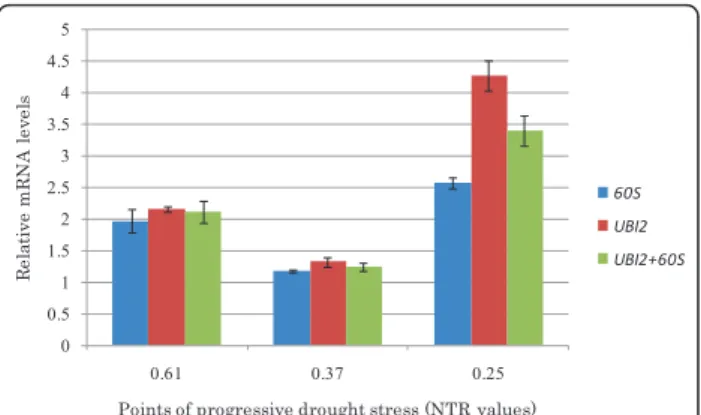
To ratify the expression stability of the candidate refer-ence genes, the expression profile of a gene induced by water deficit was analyzed using two reference genes selected in this study. The target gene (AmDry-1) was selected from a subtractive cDNA library ofA. magna roots submitted to a gradual water deficit in soil and showed to be overexpressedin silico and by RT-PCR analysis in drought conditions (unpublished data). The expression level of AmDry-1 was assessed inA. magna roots at three distinct stages of progressive water deficit treatment based on the estimate NTRs (0.61; 0.37 and 0.25, respectively), using 60S and UBI2 as reference genes, as they were the two most stably expressed in this species, in roots and in abiotic stress treatment (Table 2). A comparison between Cq values of stressed and control plants from all analyzed stages of stress was conducted forUBI2and60Sdata that showed a normal pattern of distribution when evaluated by Shapiro-Wilk tests (W = 0.927, P = 0.347 forUBI2 and W = 0.907, P = 0.196 for 60S). ANOVA analysis showed that Cq values of both reference genes did not differ significantly between stressed and control plants (F = 0.002, P = 0.963 and F = 2.766, P = 0.127; for UBI2 and 60S, respectively), confirming the stable expression of these genes between treatments (stressed and control) and dif-ferent stages of stress. Similar expression patterns of the target gene were obtained when UBI2or 60S was used for normalization. Nevertheless, estimated transcript abundance was higher when values were normalized
against UBI2 than with 60S (Figure 3). When both
genes were used together for normalization, intermedi-ate values were obtained and the differences in tran-script abundance between the two reference genes might explain these results [26]. Target gene expression was also analyzed statistically and the normalized Cq values, ∆Cq (Cq target gene - Cq reference gene) of control and stressed plants were compared by using Kruskal-Wallis tests, a non parametric test, as∆Cq data did not show a normal pattern of distribution. Analyses were made with target genes Cq values normalized with UBI2 and60Sreference genes. The results showed that ∆Cq differ significantly between stressed and control plants (chi-square = 6.564, df = 1.000, P = 0.010 for UBI2and chi-squared = 3.692, df = 1.000, P = 0.055 for 60S), confirming the previously detected overexpression of the target gene (AmDry-1) during plant response to drought treatment.
Conclusions
We have assessed the stability of ten candidate reference genes for qRT-PCR normalization using an entire data-set and eight samples subdata-sets of leaves and roots from wild relatives and cultivated peanut species submitted to
biotic and abiotic stresses. For that, we used the three most commonly used statistical programs, GeNorm, NormFinder, and BestKeeper. It is the first in-depth study of reference genes validation in wildArachis spe-cies and will allow the use of specific combinations of reference genes for the quantification of mRNA by qRT-PCR in complex experimental conditions. In each of the eight sample subsets studied here, a combination of two reference genes involved in different cellular processes was identified as a suitable standard. The use of the reference genes characterized here should improve the accuracy and reliability of gene expression analysis across various organs and type of stresses in different Arachisspecies, contributing particularly for the under-standing of stress tolerance/resistance mechanisms in legumes.
Additional material
Additional file 1: Dissociation curve of the ten reference genes. Dissociation curve generated for each reference gene tested: (A)UBI1; (B)
ACT1, (C)ACT2; (D)UBI1; (E)TUB; (F)MAN; (G)GAPDH; (H)EFA; (I)PRO; (J)
60S. X-axis: Temperature (°C); Y-axis: Derivative reporter (-Rn). Additional file 2: Expression stability for the ten reference genes analyzed by the GeNorm software. Analysis on the (A) entire dataset and individual subsets: (B)A. stenosperma; (C)A. duranensis; (D)A. magna; (E)A. hypogaea; (F) leaves; (G) roots; (H) biotic stress; (I) abiotic stress. Average expression stability values M (Y-axis) of the candidate reference genes are plotted from the least stable to the most stable (X-axis). Additional file 3: Ranking of candidate genes based on their expression stability values estimated by GeNorm, NormFinder, and BestKeeper. Analysis conducted with the entire dataset and individual (species, organ or stress) subsets.
Acknowledgements
The authors gratefully acknowledge The Challenge Program Generation, Tropical Legume Improvement (TL1), CNPq, FAP-DF and host institutions for
0 0.5 1 1.5 2 2.5 3 3.5 4 4.5 5
0.61 0.37 0.25
R
e
la
tiv
e
m
R
N
A
le
v
e
ls
Points of progressive drought stress (NTR values)
60S UBI2 UBI2+60S
supporting funding this work. The authors also wish to thank J.F.M. Valls for providing seeds and J. Padilha da Silva for helping with statistical analysis.
Author details 1
EMBRAPA Recursos Genéticos e Biotecnologia. Parque Estação Biológica, CP 02372. Final W5 Norte, Brasília, DF - Brazil.2EMBRAPA Semiárido, CP 23, Petrolina, PE - Brazil.3Universidade de Brasília, Campus I, Brasília, DF - Brazil. 4Universidade Católica de Brasília, Campus II, 916 Norte, Brasília, DF - Brazil.
Authors’contributions
CVM carried out the qRT-PCR assays, performed the statistical analysis and drafted the manuscript; PMG participated in conceiving the study, data analysis and drafting the manuscript; ACQM conducted greenhouse assays and data analysis; ACGA conducted greenhouse assays and data analysis; SCMLB conducted greenhouse assays and data analysis; DJB participated in conceiving the study and drafting the manuscript; ACMB conceived of the study, and participated in its design and coordination and drafted the manuscript. All authors read and approved the final manuscript.
Competing interests
The authors declare that they have no competing interests.
Received: 4 April 2011 Accepted: 9 September 2011 Published: 9 September 2011
References
1. Isleib TG, Pattee HE, Giesbrecht FG:Oil, sugar, and starch characteristics in peanut breeding lines selected for low and high oil content and their combining ability.J Agric Food Chem2004,52(10):3165-3168.
2. Leal-Bertioli SC, Jose AC, Alves-Freitas DM, Moretzsohn MC, Guimaraes PM, Nielen SAC, Jensen JL, Vidigal BS, Pereira RW, Pike J, Favero AP,et al:
Identification of candidate genome regions controlling disease resistance in Arachis.BMC Plant Biol2009,9:112.
3. Moretzsohn MC, Barbosa AVG, Alves-Freitas DMT, Teixeira C, Leal-Bertioli SCM, Guimaraes PM, Pereira RW, Lopes CR, Cavallari MM, Valls JFM,
et al:A linkage map for the B-genome of Arachis (Fabaceae) and its synteny to the A-genome.BMC Plant Biol2009,9:40.
4. Moretzsohn MC, Leoi L, Proite K, Guimaraes PM, Leal-Bertioli SC, Gimenes MA, Martins WS, Valls JF, Grattapaglia D, Bertioli DJ:A microsatellite-based, gene-rich linkage map for the AA genome of Arachis (Fabaceae).Theor Appl Genet2005,111(6):1060-1071. 5. Bertioli DJ, Moretzsohn MC, Madsen LH, Sandal N, Leal-Bertioli SC,
Guimaraes PM, Hougaard BK, Fredslund J, Schauser L, Nielsen AM,et al:An analysis of synteny of Arachis with Lotus and Medicago sheds new light on the structure, stability and evolution of legume genomes.BMC Genomics2009,10:45.
6. Guimarães PM, Garsmeur O, Proite K, Leal-Bertioli SCM, Seijo G, Chaine C, Bertioli DJ, D’Hont A:BAC libraries construction from the ancestral diploid genomes of the allotetraploid cultivated peanut.BMC Plant Biol
2008,8:14.
7. Proite K, Leal-Bertioli SC, Bertioli DJ, Moretzsohn MC, da Silva FR, Martins NF, Guimaraes PM:ESTs from a wild Arachis species for gene discovery and marker development.BMC Plant Biol2007,7:7.
8. Guimarães P, Brasileiro A, Proite K, de Araújo A, Leal-Bertioli S, Pic-Taylor A, da Silva F, Morgante C, Ribeiro S, Bertioli D:A study of gene expression in the nematode resistant wild peanut relative, Arachis stenosperma, in response to challenge with Meloidogyne arenaria.Trop Plant Biol2010,
3(4):183-192.
9. Govind G, ThammeGowda HV, Kalaiarasi PJ, Iyer DR, Muthappa SK, Nese S, Makarla UK:Identification and functional validation of a unique set of drought induced genes preferentially expressed in response to gradual water stress in peanut.Mol Genet Genomics2009,281(6):591-605. 10. Luo M, Dang P, Bausher MG, Holbrook CC, Lee RD, Lynch RE, Guo BZ:
Identification of transcripts involved in resistance responses to leaf spot disease caused byCercosporidium personatumin peanut (Arachis hypogaea).Phytopathology2005,95(4):381-387.
11. Nobile PM, Lopes CR, Barsalobres-Cavallari C, Quecim V, Coutinho LL, Hoshino AA, Gimenes MA:Peanut genes identified during initial phase of Cercosporidium personatum infection.Plant Sci2008,174(1):78-87. 12. Tirumalaraju SV, Jain M, Gallo M:Differential gene expression in roots of
nematode-resistant and -susceptible peanut (Arachis hypogaea) cultivars
in response to early stages of peanut root-knot nematode (Meloidogyne arenaria) parasitization.J Plant Physiol2011,168(5):481-492.
13. Kubista M, Andrade JM, Bengtsson M, Forootan A, Jonák J, Lind K, Sindelka R, Sjöback R, Sjögreen B, Strömbom L,et al:The real-time polymerase chain reaction.Mol Aspects Med2006,27(23):95-125. 14. Bustin SA, Benes V, Garson JA, Hellemans J, Huggett J, Kubista M, Mueller R,
Nolan T, Pfaffl MW, Shipley GL,et al:The MIQE guidelines: minimum information for publication of quantitative real-time PCR experiments. Clin Chem2009,55(4):611-622.
15. Caldana C, Scheible W-R, Mueller-Roeber B, Ruzicic S:A quantitative RT-PCR platform for high-throughput expression profiling of 2500 rice transcription factors.Plant Methods2007,3(1):7.
16. Long XY, Wang JR, Ouellet T, Rocheleau H, Wei YM, Pu ZE, Jiang QT, Lan XJ, Zheng YL:Genome-wide identification and evaluation of novel internal control genes for Q-PCR based transcript normalization in wheat.Plant Mol Biol2010,74(3):307-311.
17. Andersen CL, Jensen JL, Orntoft TF:Normalization of real-time quantitative reverse transcription-PCR data: a model-based variance estimation approach to identify genes suited for normalization, applied to bladder and colon cancer data sets.Cancer Res2004,
64(15):5245-5250.
18. Guenin S, Mauriat M, Pelloux J, Van Wuytswinkel O, Bellini C, Gutierrez L:
Normalization of qRT-PCR data: the necessity of adopting a systematic, experimental conditions-specific, validation of references.J Exp Bot2009,
60(2):487-493.
19. Gutierrez L, Mauriat M, Guénin S, Pelloux J, Lefebvre J-F, Louvet R, Rusterucci C, Moritz T, Guerineau F, Bellini C,et al:The lack of a systematic validation of reference genes: a serious pitfall undervalued in reverse transcription-polymerase chain reaction (RT-PCR) analysis in plants.Plant Biotechnol J2008,6(6):609-618.
20. Artico S, Nardeli S, Brilhante O, Grossi-de-Sa M, Alves-Ferreira M:
Identification and evaluation of new reference genes in Gossypium hirsutum for accurate normalization of real-time quantitative RT-PCR data.BMC Plant Biol2010,10(1):49.
21. Barsalobres-Cavallari C, Severino F, Maluf M, Maia I:Identification of suitable internal control genes for expression studies in Coffea arabica under different experimental conditions.BMC Mol Biol2009,10(1):1. 22. Boava L, Laia M, Jacob T, Dabbas K, Goncalves J, Ferro J, Ferro M, Furtado E:
Selection of endogenous genes for gene expression studies in Eucalyptus under biotic (Puccinia psidii) and abiotic (acibenzolar-S-methyl) stresses using RT-qPCR.BMC Res Notes2010,3(1):43.
23. Jarošová J, Kundu KJ:Validation of reference genes as internal control for studying viral infections in cereals by quantitative real-time RT-PCR.BMC Plant Biol2010,10:146.
24. Silveira ED, Alves-Ferreira M, Guimaraes LA, da Silva FR, Carneiro VTD:
Selection of reference genes for quantitative real-time PCR expression studies in the apomictic and sexual grass Brachiaria brizantha.BMC Plant Biol2009,9:10.
25. Iskandar H, Simpson R, Casu R, Bonnett G, Maclean D, Manners J:
Comparison of reference genes for quantitative real-time polymerase chain reaction analysis of gene expression in sugarcane.Plant Mol Biol Rep2004,22(4):325-337.
26. Hu R, Fan C, Li H, Zhang Q, Fu Y-F:Evaluation of putative reference genes for gene expression normalization in soybean by quantitative real-time RT-PCR.BMC Mol Biol2009,10(1):93.
27. Czechowski T, Stitt M, Altmann T, Udvardi MK, Scheible W-R:Genome-wide identification and testing of superior reference genes for transcript normalization in Arabidopsis.Plant Physiol2005,139(1):5-17. 28. Jain M, Nijhawan A, Tyagi AK, Khurana JP:Validation of housekeeping
genes as internal control for studying gene expression in rice by quantitative real-time PCR.Biochem Biophys Res Commun2006,
345(2):646-651.
29. Vandesompele J, De Preter K, Pattyn F, Poppe B, Van Roy N, De Paepe A, Speleman F:Accurate normalization of real-time quantitative RT-PCR data by geometric averaging of multiple internal control genes.Genome Biol2002,3(7).
30. Brand Y, Hovav R:Identification of suitable internal control genes for quantitative real-time PCR expression analyses in peanut (Arachis hypogaea).Peanut Sci2010,37(1):12-19.
spot disease by plant growth-promoting rhizobacteria and chemical elicitors.Plant Disease2001,85(8):879-884.
32. Proite K, Carneiro R, Falcao R, Gomes A, Leal-Bertioli S, Guimaraes P, Bertioli D:Post-infection development and histopathology of Meloidogyne arenaria race 1 on Arachis spp.Plant Pathol2008,
57(5):974-980.
33. Nelson SC, Simpson CE, Starr JL:Resistance to Meloidogyne arenaria in Arachis spp. Germoplasm.Supplement to Journal of Nematology1989,
21:654-660.
34. Sinclair TR, Ludlow MM:Influence of soil water supply on the plant water balance of four tropical grain Legumes.Functional Plant Biol1986,
13(3):329-341.
35. Wilkins TA, Smart LB:Isolation of RNA from plant tissue.InA laboratory guide to RNA: isolation, analysis, and synthesis.Edited by: Krieg PA. New York: Wiley-Liss, Inc.; 1996:21-41.
36. Hougaard BK, Madsen LH, Sandal N, Moretzsohn MD, Fredslund J, Schauser L, Nielsen AM, Rohde T, Sato S, Tabata S,et al:Legume anchor markers link syntenic regions between Phaseolus vulgaris, Lotus japonicus, Medicago truncatula and Arachis.Genetics2008,
179(4):2299-2312.
37. Untergasser A, Nijveen H, Rao X, Bisseling T, Geurts R, Leunissen JA:
Primer3Plus, an enhanced web interface to Primer3.Nucleic Acids Res
2007,35(Web Server):W71-74.
38. Pfaffl MW, Tichopad A, Prgomet C, Neuvians TP:Determination of stable housekeeping genes, differentially regulated target genes and sample integrity: BestKeeper - Excel-based tool using pair-wise correlations. Biotechnol Lett2004,26(6):509-515.
39. Pfaffl MW, Horgan GW, Dempfle L:Relative expression software tool (REST (c)) for group-wise comparison and statistical analysis of relative expression results in real-time PCR.Nucleic Acids Res2002,30(9):10. 40. Pfaffl M:Quantification strategies in real-time PCR.InA-Z of quantitative
PCR.Edited by: Bustin S. La Jolla, CA, USA: International University Line (IUL); 2004:87-112.
41. Leal-Bertioli SCdM, Farias MPd, Silva Pedro IT, Guimarães PM, Brasileiro ACM, Bertioli DJ, Araujo ACGd:Ultrastructure of the initial interaction of Puccinia arachidis and Cercosporidium personatum with leaves of Arachis hypogaea and Arachis stenosperma.J Phytopathol2010, 158(11-12):792-796.
42. Kottapalli KR, Rakwal R, Shibato J, Burow G, Tissue D, Burke J, Puppala N, Burow M, Payton P:Physiology and proteomics of the water-deficit stress response in three contrasting peanut genotypes.Plant Cell Environ2009,
32(4):380-407.
doi:10.1186/1756-0500-4-339
Cite this article as:Morganteet al.:Reference genes for quantitative reverse transcription-polymerase chain reaction expression studies in
wild and cultivated peanut.BMC Research Notes20114:339.
Submit your next manuscript to BioMed Central and take full advantage of:
• Convenient online submission
• Thorough peer review
• No space constraints or color figure charges
• Immediate publication on acceptance
• Inclusion in PubMed, CAS, Scopus and Google Scholar
• Research which is freely available for redistribution