This work is licensed under a Creative Commons Attribution License
AN ANALYSIS OF THE SHADOW ECONOMY IN EU COUNTRIES
Brindusa Mihaela TUDOSE* Raluca Irina CLIPA**
Abstract: The paper aims at analysing the dimension of the underground economy in the EU states between 2003 and 2015. In order to achieve this goal, we use qualitative and quantitative methods. In the first two sections of the study we resort to conceptualisation and bring up to date scientific contributions in the field of the shadow economy both in terms of its definition and the methods of quantifying the phenomenon. In the third section, based on the results of the latest research, we identify the dynamics of the underground economy on three levels: the EU-15 (before and after 2005); the EU-10 (before and after the accession of 10 countries in 2005) and the EU-3 (before and after 2007). The main conclusion is that regardless of the reporting level (national, European, world), the real size of the underground economy remains unknown.
Keywords:shadow economy; MIMIC model JEL Classification: O17; O47
Introduction
The complexity of the contemporary economies, the free movement of people, capital and goods on EU territory, technological progress, taxation, economic and financial crisis, concerns of risk reduction while maximizing the gains or benefits have redefined the behaviour of the world markets and economic actors. During the last decades, the shadow economy has become a serious
impediment for economic development, the more so since we don’t know precisely its size nor
evolution. Furthermore, for the member states of the EU, the shadow economy is seen as an obstacle that could threaten the fulfilment of the cohesion and growth objectives of the Europe 2020 strategy. According to research in the field, the shadow economy is difficult to quantify. However, using modern statistical means an estimation of the size of this phenomenon can be achieved, with a reasonable degree of confidence. The dynamics of the shadow economy can be analysed retroactively, as far as its specific manifestations are identified and sanctioned: evasion, undeclared work, corruption, money laundering etc. We endorse those approaches provided by the literature according to which in the context of the underground economy only estimates and not accurate assessments can be admitted.
The main objective of the research was to analyse the economy, both nationally and at European level. To achieve this goal, the paper is organized as follows: the first section presents the state of knowledge in the field; the second section presents the methodological coordinates for estimating the shadow economy; the third section presents information on the dynamics of the shadow economy; the last section summarizes the conclusions and present the limitations and the directions for future research.
1. The concept of shadow economy. Literature review
The first research in the field of the shadow economy, in an attempt to estimate its size, defines the concept in terms of the output of goods and services (whether legal or illegal) unreported officially, not contained respectively in the official estimates of the gross domestic product (Smith, 1994). Schneider (1994) and Lubell (1991) describe the underground economy as all the economic activities unregistered in the calculation of gross national product. According to other authors, the underground economy includes "unreported income from the legal production of goods and services in monetary transactions or barter, so all economic activities which would generally be taxed" (Schneider and Enste, 2000, p. 5).
Recent research (Schneider, 2011) reveals that the shadow economy includes the production of goods and services "hidden" intentionally for any of the following reasons: a) to avoid paying income tax, value added tax and other taxes; b) to avoid paying contributions to the health system, the social security system etc; c) to avoid compliance with certain legal labour market standards, such as the mandatory minimum wage per economy, the maximum number of working hours, labour security standards; d) to avoid compliance with certain administrative procedures, including statistical questionnaires or other administrative forms.
The European Commission defines the shadow economy as being “those economic activities and the income derived from them that circumvent or avoid government regulations or taxation”
(European Commission, 2014, p. 1).
In Europe, the activities related to the shadow economy are divided into two main categories:
undeclared work and underreporting (AT Kearney, 2013). Although difficult to quantify, experts (AT Kearney, 2013) estimated that this phenomenon totalled approximately 2.15 trillion of Euro in 2013, with notable differences between Western (7-8% of GDP in Switzerland, Austria and Luxembourg) and Eastern Europe (about 30% in countries like Croatia, Romania and Bulgaria).
In terms of conceptualization, we conclude by stating that although the shadow economy has been defined and interpreted as having multiple meanings, we need to remember only the common essence of the debate: it comprises all unregistered / undeclared economic activities having negative economic (damage functionality of the economy and reducing GDP) and social (in terms of social
equity) impacts.
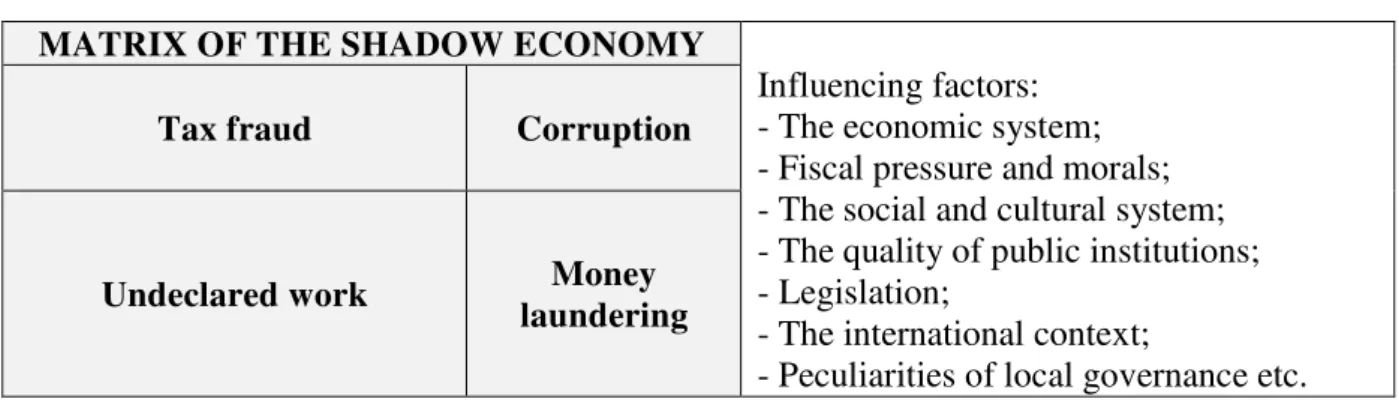
Therefore, in order to understand the shadow economy, its component elements have to be known (Figure 1).
Figure 1 - Matrix of the shadow economy
MATRIX OF THE SHADOW ECONOMY
Influencing factors: - The economic system; - Fiscal pressure and morals; - The social and cultural system; - The quality of public institutions; - Legislation;
- The international context;
- Peculiarities of local governance etc. Tax fraud Corruption
Undeclared work Money laundering
Source: Authors’ representation
The Convention on the protection of the financial interests of the European Communities (OJ C316, 27.11.1995, p. 49) defines fraud as any intentional act or omission relating to: a) the use or presentation of false statements or documents, incorrect or incomplete, that has the effect of hijacking or improper withholding of public funds; b) non-disclosure of information and violation of a specific obligation; c) improper use of funds for purposes other than those for which they were originally granted. Most often, tax fraud is linked to organized crime. According to Europol, it is estimated that between 40 and 60 billion euros in annual losses of tax revenue in Member States are caused by organized criminal groups and that 2% of these groups are responsible for 80% of intra-Community fraud with "ghost" companies.
identified the main causes of undeclared work: a) low levels of incomes from legal business; b) lack of regular jobs on the labour market; c) tax or social security contribution too high; d) lack of control by the authorities. At the EU level, the most common type of undeclared work is recorded in the repairs or renovations (i.e. gardening, cleaning work), elderly care or childcare.
Corruption, a phenomenon without borders, translates (in the most popular and common sense) as the misuse of power for personal gain, materializing in accepting and soliciting bribes, receiving undue benefits, influence peddling, illicit activities conducted in order to obtain material benefits or social or political positions. Lately - more than ever - this phenomenon has had favourable conditions for proliferation, being supported by a complex of economic, institutional, political, social and moral factors.
Money laundering is the last link in the chain through which money from criminal activities of the underground economy are reintroduced in surface or directed to financing of terrorism.
Seen in all its complexity, an analysis of the chromatics of the shadow economy configures a wide array comprising both bleak tones (states / areas / regions whose underground economy exceeds 30% of GDP) and lighter tones (where the underground economy is under 10% of GDP).
2. Methodological coordinates for estimating the shadow economy
The literature (Feige, 1989) offers three models to estimate the size of the underground economy: a) qualitative methods (focused on identifying motivations, perceptions and behaviours of the actors of the shadow economy; b) quantitative methods (conclusive, focused on obtaining representative data on the structure and dynamics of the phenomenon); c) methods that do not claim systematic scientific estimates (based on personal observation, without considering the context, nominal, partial case studies or random investigations). Although of partial relevance, the latter still provides relevant images on the frequency and nature of this phenomenon and can be a starting point for a scientific approach.
From the point of view of the scope, the methods process two types of information:
b) Information collected at the macroeconomic level. Although the creation of databases at the macroeconomic level is not aimed exclusively at estimating the shadow economy, these databases allow estimating it based on logical inferences are devoid of subjectivity, less expensive, allow estimating the temporal dimension and the dynamics of the underground economic activities and use reliable data collected by organizations or public entities (i.e. central banks).
Recently published studies (Ene, 2010) have recommended estimating the shadow economy by using other methods, more or less complex, structured as follows:
a) Methods based on direct approach, specific to the microeconomic field, based on surveys / voluntary interviews, fiscal statistics, tax audits and other similar methods. The advantage of this method is that it allows the providing of information on the structure of the shadow economy (the correctness of the analyses and the interpretations depends on the availability, cooperation and sincerity of the respondents).
b) Methods based on indirect approach, specific to the macroeconomic field, used to estimate the size of certain components of the economy;
c) Causal methods, which were developed as a response to the need to integrate multiple causes of manifestation and development of the underground economy with generated effects over time. Such methods are: MIMIC (Multiple Indicators and Multiple Causes), DYMIMIC (Dynamic Indicators Multiple Causes Multiple).
3. Analysis of the shadow economy’s dynamics using MIMIC model
Using the MIMIC model, Friedrich Schneider (2015) has estimated the dynamics of the underground economy for the period 2003-2015, showing a decrease from an average of 22.6% to 18.2% of GDP (sample being made up of 28 EU Member States).
Based on the results of the research mentioned above, we intend to identify the dynamics of the underground economy on three levels: the EU-15 (before and after 2005); the EU-10 (before and after the accession of 10 countries in 2005) and the EU-3 (before and after 2007).
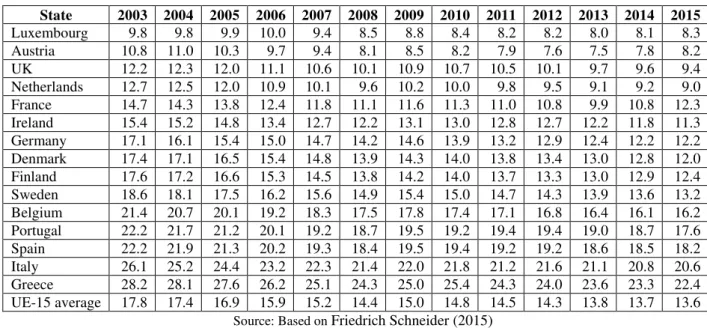
Table 1 - Dynamics of the shadow economy for the UE-15 (%GDP)
State 2003 2004 2005 2006 2007 2008 2009 2010 2011 2012 2013 2014 2015 Luxembourg 9.8 9.8 9.9 10.0 9.4 8.5 8.8 8.4 8.2 8.2 8.0 8.1 8.3 Austria 10.8 11.0 10.3 9.7 9.4 8.1 8.5 8.2 7.9 7.6 7.5 7.8 8.2 UK 12.2 12.3 12.0 11.1 10.6 10.1 10.9 10.7 10.5 10.1 9.7 9.6 9.4 Netherlands 12.7 12.5 12.0 10.9 10.1 9.6 10.2 10.0 9.8 9.5 9.1 9.2 9.0 France 14.7 14.3 13.8 12.4 11.8 11.1 11.6 11.3 11.0 10.8 9.9 10.8 12.3 Ireland 15.4 15.2 14.8 13.4 12.7 12.2 13.1 13.0 12.8 12.7 12.2 11.8 11.3 Germany 17.1 16.1 15.4 15.0 14.7 14.2 14.6 13.9 13.2 12.9 12.4 12.2 12.2 Denmark 17.4 17.1 16.5 15.4 14.8 13.9 14.3 14.0 13.8 13.4 13.0 12.8 12.0 Finland 17.6 17.2 16.6 15.3 14.5 13.8 14.2 14.0 13.7 13.3 13.0 12.9 12.4 Sweden 18.6 18.1 17.5 16.2 15.6 14.9 15.4 15.0 14.7 14.3 13.9 13.6 13.2 Belgium 21.4 20.7 20.1 19.2 18.3 17.5 17.8 17.4 17.1 16.8 16.4 16.1 16.2 Portugal 22.2 21.7 21.2 20.1 19.2 18.7 19.5 19.2 19.4 19.4 19.0 18.7 17.6 Spain 22.2 21.9 21.3 20.2 19.3 18.4 19.5 19.4 19.2 19.2 18.6 18.5 18.2 Italy 26.1 25.2 24.4 23.2 22.3 21.4 22.0 21.8 21.2 21.6 21.1 20.8 20.6 Greece 28.2 28.1 27.6 26.2 25.1 24.3 25.0 25.4 24.3 24.0 23.6 23.3 22.4 UE-15 average 17.8 17.4 16.9 15.9 15.2 14.4 15.0 14.8 14.5 14.3 13.8 13.7 13.6
Source: Based on Friedrich Schneider (2015)
By 2008 most countries presented a declining trend of the informal economy in the GDP. The inflection point of growth of the underground economy is performed between 2008 and 2009. At this point, the indicator analysed recorded growth in all countries. By 2009, all countries showed a downward trend. In 2015, the only country to record an increase in the share of the underground economy in the GDP is France.
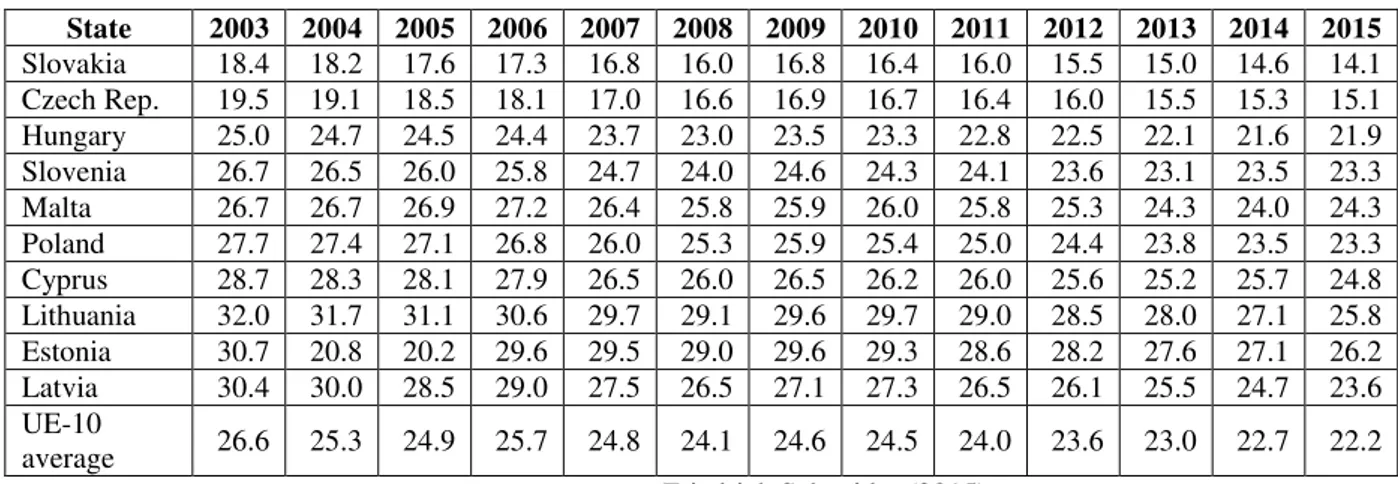
Looking at the sample of the 10 Southeast European countries (Table 2) that joined the EU in 2005, we see an increasing share of the shadow economy in GDP and a downward trend of the indicator for the entire period.
Lithuania is the state with the largest share of the shadow economy in GDP and recorded the biggest drop of the indicator (6.8 percentage points) during the period 2003-2015. Slovakia submits the most favourable situation as it is situated at the top of the rankings (2003-2015) and recorded a decrease in of the underground economy by 4.3 percentage points.
Table 2 - Dynamics of shadow economy UE-10 (%GDP)
State 2003 2004 2005 2006 2007 2008 2009 2010 2011 2012 2013 2014 2015 Slovakia 18.4 18.2 17.6 17.3 16.8 16.0 16.8 16.4 16.0 15.5 15.0 14.6 14.1 Czech Rep. 19.5 19.1 18.5 18.1 17.0 16.6 16.9 16.7 16.4 16.0 15.5 15.3 15.1 Hungary 25.0 24.7 24.5 24.4 23.7 23.0 23.5 23.3 22.8 22.5 22.1 21.6 21.9 Slovenia 26.7 26.5 26.0 25.8 24.7 24.0 24.6 24.3 24.1 23.6 23.1 23.5 23.3 Malta 26.7 26.7 26.9 27.2 26.4 25.8 25.9 26.0 25.8 25.3 24.3 24.0 24.3 Poland 27.7 27.4 27.1 26.8 26.0 25.3 25.9 25.4 25.0 24.4 23.8 23.5 23.3 Cyprus 28.7 28.3 28.1 27.9 26.5 26.0 26.5 26.2 26.0 25.6 25.2 25.7 24.8 Lithuania 32.0 31.7 31.1 30.6 29.7 29.1 29.6 29.7 29.0 28.5 28.0 27.1 25.8 Estonia 30.7 20.8 20.2 29.6 29.5 29.0 29.6 29.3 28.6 28.2 27.6 27.1 26.2 Latvia 30.4 30.0 28.5 29.0 27.5 26.5 27.1 27.3 26.5 26.1 25.5 24.7 23.6 UE-10
average 26.6 25.3 24.9 25.7 24.8 24.1 24.6 24.5 24.0 23.6 23.0 22.7 22.2 Source: Based on Friedrich Schneider (2015)
Table 3 - Dynamics of shadow economy UE-3 (%GDP)
State 2003 2004 2005 2006 2007 2008 2009 2010 2011 2012 2013 2014 2015 Croatia 32.3 32.3 31.5 31.2 30.4 29.6 30.1 29.8 29.5 29.0 28.4 28.0 27.7 Romania 33.6 32.5 32.2 31.4 30.2 29.4 29.4 29.8 29.4 29.1 28.4 28.1 28.0 Bulgaria 35.9 35.3 34.4 34.0 32.7 32.1 32.5 32.6 32.3 31.9 31.2 31.0 30.6 UE-3
average 33.9 33.4 32.7 32.2 31.1 30.4 30.7 30.7 30.4 30.0 29.3 29.0 28.8 Source: Based on Friedrich Schneider (2015)
At beginning of the analysed period, the last three Member States which joined the EU quantified the underground economy to a third of GDP (Table 3). Although it has the best recovery (-5.6%), Romania recorded a high share of the shadow economy in 2015. For these three states, 2009 is the point at which the downward trend of the underground economy finished. Compared to other groups of countries, Romania and Bulgaria maintained the increase for two consecutive years.
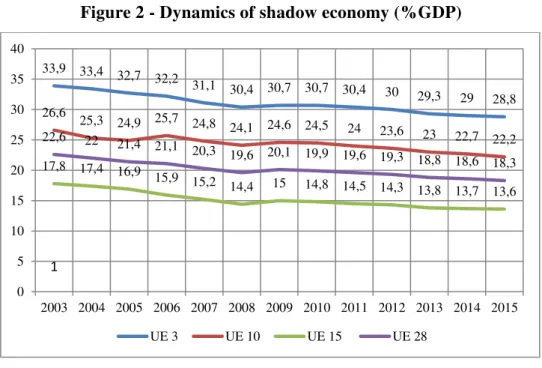
The overall picture of the dynamics of the underground economy in the period 2003-2015 is shown in Table 4. The graphical representation (Figure 2) makes it possible to observe the inflection point (2009 in the changing trend indicator) and the delayed recovery of Romania and Bulgaria on the downward trend.
Table 4 - Dynamics of shadow economy (%GDP)
AVERAGE 2003 2004 2005 2006 2007 2008 2009 2010 2011 2012 2013 2014 2015 UE-28 22.6 22.0 21.4 21.1 20.3 19.6 20.1 19.9 19.6 19.3 18.8 18.6 18.3 UE-15 17.8 17.4 16.9 15.9 15.2 14.4 15.0 14.8 14.5 14.3 13.8 13.7 13.6 UE-10 26.6 25.3 24.9 25.7 24.8 24.1 24.6 24.5 24.0 23.6 23.0 22.7 22.2 UE-3 33.9 33.4 32.7 32.2 31.1 30.4 30.7 30.7 30.4 30.0 29.3 29.0 28.8
Figure 2 - Dynamics of shadow economy (%GDP)
Source: Authors
Overall, we are witnessing a revival of the formal economy corresponding to a contraction of the underground economy. As research (Schneider 2015) showed, the countries of Central and Eastern Europe (new members of the EU such as Bulgaria, Cyprus, Czech Republic, Latvia, Lithuania and Poland) have a higher share of the shadow economy than "old" countries (i.e. Austria, Belgium, Germany and Italy). The author reveals an increase in the size of the underground economy from west to east and from north to south.
Conclusions
The shadow economy has been and still remains a topical issue in terms of scientific debate, but also a major concern for all governments of the states of the world. In order to reduce the size of the phenomenon discussed, economic, fiscal and institutional approaches appear as basic tools in the redefinition of the quantitative and qualitative coordinates of a transparent and efficient economy.
The conclusions drawn from the analysis undertaken are:
1. Regardless of the reporting level (national, European, world), the real size (accurate) of the underground economy remains unknown. Profile research has achieved estimates of its size and dynamics. Even in these circumstances, research results are valuable and serve as benchmarks for appropriate correctional measures.
2. In the EU Member States the underground economy, estimated as a percentage of GDP, 33,9 33,4
32,7 32,2
31,1 30,4 30,7 30,7 30,4
30 29,3 29 28,8 26,6
25,3 24,9 25,7 24,8
24,1 24,6 24,5 24 23,6 23
22,7 22,2 17,8 17,4 16,9
15,9 15,2
14,4 15 14,8 14,5 14,3 13,8 13,7 13,6 22,6 22
21,4 21,1 20,3
19,6 20,1 19,9 19,6 19,3 18,8 18,6 18,3
1
0 5 10 15 20 25 30 35 40
2003 2004 2005 2006 2007 2008 2009 2010 2011 2012 2013 2014 2015
the economic system; fiscal and moral pressure; social system; cultural system; quality of public institutions; legislation; international context; particularities of local governance etc.
3. By 2015, the analysis of the EU Member States has allowed us to identify a wide range of variation including both gloomy tones (states whose underground economy reached almost one third of the gross domestic product, as well as Bulgaria, Croatia and Romania) as well as lighter tones (Member States where it is below 10% of GDP, namely: Luxembourg, Austria, UK, Netherlands).
4. Spatially, we have noticed a geographical concentration of countries with a higher share of shadow economy in Southeast Europe (EU-3 and EU-10). The other states (EU-15) are limited to areas of northern and south-western EU.
5. The analysis of the shadow economy’s dynamics has enabled us to identify an inflection point in 2009, when a change in its trend was recorded. In 2010, all EU Member States followed the downward trend except Romania, which has a delayed recovery.
The limits and future directions for research. This research is purely based on information provided by recent research in the field. To overcome this limit we plan to conduct future research into two main directions: identifying the determinants of the shadow economy and developing projections regarding the underground economy in Romania compared to other European countries.
References
AT Kearney (2013), “The Shadow Economy in Europe, 2013 Report”, available at: http://www.atkearney.com/financial-institutions/featured-article/-/asset_publisher/j8IucAqMq EhB/content/the-shadow-economy-in-europe-2013/10192 (accessed 22.04.2016)
Ene, C.M. (2010), Economia subterana. Teorie, modele, aplicatii, Editura Transversal, Targoviste, p. 75.
European Commission (n.d.) Shadow Economy, available at: http://ec.europa.eu/europe2020/ pdf/themes/07_shadow_economy.pdf, (referred on 30/07/2014).
Feige, L.E. (1989), “The meaning and measurement of the underground economy” in Feige, L.E., 1989, p. 26, “Underground Economies. The tax evasion and information distorsion”,
Cambridge University Press, pp.13-56.
Schneider, F, (1994), “Measuring the Size and Development of the Shadow Economy: Can the Causes
be Found and the Obstacles be Overcome?” in: Brandstaetter H. and Güth W. (eds.) Essays on Economic Psychology, Berlin: Springer, pp. 193-212.
Schneider, F. and Enste, D.,H. (2000), “Shadow Economies: Size, Causes, and Consequences”,
Journal of Economic Literature, Vol. XXXVIII, March, pp. 77-114.
Schneider, F. G. (2011), Handbook of Shadow Economy. Cheltenham: Edward Elgar Publishing Limited, UK.
Schneider, F., Buehn, A.and Montenegro, C.E. (2010), “Shadow Economies All over the World New Estimates for 162 Countries from 1999 to 2007”, Policy Research Working Paper 5356, The World Bank Development Research Group Poverty and Inequality Team & Europe and Central Asia Region Human Development Economics Unit, July 2010, available at: http://elibrary.worldbank.org/doi/pdf/10.1596/1813-9450-5356 (accessed 20.04.2016)
Schneider, F. (2015), “Size and Development of the Shadow Economy of 31 European and 5 other OECD Countries from 2003 to 2015: Different Developments”, available at: ShadEcEurope31_January2015.doc (accessed 27.04.2016)
Special Eurobarometer 402 (2015), “Undeclared work in the European Union”, available at: