Invasion Patterns in the USA
Davide Rassati1*, Massimo Faccoli1, Robert A. Haack2, Robert J. Rabaglia3, Edoardo Petrucco Toffolo1, Andrea Battisti1, Lorenzo Marini1
1Department of Agronomy, Food, Natural Resources, Animals, & Environment (DAFNAE), University of Padua, Legnaro (PD), Italy,2USDA Forest Service, Northern Research Station, Lansing, Michigan, United States of America,3USDA Forest Service, Forest Health Protection, Washington, D. C., United States of America
Abstract
Non-native bark and ambrosia beetles represent a threat to forests worldwide. Their inva-sion patterns are, however, still unclear. Here we investigated first, if the spread of non-native bark and ambrosia beetles is a gradual or a discontinuous process; second, which are the main correlates of their community structure; third, whether those correlates corre-spond to those of native species. We used data on species distribution of non-native and native scolytines in the continental 48 USA states. These data were analyzed through a beta-diversity index, partitioned into species richness differences and species replacement, using Mantel correlograms and non-metric multidimensional scaling (NMDS) ordination for identifying spatial patterns, and regression on distance matrices to test the association of climate (temperature, rainfall), forest (cover area, composition), geographical (distance), and human-related (import) variables withβ-diversity components. For both non-native bark and ambrosia beetles,β-diversity was mainly composed of species richness difference than species replacement. For non-native bark beetles, a discontinuous invasion process composed of long distance jumps or multiple introduction events was apparent. Species richness differences were primarily correlated with differences in import values while tem-perature was the main correlate of species replacement. For non-native ambrosia beetles, a more continuous invasion process was apparent, with the pool of non-native species arriv-ing in the coastal areas that tended to be filtered as they spread to interior portions of the continental USA. Species richness differences were mainly correlated with differences in rainfall among states, while rainfall and temperature were the main correlates of species replacement. Our study suggests that the different ecology of bark and ambrosia beetles influences their invasion process in new environments. The lower dependency that bark beetles have on climate allowed them to potentially colonize more areas within the USA, while non-native ambrosia beetles, being dependent on rainfall, are typically filtered by the environment.
a11111
OPEN ACCESS
Citation:Rassati D, Faccoli M, Haack RA, Rabaglia RJ, Petrucco Toffolo E, Battisti A, et al. (2016) Bark and Ambrosia Beetles Show Different Invasion Patterns in the USA. PLoS ONE 11(7): e0158519. doi:10.1371/journal.pone.0158519
Editor:Wolfgang Arthofer, University of Innsbruck, AUSTRIA
Received:January 13, 2016
Accepted:June 16, 2016
Published:July 26, 2016
Copyright:This is an open access article, free of all copyright, and may be freely reproduced, distributed, transmitted, modified, built upon, or otherwise used by anyone for any lawful purpose. The work is made available under theCreative Commons CC0public domain dedication.
Data Availability Statement:We uploaded the requested data in the“open science framework”
database. The citation link is“https://osf.io/wpkvh/”. Funding:The authors received no specific funding for this work. University of Padova provided support in the form of salaries for authors DR, MF, EPT, AB, LM, but did not have any additional role in the study design, data collection and analysis, decision to publish, or preparation of the manuscript.
Introduction
International movement of non-native forest insects represents a severe threat to forests world-wide [1,2]. Bark and ambrosia beetles (Coleoptera: Curculionidae, Scolytinae) represent one of the most successful groups of invaders, in part because they are easily transported in wood products and packaging materials [3,4]. Continuing increases in international trade are expected to pose even greater risks of invasion by these organisms [5–10]. For these reasons, improved understanding of the possible drivers of the invasion process of bark and ambrosia beetles is recognized as a key research priority.
Although many factors influencing current geographic distribution and species richness of non-native species have been already examined [8,10], drivers and mechanisms of assembly of non-native communities are poorly studied. In this context, analyses ofβ-diversity may pro-vide insights into these mechanisms [11–14], although whether this approach can identify casual processes is still under debate [15–20]. Spatialβ-diversity can be generally defined as the extent of change in community composition, or degree of community differentiation, between different locations [21]. This differentiation can be partitioned into different components, each representing distinct ecological processes: species richness difference, species replacement, and nestedness. Several indices have been proposed to quantify the individual components [22–24], which have generated some confusion given their ambiguous ecological interpretation [25]. A recently developed analytical framework partitionsβ-diversity into its species richness and replacement components [23]. This framework can be effectively used to unveil potential driv-ers of community assembly and unddriv-erstand the invasion process, but to date no studies investi-gatingβ-diversity patterns of non-native bark and ambrosia beetles have been produced. Such information would be valuable to managers interested in surveillance and control measures at points of entry or other high-risk sites.
Scolytines are generally divided into two main guilds according to their feeding habit [26]: bark beetles and ambrosia beetles. Bark beetles build their galleries primarily in the phloem or, less frequently, in the sapwood from which they take most nutrients [26]. They are character-ized by relatively high host specificity, given their reliance on specific phloem characteristics, tree chemistry, and nutritional quality [26]. Many ambrosia beetles are instead relatively gener-alists in the host plants they colonize, feeding primarily on symbiotic fungi that they inoculate on the tunnel walls they bore in wood [26]. These different feeding habits have already been demonstrated to influence patterns of species richness of non-native scolytines in the USA: non-native ambrosia beetles, requiring suitable climatic conditions for the growth of their sym-biotic fungi, are more numerous in wetter and warmer states, whereas non-native bark beetles, being less dependent on climate, are more homogenously distributed [8]. It is still unknown, however, whether the different feeding habits of scolytines also affect the assembly of their communities. For non-native bark beetles, given their high host specificity, considerable differ-ences in species composition (i.e. high species replacement) could be expected among USA states that differ in forest composition; for non-native ambrosia beetles, instead, given their low host specificity, it could be predicted that only slight differences in species composition (i.e. low species replacement) among USA states exist, and that the latter may be more related to temperature or rainfall differences rather than to differences in forest composition.
compared with interior continental areas [8,27,31]. Community assembly of non-native bark and ambrosia beetles should follow the rule of the distance decay of similarity, where the simi-larity between two locations often decreases as the geographical distance between them increases [32]. This is usually due to a combination of at least two, not mutually exclusive, mechanisms: dispersal limitation and environmental filtering [11].
Dispersal limitation implies that differences in species dispersal capabilities lead to differ-ences in community composition. However, multiple-site introductions and human-assisted dispersal [33–37] can increase the homogenization of non-native species communities. To test for these hypotheses, we analyzed spatial autocorrelation of species richness differences and species replacement separately for non-native bark and ambrosia beetles across the continental USA. The shape of the spatial autocorrelation could help to understand whether their spread is a gradual process mainly due to the natural dispersal of the beetles (e.g. positive significant autocorrelation of species replacement at short distance classes), a discontinuous process char-acterized by jump dispersal ahead of the established core population mainly due to human-assisted dispersal (e.g. lack of spatial trend in species richness differences) [38], or a combina-tion of these two processes. Given that both bark and ambrosia beetles can fly long distances [39] and are commonly moved by humans via retail wood [40], wood chips [41], and packag-ing materials [27], it could be expected that both processes can affect their spread.
Environmental filtering assumes that species are able to reach all environmentally suitable sites, therefore environmental divergence determines differences in species richness and species replacement between different sites [42]. It could be predicted, for example, that the pool of non-native scolytines arriving in coastal areas are filtered by the environment as they spread into interior continental areas according to their feeding habit. Changes in community compo-sition would therefore reflect species-specific niche differences in adaptive responses that have evolved along environmental gradients. Considering the relatively higher host specificity of bark beetles, we would expect that their spread would be limited primarily by the presence of their host [43]. In contrast, we expect that ambrosia beetles would be less constrained by host availability but could spread within the new environment wherever the climate allows develop-ment of the beetle and its symbiotic fungi [8]. To test for these hypotheses, we applied regres-sion on distance matrices to understand the direction and the shape of the correlation of climate, forest, and human-related variables with both species richness differences and species replacement.
Furthermore, we compared non-native with native scolytine responses to climate, forest, geographical, and human-related variables. As non-native species share the habitat with the more abundant native species, it becomes interesting to simultaneously compare the processes shaping their community assembly.
Materials and Methods
Data on scolytine distribution
the USA. The project involves sampling 10–15 states every year, and, within each state, 7–10 sites (e.g. natural forests, parks, commercial areas, industrial areas) are selected and monitored using multi-funnel traps baited with generic lures [51]. Although the coarse spatial resolution of the data and the possible limitations that can affect their reliability (i.e. differences in trap-ping efforts among states), no information at a finer spatial resolution is currently available for this group of insects.
Assigning scolytines to a feeding habit
We split the scolytines into three groups: bark beetles, ambrosia beetles, and seed-feeding bee-tles. In particular, we used definitions provided by Kirkendall et al. [52]:“bark beetles”include all the species breeding in inner bark (live and dead phloem tissues) or in the wood that use phloem cells or sapwood as the primary source of food, as well as pith and twig breeders;
“ambrosia beetles”include all the species whose larvae feed primarily on symbiotic ambrosia fungi, which adult females cultivate in their tunnel systems in woody tissues; we did not distin-guish among fungus-farming species that do and do not ingest wood as well as fungus;“ seed-feeding beetles”include scolytines that breed in seeds and their encasing fruit tissues. We excluded from the analyses species that cannot be univocally associated to one of the three functional feeding groups (e.g. someHypothenemusspecies which can develop both in twigs and seeds) or that develop on herbaceous plants and grasses (e.g.Hylastinus obscuruson legumes). In addition, we did not exclude bark beetle species that are known to have a close relationship with symbiotic fungi, such asDendroctonus,Ips,and Tomicusspp. for two main reasons: a) the latter relationship is not an obligate one, although it can enhance larval and adult fitness [52], and b) the primary source of food is represented by the phloem [52]. For non-native species, the information needed to assign each bark and ambrosia beetle to the dif-ferent functional groups were gathered from difdif-ferent sources (seeS1 Table), whereas, for native species, we referred to Wood [26] and Kirkendall et al. [52]. We excluded the group of
“seed-feeding beetles”from the analyses because it was represented by only a few species.
Analyses of
β
-diversity
Species richness difference and species replacement. We used the method by Carvalho et al. [53] (see also Podani and Schmera [23] and Legendre [54]) to partition the compositional β-diversity into two components: species richness difference and species replacement. The gen-eral termβ-diversity refers to the total compositional change between two communities irre-spective of the process that originated each. The term“species richness difference”refers to the relative difference between the number of species that each site supports irrespective of any potential nestedness. In other words, it refers to the fact that one community may include a larger number of species than another, which may be due to various ecological processes [54]. The term“species replacement”indicates that one or more species present in one site are substituted by different species at another site. It refers to the well-known fact that species tend to replace each other along ecological gradients that are sufficiently long [54]. The two terms are therefore additive and can be generally defined as:
b diversity¼species replacementþspecies richness difference
The total compositional beta diversity between row cells is given by the Jaccard dissimilarity index:
bcc ¼ ðbþcÞ=ðaþbþcÞ
species exclusive to thefirst sampling unit and to the second sampling unit, respectively.βccis
bounded between zero (perfect similarity) and one (maximum possible dissimilarity). This proportional measure can be partitioned into its replacement and richness difference compo-nent as given below [23,53].
The species richness difference between two sampling units is given by:
brich¼ jb cj=ðaþbþcÞ
The replacement component, i.e. the substitution of n species in a given sampling unit from n species in another site, is defined using theβ-3[55]:
b 3¼2minðb cÞ=ðaþbþcÞ
where min(b,c) is the minimum number of exclusive species. This quantity is multiplied by 2 because each substitution involves two different species.
The indices were computed using the“vegdist”function in the package vegan version 3.2–5 [56] for R version 3.2.0 [57].
Spatial autocorrelation
The pattern and significance of spatial autocorrelation across different geographical distance lags were examined using Mantel correlograms [58]. First, we created a geographical distance matrix between the 48 USA states (see below). Second, we divided the distance matrix into five distance classes using Sturge’s rule [59]. Mantel correlation coefficients were calculated for each distance class and tested for significance with a permutation test (n = 9999) based on a progressive Bonferroni correction (alpha = 0.05 [59]). As the Mantel correlogram was com-puted on a dissimilarity matrix (β-diversity), we coded the second distance matrix such that negative significant values of Mantel statistics corresponded to an increase in dissimilarity. On the other hand, positive significant values indicate that the communities are more similar than expected by chance (i.e. low beta-diversity). The response matrices were the replacement and species richness difference variables for bark and ambrosia beetles separately. All Mantel analy-ses were performed using the“mantel.correlog”function with default settings in the vegan package [56] implemented in R.
Spatial patterns
To visualize the similarity patterns of non-native and native bark and ambrosia beetle commu-nities of the USA states, we performed non-metric multidimensional scaling (NMDS) ordina-tion using the funcordina-tion“metaMDS”(distance =“jaccord”, K = 2) in the vegan package [56]. We used NMDS because unlike methods which attempt to maximize the variance or corre-spondence between objects in an ordination, it attempts to represent−as closely as possible— the pairwise dissimilarity between objects in a low-dimensional space [59].
Correlates
We included in the analyses several variables that can help explain species richness differences and species replacement among different USA states. For each USA state, these variables are indicative of the geographical distance, the volume of international trade (imports), and the environment (forest and climate).
matrix between the sampling units using the“earth.dist”function in the fossil package version 0.3.7 [60] for R.
International trade. Wood packaging materials, such as pallets, inadvertently represent one of the most common means through which bark and ambrosia beetles are transported in international trade [29]. Total imports (IMP) are therefore expected to be more related to the potential introduction of non-native scolytines than simply imports of wood products (e.g., lumber). For this reason, we used the difference in log-transformed total value of imports between USA states as a proxy for the number of non-native scolytines. We acquired data on the average value of goods imported during the period 2008-2010 from official economic statis-tics of the USA (Economic Census Bureau, US International Trade in Goods and Service FT900). We used data for the final destination of the imports rather than the first point of arrival because the vast majority of imports arrive in shipping containers that are not opened until they reach their final destination. See Marini et al. [8] for more details about the selection of this metric. We used the arithmetic difference between states to compute the distance matrix for import.
Environmental distances. Two distance matrices based on two climatic variables were used based on monthly data: mean annual temperature (TEMP) and mean annual precipita-tion (RAIN). Both were derived from the WorldClim database and corresponded to the biocli-matic variables BIO6 and BIO12 respectively ([61]; 1 km resolution;1960-1990 period). Both variables were averaged within each USA state. Moreover, we included in the analyses a dis-tance matrix based on forest vegetation differences (FOR) between states using the Bray-Curtis dissimilarity index. We retrieved current information on the area covered by 31 forest type cat-egories from the USDA Forest Service, Forest Inventory Data Online (FIDO) [62]. Each cate-gory is defined as a physiognomically uniform group of plant associations sharing one or more dominant tree species. The FOR variable indicated whether two states are similar or different based on the number of forest types which are shared between them or are exclusive to either state. In addition, we considered the difference in extent (size) of area covered by forests per state, after the variable AREA was log-transformed to improve linearity and homogeneity of residual variance. All environmental matrices were calculated using the“vegdist”function in the vegan package [56] for R.
Analyses of correlates of species richness difference and species
replacement
We used multiple regression on distance matrices (MRM) [63] to test the overall direction and the shape of the association of the single environmental and geographical correlates on species richness differences (βrich) and species replacement (β-3). MRM performs regression between a response matrix and any number of explanatory matrices. Each explanatory matrix contained distances or similarities between all pairwise combinations of the 48 USA states of ecological and environmental factors, or other attributes such as imports. Tests of statistical significance were done by permutation [64]. MRM allows for the inclusion of quadratic terms in the model to account for non-linearity in the relationships. For each predictor we tested both linear and quadratic terms. All environmental and geographical correlate matrices were standardized using the function‘stdize’in the MuMIn package version 1.15.6 for R. The MRM analysis was carried out with the‘MRM’function in the ecodist package version 1.2.9 [65] for R.
Second, we used hierarchical partitioning (HP) [66] to evaluate the relative importance of explanatory distance matrices in explaining variation in species richness differences (βrich) and species replacement (β-3). HP jointly considers all possible models in a multiple regression and
variable into a joint effect together with the other explanatory variables into an independent effect not shared with any other variable. HP was computed using the hier.part package version 1.0–3 [67] implemented in R. The estimated relative importance of each variable was repre-sented by the size of its individual effect.
Results
Species richness difference and species replacement
A total of 480 scolytine species were analyzed for the continental USA, including 43 non-native and 437 native species. The number of non-native ambrosia beetles was higher than that of non-native bark beetles (25 and 18, respectively), whereas there were many more native bark beetles (387) than native ambrosia beetles (50). For both native bark beetles and non-native ambrosia beetles we found a mean value ofβrichgreater thanβ-3(0.30 vs. 0.16 and 0.50 vs 0.17, respectively), i.e. species richness differences contribute more than species replacement to differentiate non-native bark and ambrosia beetle communities at the scale of USA states. For both native bark and ambrosia beetles we found similar values between species richness difference and species replacement, withβ-3slightly higher thanβrichboth for bark beetles (0.41 vs. 0.36) and ambrosia beetles (0.35 vs. 0.33).
Spatial autocorrelation
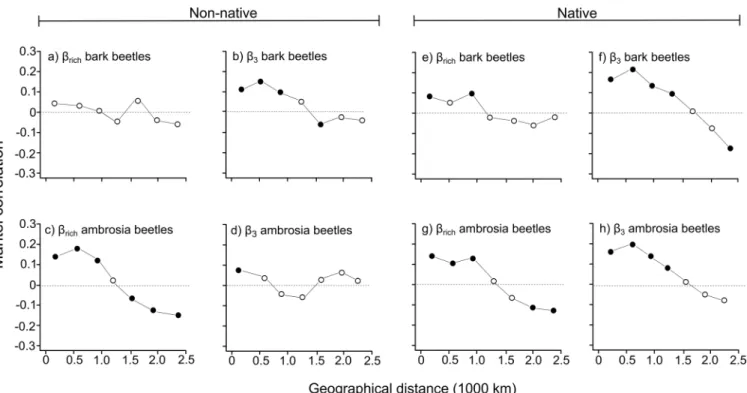
When non-native bark beetle species were considered, the Mantel correlogram forβrichshowed no clear spatial trend (Fig 1A); forβ-3, instead, a significant positive autocorrelation at the
smallest lag distance classes, indicating that neighboring states had similar non-native bark beetle species composition, and a significant negative autocorrelation at medium distance class were apparent (Fig 1B). The Mantel correlogram computed forβrichof non-native ambrosia beetle showed significant and positive autocorrelation at the smallest lag distance classes and a significant but negative autocorrelation at highest lag distance classes (Fig 1C), indicating that neighboring states had similar non-native ambrosia beetle species richness, whereas communi-ties located in distant states were characterized by a different number of species. For theβ-3of non-native ambrosia beetle, only a significant and positive autocorrelation at the smallest dis-tance class occurred (Fig 1D), indicating that neighboring states had a similar non-native bark beetle species composition whereas no clear trend was identified when the distance between states increased.
When native bark beetle species were evaluated, the Mantel correlogram forβrichshowed a
Spatial patterns
For non-native bark beetles, the visual inspection of the NMDS ordination plot did not provide a clear spatial pattern of similarity, although a tendency of neighboring states to have similar or identical species communities (e.g. Mississippi, Georgia, South Carolina, and Louisiana in the South or New York, Maine, Massachusetts, and New Hampshire in the North East) is apparent (Fig 2A). For non-native ambrosia beetles, visual inspection of the NMDS ordination plot showed clusters of various states located in the Northeast, South, and West, clearly distin-guished from North Dakota, Wyoming, and Oklahoma (Fig 2B). For both native bark and ambrosia beetles there was a general dissimilarity among states located in the west with those located in the other regions of the USA (Fig 2C and 2D).
Analyses of correlates of species richness difference and species
replacement
For the non-native bark beetle species, we found a significant negative non-linear relationship betweenβrichand environmental distances (rainfall and forest vegetation), and a positive linear relationship with import distances (Table 1AandFig 3), indicating that the greater the differ-ence between two states in terms of import volume, the greater the differdiffer-ence in non-native bark beetle species richness. Moreover, we found a significant and positive relationship betweenβ-3of non-native bark beetles and both geographical distance (linear) and environ-mental distances (non-linear for temperature, linear for rainfall and forest vegetation) (Table 1AandFig 3), indicating that the higher the geographical distance or the difference in terms of mean annual temperature, mean annual rainfall and forest vegetation between two states, the greater the difference in the scolytine communities in terms of species composition.
Fig 1. Mantel correlogram for non-native and native bark and ambrosia beetle dissimilarity usingβrichandβ-3.Solid circles indicate significant positive or negative correlations (based on sequential Bonferroni corrections withα= 0.05) between compositional dissimilarity and geographical distance (based on longitude and latitude of centroid of the different USA states). Open circles indicate non-significant correlation.
For the non-native ambrosia beetle species, we found a significant hump-shaped relation-ship betweenβrichand geographical distance, a non-linear relationship with temperature dis-tance, and a positive linear relationship betweenβrichand rainfall and import differences
(Table 1AandFig 3), indicating that the greater the difference in terms of mean annual tem-perature, mean annual rainfall, and forest composition between two states, the greater will be the differences in non-native ambrosia beetle species richness. Moreover, for non-native ambrosia beetle species, we found a negative linear relationship between theirβ-3and rainfall
distances (Table 1AandFig 3), and a non-linear relationship with temperature distances. For the native bark beetle species, we found a significant positive relationship betweenβrich
and both geographical and forest cover area distances (Table 1BandFig 3), indicating that the greater the geographical distance and the differences in terms of forest cover area between two states, the greater the difference in native bark beetle species richness. Furthermore, we found a non-linear relationship betweenβrichand forest vegetation distances (Fig 3), indicating that
dif-ferences in native bark beetle species richness are evident only among states that differ consid-erably in terms of forest vegetation. Moreover, we found a positive relationship betweenβ-3
and all the environmental distances (linear for temperature and rainfall, non-linear for forest vegetation), as well as a negative linear relationship with forest cover area (Table 1BandFig 3). These findings indicated that the greater the differences in terms of mean annual temperature, mean annual amount of rainfall, and forest composition between two states, the more the native bark beetle communities differ in terms of species composition, whereas the opposite trend occurs for forest cover area. A similar trend was found for native ambrosia beetlesβ-3
(except for forest cover area), whereas theirβrichwas significantly and positively associated
Fig 2. NMDS ordination plots based on Jaccard dissimilarities for non-native and native bark and ambrosia beetles communities of the 48 USA states (black dots).USA regions are distinguished following the Census Bureau definition; states are listed in alphabetical order. Given that non-native ambrosia beetles are not recorded in Minnesota, we removed the latter state from the analysis regarding this group of beetles.
only with rainfall (linear), forest vegetation (linear) and geographical distances (non-linear) (Table 1BandFig 3).
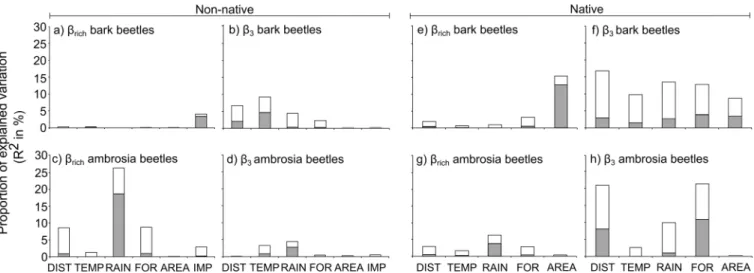
Concerning the relative importance of the correlates, the results showed thatβrichof
non-native bark beetles was mainly explained by the differences in the volume of imported com-modities between states (Fig 4A), whereas the difference in the mean annual temperature was the main explanatory variable for theirβ-3, followed by geographical distance and mean annual amount of rainfall (Fig 4B). For non-native ambrosia beetles,βrichwas mainly explained by
dif-ferences in mean annual rainfall between states (Fig 4C), whileβ-3was influenced by both mean annual rainfall and mean annual temperature differences (Fig 4D). Concerning native bark beetle species,βrichwas mainly explained by difference in forest cover area (Fig 4E), whereas theβ-3was strongly influenced by both environmental (differences in mean annual
temperature, mean annual rainfall, and forest vegetation) and geographical distances (Fig 4F). The same correlates were the main explanatory variables for native ambrosia beetle species βrich(Fig 4G), whereas theirβ-3was mainly influenced by the geographical distance and the dif-ferences in forest vegetation and mean annual amount of rainfall (Fig 4H).
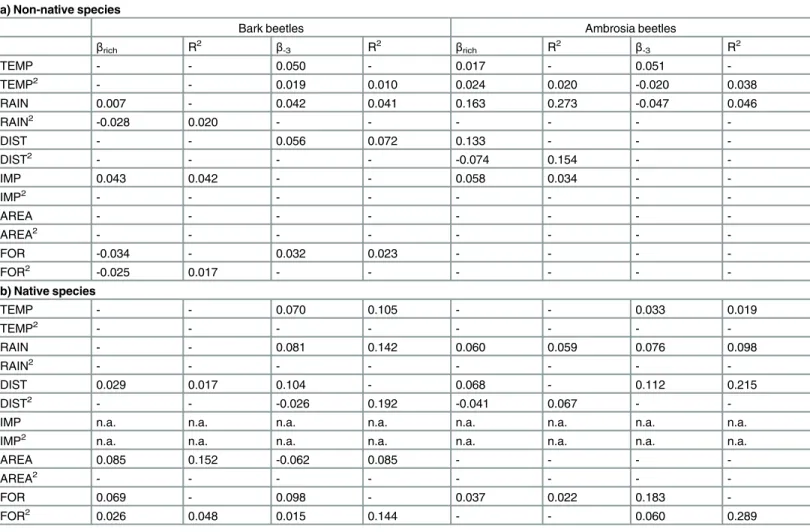
Table 1. Results of the regression on distance matrices testing the effect of the geographical, environmental, and human-related distances on
βrichandβ-3for both non-native and native scolytines in the United States, presented separately for bark and ambrosia beetles.The significance of the slopes was evaluated by a permutation test (n = 9999). For each predictor both linear and quadratic terms were tested. R2indicates the cumulative
varia-tion explained by the linear term alone or by the linear and quadratic terms together. Only significant terms are reported (P<0.01). Abbreviations: DIST: geo-graphical distance; TEMP: difference in temperature; RAIN: difference in rainfall; FOR: difference in forest vegetation; AREA: difference in forest cover area; IMP: difference in import volume. AREA and IMP were log-transformed. SeeMaterials and Methodsfor details on the above parameters.
a) Non-native species
Bark beetles Ambrosia beetles
βrich R2 β-3 R2 βrich R2 β-3 R2
TEMP - - 0.050 - 0.017 - 0.051
-TEMP2 - - 0.019 0.010 0.024 0.020 -0.020 0.038
RAIN 0.007 - 0.042 0.041 0.163 0.273 -0.047 0.046
RAIN2 -0.028 0.020 - - -
-DIST - - 0.056 0.072 0.133 - -
-DIST2 - - - - -0.074 0.154 -
-IMP 0.043 0.042 - - 0.058 0.034 -
-IMP2 - - -
-AREA - - -
-AREA2 - - - - - - -
-FOR -0.034 - 0.032 0.023 - - -
-FOR2 -0.025 0.017 - - -
-b) Native species
TEMP - - 0.070 0.105 - - 0.033 0.019
TEMP2 - - - - - - -
-RAIN - - 0.081 0.142 0.060 0.059 0.076 0.098
RAIN2 - - - - - - -
-DIST 0.029 0.017 0.104 - 0.068 - 0.112 0.215
DIST2 - - -0.026 0.192 -0.041 0.067 -
-IMP n.a. n.a. n.a. n.a. n.a. n.a. n.a. n.a.
IMP2 n.a. n.a. n.a. n.a. n.a. n.a. n.a. n.a.
AREA 0.085 0.152 -0.062 0.085 - - -
-AREA2 - - - - - - -
-FOR 0.069 - 0.098 - 0.037 0.022 0.183
-FOR2 0.026 0.048 0.015 0.144 - - 0.060 0.289
Discussion
In the USA, when considering all established non-native tree-feeding insects, there is a notable concentration in the northeast, with decreasing numbers to the west and south [31]. This trend has been shown for different groups of invasive organisms [31], but for scolytines the mecha-nisms of invasion and the factors shaping their communities are still largely understudied. Our large-scale study elucidates some of these aspects, supporting the hypothesis that differential
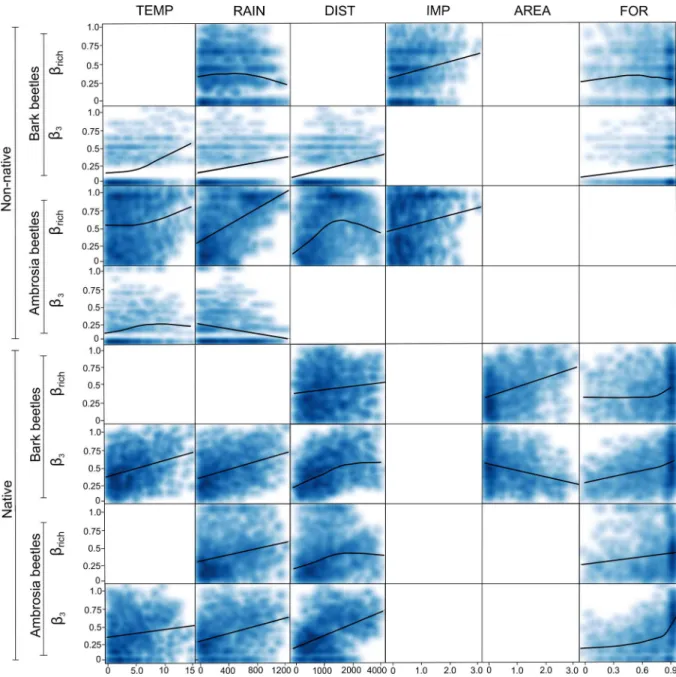
Fig 3. Scatterplot of the relationship for species richness difference (βrich) and species replacement (β-3) versus
geographical, environmental, and human-related distances for both non-native and native bark and ambrosia beetles in the continental USA.The fitted lines are computed by“local regression”(Loess) which is a nonparametric fitting technique that does not require an a priori specification of the relationship between the dependent and independent variables [68]. The scatterplot is a smoothed shade density representation obtained through a kernel density (function‘smoothScatter’in graphics version 3.4.0 package in R).
establishment and spread of bark and ambrosia beetles was likely influenced by their feeding habit and climatic factors in the new environment.
For non-native bark beetles, we found that the species pool at the state level differs more in terms of species richness than species replacement, but only the latter component showed a spatial autocorrelation, indicating a higher similarity among communities of neighboring states. This scenario may reflect a discontinuous invasion process composed of long distance jumps or multiple introduction events, supported by the lack of a spatial trend in species rich-ness differences, and short-distance movements, supported by the similar species composition of neighboring states. Multiple introductions and human-assisted dispersal have already been identified as key processes for the establishment and spread of non-native insects throughout wide areas [33–37], and for wood-boring beetles these mechanisms are often related either to movement of imported goods and associated wood-packaging materials towards their final destinations [69] or firewood carried by visitors to recreational areas or vacation properties [70,71]. Bark beetles can, however, also spread naturally in areas surrounding the initial point of entry exploiting their ability to fly long distances [39,72], and this might help explain why states close to each other present similar communities. Analyzing in more detail the correlates of the two components ofβ-diversity, we found that differences in import volume mainly explained species richness differences, whereas differences in temperature mainly explained species replacement. Although the effect of import volume on the number of established bark beetles was previously highlighted by Marini et al. [8], the effect of temperature on species replacement between states was still unclear. This relationship may be influenced by environ-mental requirements of bark beetles [73] and their associates, such as fungi, bacteria, nema-todes, and mites that can significantly influence bark beetle fitness [74,75]. For example, each fungal associate often possesses different thermal optima for growth, and variation in seasonal temperatures can influence which fungal species are ultimately vectored by dispersing bark beetles [76–78], thereby helping to shape the communities of non-native bark beetles. In gen-eral, such patterns were slightly different compared to those of native bark beetles. In particu-lar, native species replacement followed the distance decay rule of similarity, with decreasing similarity between communities with increasing distance between them [32]. Scolytine species
Fig 4. The independent (white) and shared (grey) contributions estimated from hierarchical partitioning of each explanatory variable for species richness differences and species replacement of non-native and native bark and ambrosia beetle in the USA.Abbreviations: DIST: geographical distance; TEMP: difference in temperature; RAIN: difference rainfall; FOR: difference in forest vegetation; AREA: difference in forest cover area; IMP: difference in import volume. AREA and IMP were log-transformed.
that are native to a given area are likely well-adapted to the local climatic conditions, thus, as the climatic conditions change, the pool of host plants and native scolytines also changes. The significant role of geographical distance and environmental factors in explaining the species replacement of native bark beetles supports this trend.
For non-native ambrosia beetles, we found that the communities differed mainly in terms of species richness. Furthermore, we found a clear spatial autocorrelation for this component, repre-sented by gradual species richness changes with increasing geographical distance. This situation may reflect a more continuous invasion process, with the pool of non-native species arriving in the coastal areas that tends to be filtered as they spread, either naturally or assisted by humans, to internal portions of the continental USA. Such differences in species richness appeared to be pri-marily associated with differences in amount of rainfall between states. Ambrosia beetles are strictly dependent on their symbiotic fungi, which need certain conditions to grow and develop [79–81]. This dependency appears to limit the geographic distribution of many species of ambro-sia beetles to wetter and warmer regions of the USA [8]. For example, much of the central and interior western parts of the USA are characterized by significantly lower rainfall as compared to the eastern USA [63], which appears to restrict establishment and spread of many non-native ambrosia beetles [8,80]. For native ambrosia beetles, instead, we found slightly different patterns. For both species richness differences and species replacement, there was a tendency for the values to decrease as distance between states increased. If species richness differences were mainly explained by rainfall differences, which is related to the strong dependence that ambrosia beetles have on climate [8,80], then species replacement was primarily influenced by geographical dis-tance and differences in forest composition. Although the effect of the geographical disdis-tance could be expected [32], that of forest composition might be somewhat unexpected given that most ambrosia beetles are rather polyphagous in terms of host plants colonized [79,81]. It is rea-sonable to think that ambrosia beetle species that are native within a given area are more adapted to certain habitats and hosts than others, thus, as the composition and characteristics of forest stands change, the ambrosia beetles communities also change.
Supporting Information
S1 Table. List of non-native bark and ambrosia beetle species considered in this study.For each species the key reference reporting the first finding in the USA is indicated.
(DOC)
Acknowledgments
We thank all the participants of the USDA Forest Service“Early Detection and Rapid
Response”project for access to the USA scolytine collection data for 2007-2010. We also thank Deborah G. McCullough and two anonymous reviewers for comments on an earlier draft of this manuscript.
Author Contributions
Conceived and designed the experiments: DR LM. Performed the experiments: DR LM. Ana-lyzed the data: DR LM. Contributed reagents/materials/analysis tools: RJR RAH. Wrote the paper: DR MF RAH RJR EPT AB LM.
References
1. Aukema JE, Leung B, Kovacs K, Chivers C, Britton K, Englin J, et al. Economic impacts of non-native forest insects in the continental United States. PloS One. 2011; 6: e24587. doi:10.1371/journal.pone. 0024587PMID:21931766
2. Holmes PT, Aukema JE, Von Holle B, Liebhold A, Sills E. Economic impacts of invasive species in for-est: past, present and future. Ann N Y Acad Sci. 2009; 1162: 18–38. doi:10.1111/j.1749-6632.2009. 04446.xPMID:19432643
3. Brockerhoff EG, Bain J, Kimberley MO, Knizek M. Interception frequency of exotic bark and ambrosia beetles (Coleoptera: Scolytinae) and relationship with establishment in New Zealand and worldwide. Can J For Res. 2006; 36: 289–298.
4. Haack RA. Exotic bark- and wood-boring Coleoptera in the United States: recent establishments and interceptions. Can J For Res. 2006; 36: 269–288.
5. Levine JM, D’Antonio CM. Forecasting biological invasions with increasing international trade. Conserv Biol. 2003; 17: 322–326.
6. Lin W, Zhou G, Cheng X, Xu R. Fast economic development accelerates biological invasions in China. PLoS One. 2007; 2: e1208. PMID:18030342
7. Hulme PE. Trade, transport and trouble: managing invasive species in an era of globalization. J Appl Ecol. 2009; 46: 10–18.
8. Marini L, Haack RA, Rabaglia RJ, Petrucco Toffolo E, Battisti A, Faccoli M. Exploring associations between international trade and environmental factors with establishment patterns of alien Scolytinae. Biol Invasions. 2011; 13: 2275–2288.
9. Bacon SJ, Bacher S, Aebi A. Gaps in border controls are related to quarantine alien insect invasions in Europe. PLoS One. 2012; 7: e47689. doi:10.1371/journal.pone.0047689PMID:23112835
10. Pyšek P, Jarošík V, Hulme PE, Kühn I, Wild J, Arianoutsou M, et al. Disentangling the role of environ-mental and human pressures on biological invasions across Europe. Proc Natl Acad Sci USA. 2010; 107: 12157–12162. doi:10.1073/pnas.1002314107PMID:20534543
11. Leprieur F, Olden JD, Lek S, Brosse S. Contrasting patterns and mechanisms of spatial turnover for native and exotic freshwater fish in Europe. J Biogeogr. 2009; 36: 1899–1912.
12. Winter M, Schweiger O, Klotz S, Nentwig W, Andriopoulos P, Arianoutsou M, et al. Plant extinctions and introductions lead to phylogenetic and taxonomic homogenization of the European flora. Proc Natl Acad Sci USA. 2009; 106: 21721–21725. doi:10.1073/pnas.0907088106PMID:20007367
13. Marini L, Bertolli A, Bona E, Federici G, Martini F, Prosser F, et al. Beta-diversity patterns elucidate mechanisms of alien plant invasion in mountains. Glob Ecol Biogeogr. 2012; 22: 450–460.
15. Tuomisto H, Ruokolainen K. Analyzing or explaining beta diversity? Understanding the targets of differ-ent methods of analysis. Ecology. 2006; 87: 2697–2708. PMID:17168014
16. Legendre P, Borcard D, Peres-Neto PR. Analyzing or explaining beta diversity? Comment. Ecology. 2008; 89: 3238–3244.
17. Tuomisto H, Ruokolainen K. Analyzing or explaining beta diversity? Reply. Ecology. 2008; 89: 3244– 3256.
18. Gilbert B, Bennett JR. Partitioning variation in ecological communities: do the numbers add up? J Appl Ecol. 2010; 47: 1071–1082.
19. Smith TW, Lundholm JT. Variation partitioning as a tool to distinguish between niche and neutral pro-cesses. Ecography. 2010; 33: 648–655.
20. Vellend M, Srivastava DS, Anderson KM, Brown CD, Jankowski JE, Kleynhans EJ, et al. Assessing the relative importance of neutral stochasticity in ecological communities. Oikos. 2014; 123: 1420–1430.
21. Whittaker RH. Vegetation of the Siskiyou Mountains, Oregon and California. Ecol Monogr. 1960; 30: 279–338.
22. Baselga A. Partitioning the turnover and nestedness components of beta diversity. Glob Ecol Biogeogr. 2010; 19: 134–143.
23. Podani J, Schmera D. A new conceptual and methodological framework for exploring and explaining pattern in presence-absence data. Oikos. 2011; 120: 1625–1638.
24. Baselga A. The relationship between species replacement, dissimilarity derived from nestedness, and nestedness. Glob Ecol Biogeogr. 2012. 21; 1223–1232.
25. Tuomisto H. A diversity of beta diversities: straightening up a concept gone awry. Part 2. Quantifying beta diversity and related phenomena. Ecography. 2010; 33: 23–45.
26. Wood SL. The bark and ambrosia beetles of North and Central America (Coleoptera: Scolytidae), a tax-onomic monograph. Gt Basin Nat Mem. 1982; 6: 1–1359.
27. Haack RA. Intercepted Scolytidae (Coleoptera) at U.S. ports of entry: 1985–2000. Integr Pest Manage Rev. 2001; 6: 253–282.
28. Liebhold AM, Work TT, McCullough DG, Cavey JF. Airline baggage as a pathway for alien insect spe-cies invading the United States. Am Entomol. 2006; 52: 48–54.
29. Haack RA, Britton KO, Brockerhoff EG, Cavey JF, Garrett LJ, Kimberley M, et al. Effectiveness of the International Phytosanitary Standard ISPM No. 15 on reducing wood borer infestation rates in wood packaging material entering the United States. PLoS ONE. 2014; 9: e96611. doi:10.1371/journal. pone.0096611PMID:24827724
30. Liebhold AM, Tobin PC. Population ecology of insect invasions and their management. Annu Rev Ento-mol. 2008; 53: 387–408. PMID:17877456
31. Liebhold AM, McCullough DG, Blackburn LM, Frankel SJ, Von Holle B, Aukema JE. A highly aggre-gated geographical distribution of forest invasions in the USA. Divers Distrib. 2013; 19: 1208–1216.
32. Nekola JC, White PS. Distance decay of similarity in biogeography and ecology. J Biogeogr. 1999; 26: 867–878.
33. Robinet C, Roques A, Pan H, Fang G, Ye J, Zhang Y, et al. Role of human-mediated dispersal in the spread of the pinewood nematode in China. PLoS ONE. 2009; 4: e4646. doi:10.1371/journal.pone. 0004646PMID:19247498
34. Koch FH, Yemshanov D, Colunga-Garcia M, Magarey RD, Smith WD. Potential establishment of alien-invasive forest insect species in the United States: where and how many? Biol Invasions. 2011; 13: 969–985.
35. Huang D, Zhang R, Kim KC, Suarez AV. Spatial pattern and determinants of the first detection locations of invasive alien species in Mainland China. PLoS ONE. 2012; 7: e31734. doi:10.1371/journal.pone. 0031734PMID:22363715
36. Yemshanov D, Koch FH, Ducey M, Koehler K. Trade-associated pathways of alien forest insect entries in Canada. Biol Invasions. 2012; 14: 797–812.
37. Hu SJ, Ning T, Fu DY, Haack RA, Zhang Z, Chen D, et al. Dispersal of the Japanese Pine Sawyer,
Monochamus alternatus(Coleoptera; Cerambycidae), in mainland China as inferred from molecular data and associations to indices of human activities. PLoS ONE. 2013; 8: e57568. doi:10.1371/ journal.pone.0057568PMID:23469026
38. Robinet C, Van Opstal N, Baker R, Roques A. Applying a spread model to identify the entry points from which the pine wood nematode, the vector of pine wilt disease, would spread most rapidly across Europe. Biol Invasions. 2011; 13: 2981–2995.
40. Jacobi WR, Hardin JG, Goodrich BA, Cleaver CM. Retail firewood can transport live tree pests. J Econ Entomol. 2012; 105: 1645–1658. PMID:23156161
41. FløD, Krokene P,Økland B. Importing deciduous wood chips from North America to northern Europe– the risk of introducing bark-and wood-boring insects. Scand J For Res. 2014; 29: 77–89.
42. Keddy PA. Assembly and response rules: two goals for predictive community ecology. J Veg Sci. 1992; 3: 157–164.
43. Bussler H, Bouget C, Brustel H, Brändle M, Riedinger V, Brandl R, et al. Abundance and pest classifica-tion of scolytid species (Coleoptera: Curculionidae, Scolytinae) follow different patterns. For Ecol Man-age. 2011; 262: 1887–1894.
44. Wood SL. Introduced and exported American Scolytidae (Coleoptera). Gt Basin Nat Mem. 1977; 37: 67–74.
45. Wood SL, Bright DE. A catalog of Scolytidae and Platypodidae (Coleoptera), Part 2: taxonomic index. Great Basin Nat Mem. 1992; 13: 1–1553.
46. Bright DE, Skidmore RE. A catalog of Scolytidae and Platypodidae (Coleoptera) Supplement 1 (1990-1994). Ottawa: National Research Council Press; 1997.
47. Bright DE, Skidmore RE. A catalog of Scolytidae and Platypodidae (Coleoptera) Supplement 2 (1995– 1999). Ottawa: National Research Council Press; 2002.
48. Rabaglia RJ, Dole SA, Cognato AI. Review of American Xyleborina (Coleoptera: Curculionidae: Scoly-tinae) occurring North of Mexico, with an illustrated key. Ann Entomol Soc Am. 2006; 99: 1034–1056.
49. Cognato AI, Barc N, Philip M, Mech R, Smith AD, Galbraith E, et al. The native and introduced ambrosia beetles of Michigan (Coleoptera: Curculionidae, Scolytinae). Great Lakes Entomol. 2009; 42: 101– 120.
50. Haack RA, Rabaglia RJ. Non-native bark and ambrosia beetles in the USA: potential and current invad-ers. In: Peña JE, editor. Potential invasive pests of agricultural crops. Wallingford, UK: CAB
Interna-tional; 2013. pp. 48–74
51. Rabaglia RJ, Duerr D, Acciavatti RE, Ragenovich I. Early detection and rapid response for non-native bark and ambrosia beetles. US Department of Agriculture Forest Service, Forest Health Protection, 2008.
52. Kirkendall LR, Biedermann PH, Jordal BH. Evolution and diversity of bark and ambrosia beetles. In: Vega FE, Hofstetter RW, editors. Bark beetles: biology and ecology of native and invasive species. San Diego, California: Academic Press; 2015. pp. 85–156.
53. Carvalho JC, Cardoso P, Gomes P. Determining the relative roles of species replacement and species richness differences in generating beta-diversity patterns. Glob Ecol Biogeogr. 2012; 21: 760–771.
54. Legendre P. Interpreting the replacement and richness difference components of beta diversity. Glob Ecol Biogeogr. 2014; 11: 1324–1334.
55. Cardoso P, Borges PAV, Veech JA. Testing the performance of beta diversity measures based on inci-dence data: the robustness to undersampling. Divers Distrib. 2009; 15: 1081–1090.
56. Oksanen J, Blanchet FG, Kindt R, Legendre P, Minchin PR, O'Hara RB, et al. vegan: Community Ecol-ogy Package. R package version 2.0–3. 2012;http://CRAN.R-project.org/package=vegan.
57. R Core Team. R: A language and environment for statistical computing. R Foundation for Statistical Computing, Vienna, Austria. 2014;http://www.R-project.org/.
58. Borcard D, Legendre P. Is the Mantel correlogram powerful enough to be useful in ecological analysis? A simulation study. Ecology. 2012; 93: 1473–1481. PMID:22834387
59. Legendre P, Legendre L. Numerical Ecology. Amsterdam: Elsevier; 1998.
60. Vavrek MJ. fossil: palaeoecological and palaeogeographical analysis tools. 2012;http:// matthewvavrek.com/programs-and-code/fossil/.
61. Hijmans RJ, Cameron SE, Parra JL, Jones PG, Jarvis A. Very high resolution interpolated climate sur-faces for global land areas. Int J Climatol. 2005; 25: 1965–1978.
62. USDA–FS (US Department of Agriculture–Forest Service). Forest inventory data online (FIDO) Version 131r0. 2010;http://fiatools.fs.fed.us/fido/index.html.
63. Lichstein JW. Multiple regression on distance matrices: a multivariate spatial analysis tool. Plant Ecol. 2007; 188: 117–131.
64. Legendre P, Lapointe F, Casgrain P. Modeling brain evolution from behavior: A permutational regres-sion approach. Evolution. 1994; 48: 1487–1499.
65. Goslee SC, Urban DL. The ecodist package for dissimilarity-based analyses of ecological data. J Stat Softw. 2007; 22: 1–19.
67. Walsh C, Mac Nally R. hier.part: Hierarchical Partitioning. R package version 1.0–3. 2008;http://www. inside-r.org/packages/hier-part.
68. Jacoby WG. Loess: a nonparametric, graphical tool for depicting relationships between variables. Elect Stud. 2000; 19: 577–613.
69. Rassati D, Faccoli M, Marini L, Haack RA, Battisti A, Petrucco Toffolo E. Exploring the role of wood waste landfills in early detection of non-native wood-boring beetles. J Pest Sci. 2015; 88: 563–572.
70. Jacobi WR, Hardin JG, Goodrich BA, Claver CM. Retail firewood can transport live tree pests. J Econ Entomol. 2012; 105: 1645–1658. PMID:23156161
71. Koch FH, Yemshanov D, Haack RA, Magarey RD. Using a network model to assess risk of forest pest spread via recreational travel. PLoS ONE. 2014; 9: e102105. doi:10.1371/journal.pone.0102105 PMID:25007186
72. Rassati D, Faccoli M, Petrucco Toffolo E, Battisti A, Marini L. Improving the early detection of alien wood-boring beetles in ports and surrounding forests. J Appl Ecol. 2015; 52: 50–58.
73. Lombardero MJ, Ayres MP, Ayres BD, Reeve JD. Cold tolerance of four species of bark beetle (Coleop-tera: Scolytidae) in North America. Environ Entomol. 2000; 29: 421–432.
74. Hofstetter RW, Cronin JT, Klepzig KD, Moser JC, Ayres MP. Antagonisms, mutualisms and commen-salisms affect outbreak dynamics of the southern pine beetle. Oecologia. 2006; 147: 679–691. PMID: 16323015
75. Cardoza YJ, Moser JC, Klepzig KD, Raffa KF. Multipartite symbioses among fungi, mites, nematodes, and the spruce beetle,Dendroctonus rufipennis. Environ Entomol. 2008; 37: 956–963. PMID: 18801261
76. Rice AV, Thormann MN, Langor DW. Mountain pine beetle‐associated blue‐stain fungi are differentially adapted to boreal temperatures. For Pathol. 2008; 38: 113–123.
77. Dysthe JC, Bracewell R, Six DL. Temperature effects on growth of fungal symbionts of the western pine beetle,Dendroctonus brevicomis. Fungal Ecol. 2015; 17, 62–68.
78. Six DL, Bentz BJ. Temperature determines symbiont abundance in a multipartite bark beetle-fungus ectosymbiosis. Microb Ecol. 2007; 54: 112–118. PMID:17264992
79. Hulcr J, Beaver RA, Puranasakul W, Dole SA, Sonthichai S. A comparison of bark and ambrosia beetle communities in two forest types in Northern Thailand (Coleoptera: Curculionidae; Scolytinae and Platy-podinae). Environ Entomol. 2008; 37: 1461–147. PMID:19161689
80. Reich RM, Lundquist JE, Acciavatti R. Influence of climatic conditions and elevation on the spatial distri-bution and abundance ofTrypodendronambrosia beetles (Coleoptera: Curculionidae: Scolytinae) in Alaska. For Sci. 2014; 60: 308–316.
81. Hulcr J, Mogia M, Isua B, Vojtech N. Host specificity of ambrosia and bark beetles (Col., Curcuilonidae: Scolyitinae and Platypodinae) in a New Guinea rainforest. Ecol Entomol. 2007; 32: 762–772.