The new international financial crisis:
causes, consequences and perspectives
FLAVIO VILELA VIEIRA*
The paper investigates the recent financial crisis within a historical and compar-ative perspective having in mind that it is ultimately a confidence crisis, initially as-sociated to a chain of high risk loans and financial innovations that spread thorough the international system culminating with impressive wealth losses. The financial market will eventually recover from the crisis but the outcome should be followed by a different and more disciplined set of international institutions. There will be a change on how we perceive the widespread liberal argument that the market is al-ways efficient, or at least, more efficient than any State intervention, overcoming the false perception that the State is in opposition to the market. A deep financial crisis brings out a period of wealth losses and an adjustment process characterized by price corrections (commodities and equity price deflation) and real effects (recession and lower employment), and a period of turbulences and end of illusions is in place.
Keywords: financial crisis; globalization; advanced and emerging economies. JEL Classification: G15; F33; N20.
INTRODUCTION
The main goal of this work is to review financial crises on a historical perspec-tive to subsidize the understanding of the international financial crisis of the new century with special attention to the lessons from the crash of 1929 and how the subprime crisis is related to previous episodes.
Since the end of 2006 we have seen an enormous number of studies on differ-ent aspects and dimensions of financial crises, some of them focused on historical
* Professor of Economics, Universidade Federal de Uberlândia. E-mail: [email protected]. O autor agradece às sugestões dos pareceristas que colaboraram na revisão da versão final do trabalho, sendo que eventuais erros ou omissões são de exclusiva responsabilidade do autor. Submetido: Agosto 2008; Aprovado: Novembro 2009.
issues in a comparative perspective and others trying to understand the specificities and the eminence of a new global financial crisis. The present work tries to sum-marize some of them as part of two sets of studies, one considered as a broader investigation into the determinants of financial crises and the second pays special attention to issues related to the housing market and the financial innovation (de-rivatives) developed in this new financial architecture.
The paper is divided in three sections. The first one focuses on the financial crises literature on a historical perspective. The second one highlights recent stud-ies on the new international financial crisis and pinpoints its specificitstud-ies. The third section is devoted to evaluate the most important indicators of the U.S. and Europe housing market and other macroeconomic variables for selected advanced and emerging economies. Finally, the concluding remarks focus on the main lessons from this recent financial crisis episode.
FINANCIAL CRISES: HISTORY AND LESSONS
The crash of 1929 and the following depression of the 1930s was a period of extreme financial and real consequences to the world economy. Almost half of the banks were in bankruptcy and the equity market prices fell by 80%. The general perception was that the two crucial problems not overcome by monetary authori-ties at that time were the lack of an active and coordinated monetary policy and liquidity constraints, resulting in a world depression1. The current financial crisis is centered on disturbances in the world credit markets and the initial concern was associated to the viability of subprime mortgage loans spread around the financial system. In this situation what we have seen is that the central banks have been forced to increase liquidity in the system to avoid complete breakdown in lending operations2.
Among the key lessons of previous major financial crises, the WEO (2008) listed some of them: globalization has increased the frequency and spread of financial crises, without necessarily increasing their severity; early central bank intervention is consid-ered more effective when one thinks about limiting their spread when compared to old episodes of financial crises; during the financial crisis it is hard to forecast if it will have broader economic consequences; and there is a time discrepancy between financial innovation that can trigger a crisis and regulation measures to prevent it3.
1 See Kindleberger (1986, 1989) for a historical analysis of financial crises, including the crash of 1929 and the Great Depression.
2 The expression subprime refers to borrowers whose poor credit history does not qualify them for prime interest rates. In the United States, about 20% of mortgage originations totaling over US$1 trillion in 2005 and 2006 were subprime and are far above historical levels.
Bernanke (2000) in his work on financial crises argues that shocks to the do-mestic U.S. economy were a primary cause of both the American and world depres-sions and it is necessary to take into account the fact that the lessons from the Great Depression point out to understand the worldwide nature of the event and the channels through which a deflationary process can be spread around the world. The factors that reduced aggregate demand around the world in the 1930s are as-sociated to monetary shocks and the role they played and how such shocks were transmitted around the world during the Gold Standard era are essential elements. The author emphasizes that the worldwide monetary contraction of the early 1930s was not a passive response to declining output, but instead the result of an interac-tion of poorly designed instituinterac-tions, shortsighted policy making, and unfavorable political and economic preconditions4.
Friedman and Schwartz (1963) work on U.S. monetary history suggest a causation that starts with a monetary contraction and ends up with declining prices and output. Temin (1976, 1989) has a different point of view arguing that the contraction in money supply reflected a passive response of money to output and that the origins of the depression is mainly associated to the real side of the economy.
Eichengreen (2004) argues that there are some views associating the current international monetary and financial system as new version of the Bretton Woods one. There is a clear division in this new era of globalization where the interna-tional system incorporates a core (U.S., Western Europe and Japan), which has the privilege of issuing the currency used as international reserves, and on the other side the periphery (most emerging economies), which is committed to export-led growth policies associated to an undervalued exchange rate. What is definitely not a consensus is the idea that countries like the United States can have current ac-count deficits for a continuous time period given the argument that emerging econ-omies will be glad to accumulate dollars. The author does not agree with this new line of argument and there is no such thing as a widespread collective interest and this new monetary and financial system and it should not be compared to the Bretton Woods system. In a recent paper, Eichengreen (2008) develops the argument that the gold standard was crucial to understand why the economy was contracted by the demand side in a historical period where the countries that benefited from the gold standard were the ones engaged in significant international trade and in-vestment and have considerable economic and political power. In such an environ-ment there was room for the central banks do whatever was necessary to keep the exchange rates fixed.
Bernanke and James (1990) developed the argument that during this period of
crises the central banks adopted policies to increase gold reserves and coverage ratios as security against future attacks on their currencies but the outcome was a decline of the monetary base to reserves ratio. This process was followed by fears about the banking system soundness and expectations of exchange rate devaluation and after all it started an era where crises are associated to what is called hot money based on short-term deposits held by foreigners in domestic banks. The idea is that the expected devaluation induces outflows of hot-money deposits threaten-ing to start a general bank run and on the other hand there is a fall in confidence in a domestic banking system and a process of short run capital flight with signifi-cant impact on international reserves (reduction) questioning the viability of keep-ing convertibility and the fixed exchange rate. The combination of exchange rate and banking crises imposes a dilemma for the monetary authorities since the former asks for expansionary monetary policy while the later requires a contraction of money supply.
The first generation models of currency crises are associated to the passive role played by investors and the bad economic fundaments and how a country can face speculative attacks. Krugman (1979) and Flood and Garber (1984) are two of the main contribution on such models of financial crises especially when dealing with speculative attacks and balance of payments crises.
The second generation models emphasizes a limitation of the first generation models arguing that investors behavior are only relevant in order to determine the time when the speculative attack will happen, but they say nothing on whether the attack will occur or not. Krugman (1996) develops a model where financial crises are associated to the loss of confidence and the essential problem is not macroeco-nomic management or fundamentals. Governments analyze the cost of keeping the exchange rate versus the benefits of realignment, where the costs depend on agent expectations.
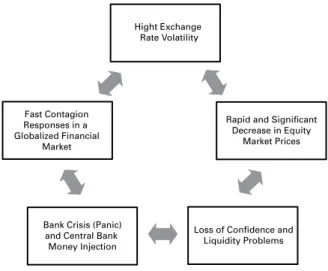
Krugman (2000) among others developed the third generation currency crises models and the idea is to respond the question of whether financial crises are pri-marily due to problems in economic fundaments or if they occurred due to self fulfilling investors’ expectations and loss of confidence. The answer is that both factors are relevant to understand such crises. A graphic representation of the set of events associated to the international financial crises of the new century is slight-ly different from the vicious circle of the currency crises episodes previousslight-ly verified and associated to the second and third generation models (Figure 1)5.
Figure 1: New Vicious Circle of Financial Crises6
Reinhart and Rogoff (2008) develops a historical analysis of financial crises dating from England fourteenth-century default to the current United States subprime financial crisis using a dataset that incorporates a number of important credit epi-sodes. The authors find that serial default can be considered as a universal phenom-enon and that major default episodes are separated by some years or decades, creat-ing an illusion to policymakers and investors that this time is different. After all, they do not consider the U.S. subprime financial crisis as unique. Periods of excessive capital inflows and supply of borrowing funds are frequently associated to a future reduction in economic growth and in equity and housing prices, exactly what the U.S. and most of developed countries have experienced in recent months of 20087.
Kaminski (2008) investigates crises episodes in the 1990s where there was a rapid contagion to other countries and the aftermath of these crises was character-ized by a loss of access to international capital markets by many emerging econo-mies. Contagion and sudden stops are more frequently in economies with current account deficits and financial fragility weakness, and increasing the degree of inte-gration to the international capital markets is associated to a higher exposure to sudden stops even in the absence of domestic imbalances and vulnerabilities.
Regarding the current account deficits, Blanchard (2007) examines how they have increased in advanced countries over the last two decades and the argument is that these deficits are different from the Latin American deficits of the early
6 This representation is a modified and expanded version of the vicious circle of the second and third generation currency crises models.
7 See also Reinhart and Reinhart (2008) for a detailed analysis of capital inflow booms in both advan-ced and emerging economies during 1980-2007 for a set of 181 countries and 1960-2007 for a subset of 66 economies from all regions.
Hight Exchange Rate Volatility
Fast Contagion Responses in a Globalized Financial
Market
Rapid and Significant Decrease in Equity
Market Prices
Bank Crisis (Panic) and Central Bank
Money Injection
1980s since they are part of high income and industrialized countries and are a result of private saving and investment decisions and not primarily associated to fiscal deficits. Current account deficits are mainly financed by FDI, equity, bonds emission on their own currency instead of bank lending. There is a common percep-tion that these deficits are too large and one time or another it will be required some sort of government intervention especially when considering the existence of goods, labor and financial market distortions8.
Barro and Úrsua (2008) investigates the main episodes of world economic crises based on a real per capita consumer expenditure and GDP data since 1870s for most countries (35) and the idea is to isolate economic crises for each country defined as a cumulative declines in consumer expenditure or GDP by at least 10%. According to this criteria the rank for the most important world economic crises
are: World War II, World War I and the Great Depression, the early 1920s (influ-enza epidemic of 1918-20), and post-World War II events (Latin American debt crisis and the Asian financial crisis). They find that there were 87 crises when considering only the 10% reduction in real per capita consumer expenditure and 148 for a 10% decrease in the GDP.
Calomiris (2007) analyzes bank failures during crises episodes and the main idea is that they occur due to either unwarranted depositor withdrawals during the event (contagion and panic) or they are an outcome of bank insolvency problems. The author arguments that panics and contagion have a small and secondary role in bank failure, during or before the Great Depression of 1929 and on the other side the safety net developed to prevent contagion risks reached a specific form and degree of complexity (fragile regulation) that became one of the main sources of banking systemic instability in the recent international financial crises. According to Dell’Ariccia et al. (2008) most major banking crises in the past 25 years have occurred during periods of high credit growth but not all credit booms are followed by banking crises. Different studies have shown that while the probability of a bank-ing crisis increases significantly durbank-ing booms, historically only about 20% of boom episodes ended in a crisis. Barajas et al. (2007) examining more than a hundred (135) credit booms found that only 17% preceded systemic banking crises and 23% if non-systemic episodes of financial distress are included. On the other hand close to 50% of the banking crises in the sample were preceded by lending booms.
THE RECENT FINANCIAL CRISIS: ANALYSIS AND PERSPECTIVES
In order to understand the origins of the recent financial crisis one should consider that during the period of 2002-2004 the U.S. has very low interest rates
and an excess of supply of home loans with high risk (subprime) and most of these loans were based on current interest rates. When the interest rates started to go up in 2005 and 2006, the U.S. economy started to face an increase in delinquency rates with unfavorable repercussions in the bank and financial system. Other than this, there was a passive and to some extent collaborative role played by monetary au-thorities under Alan Greenspan administration.
Reinhart and Rogoff (2008) investigates if the subprime mortgage financial crisis is new and different from other crisis episodes and the conclusion is that there is a significant number of common factors comparing the recent crises with other 18 other bank crisis in the post war period, and among these factors a decrease in equity and housing prices are the most important. The authors also find that the actual level of public debt and inflation are lower but the current account deficit is high in recent years when compared to old episodes.
Gorton (2008) investigates the subprime mortgages problems that result in a systemic crisis due to a loss of information regarding location and size of risks of loss in a financial market facing higher levels of default. The author shows that additional subprime risk was magnified with the use of derivatives. Mishkin (2007) develops an analysis on the relevance of the housing market to monetary policy and how to use the adequate set of instruments to obtain price stability and high levels of employment. Among the important channels of housing market to the monetary transmission mechanism the author highlights how interest rates has an impact on the cost of housing capital and future movements in the price and supply of houses. A secondary impact is associated to the wealth effect of these price move-ments and credit effects on consumer spending.
Mian and Sufi (2008) examines the U.S. house price appreciation and the re-sulting mortgage defaults in an environment of fast expansion in the supply of mortgages without the correct intermediation and risk evaluation. Tong and Wei (2008) develop an analysis on how a crisis originated in the financial sector of the economy can be transmitted to the real economy applied to the subprime mortgage crisis.
with more unstable (volatile) macroeconomic fundamentals usually have more volatile stock markets9.
It should be emphasized that within the last two decades the world economy has seen an enormous increase in asset values relative to GDP for most advanced and emerging economies and such assets are collateral for the credit allocation. On the other hand, a significant decrease in asset prices throughout the period where the crises is more severe generally results in bank collapse and followed by credit reduction. This sequence of events ends up shifting a financial crisis into a real economy crisis with significant implications in terms of job loss and a mismatch between supply and demand. In this situation there is an increase in the risk for credit institutions and the final outcome is a period of credit shortage for firms and consumers, regardless of government policies such as a reduction in compulsory deposits, even though such policy measures should be in place during the initial and most critical period of the crisis in order to minimize the chances of a complete credit collapse.
MAIN ECONOMIC INDICATORS AND THE FINANCIAL CRISIS: DEVELOPED AND EMERGING MARKETS
The main idea of this section of the paper is to investigate the most important housing and global (real and financial) indicators associated to the recent financial crisis and how these indicators are affecting developed and emerging economies.
Housing market indicators: prices, debt service and consumer confidence
Table 1 describes recent past changes in real house prices and there is a clear trend towards a reduction in such prices (2008) due to the occurrence of high infla-tion in the housing market in previous years among most developed economies. This scenario is associated to an increase in delinquency rates (see Table 3), espe-cially for 2008.
Table 1: Changes in Real House Prices (%)
Countries / Years 2007 2008
United Kingdom 7.61 -6.04
Spain 0.01 -6.00
Sweden 8.82 -5.38
Canada 9.81 -5.18
Norway 5.87 -4.77
United States -2.97 -4.76
France 3.12 -3.50
Finland 3.55 -3.48
Japan -1.21 -1.85
Ireland -5.33 -1.64
Italy 2.07 -1.00
Switzerland 0.30 -0.04
Source: WEO and GFSR 2008 Annualized values for 2008
The indicators of household debt service payments reported on table 2 show an increasing trend as a result of the increase in the degree of indebtedness in the period of 2002-2004 where the U.S. interest rate was low and there was an excess of cred-it to finance consumers in the house market10. Most of the borrowing at this time was carried out by contracts based on current interest rates and when they started to increase in 2005-2006 a significant part of households has faced financial prob-lems and a deterioration in most indicators such as the DSR, FOR and mortgages.
Table 2: U.S. Household debt service payments and financial obligations as a percentage of disposable personal income; seasonally adjusted (2000 to 2008 Q2)
Year DSR FOR Mortgage
2000 12.55 17.89 9.19
2001 13.13 18.53 9.46
2002 13.42 18.72 9.73
2003 13.56 18.66 10.05
2004 13.55 18.51 10.28
2005 14.06 19.06 10.99
2006 14.31 19.31 11.59
2007 14.38 19.46 11.82
2008 14.10 19.14 11.57
Source: Federal Reserve Bank 2008 = Average for Q1 and Q2
The data for the delinquency rates (residential and commercial) for all banks in the U.S. from 2005 to the second quarter of 2008 has increased from 1.65% to 4.33% and from 1.25% to 4.24% as (Table 3), increasing the concern that consum-ers are in a situation of excessive indebtedness and the financial obligation were too high for a significant part of loans borrowers11.
Table 3: Delinquency Rates – All Banks – Seasonally Adjusted
Quater Residential Commercial
2005 Q1 1.44 1.12
2005 Q2 1.55 1.06
2005 Q3 1.56 1.07
2005 Q4 1.64 1.03
2006 Q1 1.61 1.02
2006 Q2 1.61 1.03
2006 Q3 1.74 1.13
2006 Q4 1.95 1.31
2007 Q1 2.06 1.42
2007 Q2 2.29 1.66
2007 Q3 2.73 1.98
2007 Q4 3.04 2.72
2008 Q1 3.73 3.47
2008 Q2 4.33 4.24
Source: Federal Financial Institutions Examination Council (FFIEC)
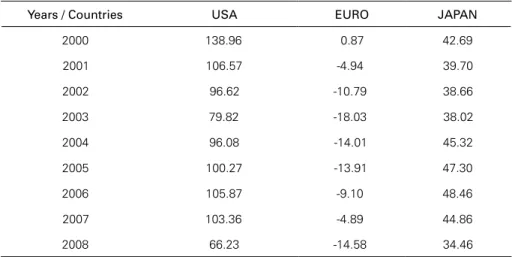
Considering one of the most important indicators for the economy as a whole and for the housing market in U.S., Euro zone and Japan, the consumer confidence index (Table 4) has shown a significant decrease since the beginning of the new century, but the numbers are even higher when focusing for the last years (2007) and the first three quarters of 2008. For the U.S. economy, consumer confidence has fallen from an average close to 100 in the period of 2005-2007 to 66.23 in 2008 implying a decrease of more than 30%.
Table 4: Consumer Confidence Index – USA, Euro and Japan (2000 to 2008)
Years / Countries USA EURO JAPAN
2000 138.96 0.87 42.69
2001 106.57 -4.94 39.70
2002 96.62 -10.79 38.66
2003 79.82 -18.03 38.02
2004 96.08 -14.01 45.32
2005 100.27 -13.91 47.30
2006 105.87 -9.10 48.46
2007 103.36 -4.89 44.86
2008 66.23 -14.58 34.46
Source: WEO and GFSR 2008 2008 = Jan-Sept
The equity market price data from 2004 to July 2008 for three of the main world indexes (S&P 500, Nasdaq and FTSE) reveals that these indexes have start-ed to incorporate global financial problems since early 2007. As this work has previously shown (Tables 1 to 4) the housing market problem in the U.S. and the use of financial innovation (derivatives) by most investment banks in the U.S. and Europe has widespread through different financial institutions operating in equity markets, with expectations that such institutions will face significant losses in the near future.
Table 5 summarizes data for the equity market for Asia, Latin America and Eastern Europe since 2002 and one can highlight the significant increase in these markets with rates of increase (compared to 2001) of more than 150% for Asia, 320% for Latin America and 370% for Eastern Europe.
Table 5: Equity Market in Emerging Markets (2001 = 100)
Years Asia Latin America Eastern Europe
2002 111.07 98.44 122.08
2003 110.95 113.64 149.19
2004 140.31 161.75 206.98
2005 159.78 212.51 275.93
2006 199.23 290.90 419.83
2007 268.79 397.32 487.04
2008 259.92 423.05 479.50
Table 6: Emerging Market Bond Index: EMBI Global Yield Spreads (in basis points) – End of Period
Countries / Region 2002 2003 2004 2005 2006 2007 2008 Q1 2008 Q2
EMBI Global 725 403 347 237 171 255 324 308
Latin America 981 518 415 272 180 275 347 313
Non-Latin America 444 248 239 179 159 227 297 303
Argentina 6,342 5,485 4,527 504 216 410 400 614
Brazil 1,460 459 376 308 190 220 174 227
Chile 176 90 64 80 84 151 126 177
Mexico 329 201 174 143 115 172 193 194
China 84 58 57 68 51 120 90 137
Russia 478 257 213 118 99 157 208 197
South Africa 250 152 102 87 84 164 271 232
Source: WEO and GFSR 2008
Examining the emerging market bond index (EMBI) spreads from 2002 to the second quarter of 2008 on Table 6 one can see that the spreads were decreasing from 2002 to 2006 and since 2007 it starts to increase for all emerging countries, which was an indication that the market has already started in 2007 to price an increase in global risk affecting the emerging markets even though most of them were having a significant improvement in macroeconomic fundaments such as high economic growth and improvements in the current account. After all, such numbers captures a global perception of increasing risks.
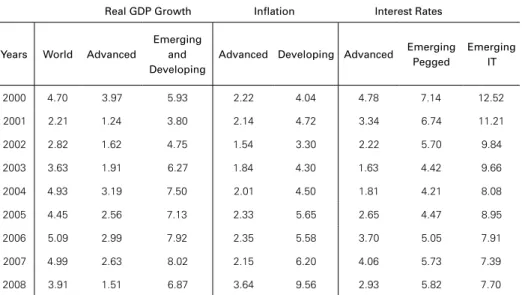
Real and financial global indicators
Table 7: Real GDP Growth and Inflation (2000-2008)
Real GDP Growth Inflation Interest Rates
Years World Advanced
Emerging and Developing
Advanced Developing Advanced Emerging Pegged
Emerging IT
2000 4.70 3.97 5.93 2.22 4.04 4.78 7.14 12.52 2001 2.21 1.24 3.80 2.14 4.72 3.34 6.74 11.21 2002 2.82 1.62 4.75 1.54 3.30 2.22 5.70 9.84 2003 3.63 1.91 6.27 1.84 4.30 1.63 4.42 9.66 2004 4.93 3.19 7.50 2.01 4.50 1.81 4.21 8.08 2005 4.45 2.56 7.13 2.33 5.65 2.65 4.47 8.95 2006 5.09 2.99 7.92 2.35 5.58 3.70 5.05 7.91 2007 4.99 2.63 8.02 2.15 6.20 4.06 5.73 7.39 2008 3.91 1.51 6.87 3.64 9.56 2.93 5.82 7.70 Source: WEO and GFSR 2008 Predicted values for 2008 IT = Inflation Target
Table 8: World Real Commodity Prices (1990 = 100) Agricultural, Metal, Food and Oil – 2000 to 2008
Years Agricultural Metals Food Fuel
2000 62.20 63.84 65.69 93.50
2001 60.43 54.60 62.53 78.39
2002 59.73 51.53 66.60 79.07
2003 57.12 56.42 69.40 89.60
2004 55.24 74.47 75.68 113.93
2005 52.26 83.55 69.33 155.69
2006 55.35 130.24 74.12 181.82
2007 59.03 142.97 89.27 195.40
2008 59.69 140.07 122.67 286.34
Source: WEO and GFSR 2008 2008 = Average for Q1 and Q2
Another empirical lesson from previous financial crises is that commodity prices are frequently high prior to the crisis and this is clearly what Table 8 is sum-marizing. With the recession of the second semester of 2008 in advanced economies and close to zero growth rates for 2009, there is trend for decreasing in commod-ity prices, especially for metals and oil.
Table 9: Food and Fuel Price Contribution to Inflation: Selected Countries – 2007Q2 to 2008Q2 (%)
Food Rank Country Food Fuel Rank Country Fuel
1 Venezuela 9.59 1 Argentina 1.86
2 Russia 8.83 2 United States 1.69
3 Paraguay 8.39 3 Spain 1.62
4 Philippines 6.45 4 Germany 1.46
5 Chile 5.18 5 France 1.34
6 China 4.93 6 Sweden 1.29
7 Peru 4.47 7 Norway 1.20
8 Indonesia 4.37 8 United Kingdom 1.18
9 South Africa 4.30 9 Thailand 1.06
10 Uruguay 4.07 10 Italy 1.03
11 Brazil 2.86 11 Portugal 1.00
12 Taiwan 2.58 12 New Zealand 0.93
13 Colombia 2.57 13 Switzerland 0.80
14 Argentina 2.46 14 Korea, Rep 0.78
15 Malaysia 2.39 15 India 0.72
16 India 2.10 16 Paraguay 0.62
17 Singapore 2.09 17 Netherlands 0.45
18 Mexico 1.95 18 Russia 0.41
19 Thailand 1.79 19 Taiwan 0.40
20 Spain 1.40 20 South Africa 0.39
31 Brazil -0.10
Source: Author elaboration from the WEO and UNCTAD database
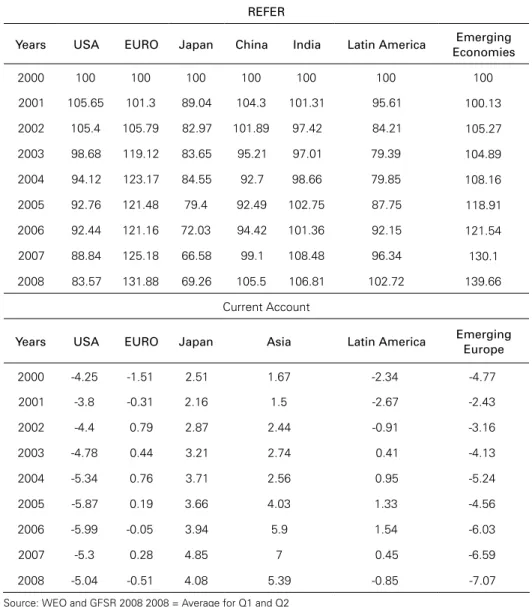
Table 10 summarizes data for advanced and emerging economies for real ef-fective exchange rate (REER) and current account. It is clear that the U.S. Dollar was facing a period of depreciation, the same for the Yen, and the opposite for the Euro. Such trend has been inverted since the aggravating moments of the crisis after September 2008 when the Dollar started to appreciate relative to other cur-rencies12. Once we examine the current account numbers it is clear that there is on one side the U.S. and emerging Europe with significant deficits and on the other
side Japan / Asia with current account surplus and they have been able to sustain the U.S. deficit by buying treasury bonds and other U.S. assets. Latin America and Europe do not have current account disequilibrium.
Table 10: Real Effective Exchange Rate (2000 = 100) and
Current Account (% of GDP): Advanced and Emerging Economies (2000-2008)
REFER
Years USA EURO Japan China India Latin America Emerging Economies
2000 100 100 100 100 100 100 100
2001 105.65 101.3 89.04 104.3 101.31 95.61 100.13
2002 105.4 105.79 82.97 101.89 97.42 84.21 105.27
2003 98.68 119.12 83.65 95.21 97.01 79.39 104.89
2004 94.12 123.17 84.55 92.7 98.66 79.85 108.16
2005 92.76 121.48 79.4 92.49 102.75 87.75 118.91
2006 92.44 121.16 72.03 94.42 101.36 92.15 121.54
2007 88.84 125.18 66.58 99.1 108.48 96.34 130.1
2008 83.57 131.88 69.26 105.5 106.81 102.72 139.66
Current Account
Years USA EURO Japan Asia Latin America Emerging
Europe
2000 -4.25 -1.51 2.51 1.67 -2.34 -4.77
2001 -3.8 -0.31 2.16 1.5 -2.67 -2.43
2002 -4.4 0.79 2.87 2.44 -0.91 -3.16
2003 -4.78 0.44 3.21 2.74 0.41 -4.13
2004 -5.34 0.76 3.71 2.56 0.95 -5.24
2005 -5.87 0.19 3.66 4.03 1.33 -4.56
2006 -5.99 -0.05 3.94 5.9 1.54 -6.03
2007 -5.3 0.28 4.85 7 0.45 -6.59
2008 -5.04 -0.51 4.08 5.39 -0.85 -7.07
Source: WEO and GFSR 2008 2008 = Average for Q1 and Q2
played and deal with the consequences of the financial crisis, especially the increase in demand for foreign currency and the pressure for exchange rate depreciation and higher volatility. On the other hand, when examining the data on net foreign asset, or liabilities when the numbers are negative, once more it is clear to see that the U.S. and in this case the Euro countries, have been financed by Japan, emerging Asia (South Korea) and oil exporters (Saudi Arabia) countries13.
Table 11: International Reserves (2000 = 100) and Net Foreign Assets – % of GDP (2000-2007)
International Reserves Net Foreign Assets
Years Latin
America
Emerging
Europe Asia USA EURO Japan
Emerging Asia
Oil ex-porters
2000 100.00 100.00 100.00 -4.39 -1.83 3.61 1.09 1.22
2001 104.94 101.73 109.99 -6.13 -1.45 4.28 1.21 1.28
2002 102.03 120.61 139.20 -6.46 -2.69 4.42 1.76 1.45
2003 119.04 154.67 188.70 -5.93 -3.13 4.33 2.03 1.53
2004 136.39 177.77 250.75 -5.66 -3.30 4.26 2.36 1.79
2005 159.25 212.90 339.50 -4.57 -2.61 3.38 2.38 2.32
2006 183.09 256.36 426.43 -4.91 -3.27 3.68 2.59 3.03
2007 251.29 308.27 591.27 -4.87 -3.99 3.99 2.78 3.46
Source: IFS, WEO 2008 and FED
Table 12 highlights the significant increase in credit growth in all emerging economies since 2002 a trend that should start to slow down for the second semes-ter of 2008 and 2009. Short and long semes-term real insemes-terest rates for the U.S. economy have decreased for 2008 (Q1 and Q2) after an increase in the previous two years, explained by an increase in inflation and the reduction of 0.5% in interest rates adopted by the FED while the financial crises was undergoing, coordinated with similar rates decrease by other central banks in advanced economies14. The Euro zone is facing a different trend with an increase in short term interest rates for 2008
13 Obstfeld, Shambough and Taylor (2008) argues that the fast grow of international reserves a phenomena that is concentrated on emerging markets remains a puzzle and the empirical results suggest that factors such as the size of domestic financial liabilities that could potentially be converted into foreign currency (M2), degree of financial openness and the exchange rate policy are significant predictors of the stock of international reserves.
and a decrease in long term rates. Real interest rates movements for the whole year of 2008 and next years will be conditioned by the degree of price deflation in U.S. and Europe due to slow or even negative (recession) rates of economic growth15.
Table 12: Private Credit Growth and Real Interest Rates – Short and Long Term (2002 to 2008)
Credit Growth Real Interest Rates
Years Latin
America
Emerging Asia
Eastern Europe
Short USA
Short EURO
Long USA
Long EURO
2002 1.18 11.65 3.11 -0.69 0.94 2.86 2.98
2003 6.61 14.85 10.85 -0.44 0.60 2.02 2.11
2004 11.13 12.79 17.57 -0.38 0.29 1.81 1.69
2005 19.62 12.20 14.61 1.01 0.78 1.80 1.29
2006 25.81 12.04 21.49 2.26 1.58 2.31 1.61
2007 34.20 16.31 27.38 2.07 2.04 2.28 2.05
2008 28.74 18.21 28.12 0.04 2.13 1.48 1.83
Source: WEO 2008, FED and Euro Central Bank 2008: Latin America (Jan-May) Emerging Asia and Eastern Europe (Jan-Jul)
Table 13: Country Risk, Exchange Rate and Equity Market Index for Selected Emerging Economies (%) September to October 2008
Countries Country Risk Exchange Rate Equity Market Index
Brazil 216.7 -14.4 -40.4
Mexico 419.3 -17.7 -42.9
Russia 449.0 -5.9 -70.6
Venezuela 278.3 0.0 -66.7
Argentina 296.5 -3.6 -56.0
Chile 208.0 -21.0 -28.0
Average 311.3 -12.2 -50.8
Source: Bloomberg
During the most turbulent time of the crisis, emerging economies have faced a significant impact on their currency (exchange rate), country risk and equity market
prices as one can see on Table 13. On average, there was a positive change in country risk of more than 300%, an exchange rate appreciation of 12.2% and a decrease in equity market prices of 50.8% revealing the magnitude and severity of the recent crisis16. The U.S. exchange rate relative to the Euro and the British Pound from the beginning of August to the end of October 2008 has experienced a significant ap-preciation of 18.69% (Euro) and 19.75% (Pound), which is an evidence that regard-less of the U.S. economy be the epicenter of the crisis, the Dollar and the U.S. Treasury Bonds are still the ultimate refugee for investors around the world.
CONCLUDING REMARKS
The recent financial crisis is ultimately a deep crisis of confidence and a result of a chain of loans, originally home loans, to high risk and after all insolvent cus-tomers, that has spread thorough the international system.
The new international financial crisis revealed that in only a short period of time there was a public injection of financial resources in Europe and the U.S. of more than US$ 3 trillion and different measures such as a reduction in reserve re-quirements of the banking system (compulsory deposits), the use of international reserves to satisfy demand for foreign currency, purchase of banks and home financ-ing assets that were in financial difficulties, the approval of financial help by legis-lators, all of them with the goal to avoid a general and widespread situation of insolvency and to increase money liquidity in the global market. There was also a coordinated reduction on interest rates by the FED and the Central Bank of Europe. The estimated total debt in risk is US$ 12.3 trillion which is almost the same size of the U.S. GDP and in one year since October 2007, the world value of equity markets fell by 50% or US$ 32 trillion. Emerging economies are facing a significant depreciation of their currency, Brazil with more than 40% in only two months, which is a desirable trend to stimulate exports and foster economic growth, but the circumstances are not.
The burst of the new financial crisis has inaugurated a new period where policies (Keynesian) considered as inadequate to the logic of the market operation are starting to gain attention and relevance. There is almost a consensus that the world should experience an era based on a new set of relationship between the State and the market especially to avoid a process such as the recent one that is imposing significant real and financial losses worldwide. The global financial market will eventually recover from the recent crisis but the outcome of this process should and must be followed by a different and more disciplined set of international financial institutions. This new era should change the widespread liberal argument that the market is always efficient, or at least, more efficient than any State intervention, overcoming the false idea based on the opposition of the State and the market.
There is an urgency for coordination among monetary authorities and an active monetary policy and the development of a new set of international regulation for the international banking system to overcome the discrepancy of recent financial innova-tions (derivatives) and how the regulation has evolve. The U.S. Dollar and Treasury Bills are still the ultimate assets on the global monetary system regardless of world geopolitical changes already underway. A final lesson is that no one has find a way to avoid significant wealth losses, usually following periods when investors are seeking for fast gains with higher risks and the financial system is anxious and ready to fulfill such expectations. Once this initial cycle is completed it is time for the process of match-ing the real and monetary sides of the economy, usually through price corrections (commodities and equity market price deflation) and real effects (recession and lower level of employment), and a period of turbulences and end of illusions is in place.
REFERENCES
BARAJAS, A.; DELL’ARICCIA, G.; and LEVCHENKO, A. (2007) “Credit Booms: The Good, the Bad, and the Ugly”, Unpublished manuscript, International Monetary Fund Research Department. BARRO, R. J. and URSÚA, J. F. (2008) “Macroeconomic crises since 1870”. NBER Working Paper Series,
No. 13940, April.
BLANCHARD, O. (2007) Current Account Deficits in Rich Countries. MIT Department of Economics Working Paper No. 07006, February.
BERNANKE, B. S. (2000) Essays on the Great Depression. Princeton: Princeton University Press. BERNANKE, B. S. and JAMES, H. (1990) “The gold standard, deflation, and financial crisis in the Great
Depression: An international comparison”. NBER Working Paper No. W3488, October.
CALOMIRIS, C. W. (2007) “Bank failures in theory and history: the Great Depression and other “conta-gious” events”. NBER Working Paper Series, No. 13597, November.
DELL’ARICCIA, G.; IGAN, D. and LAEVEN, L. (2008) The relationship between the recent boom and the current delinquencies in subprime mortgages. Centre for Economic Policy Research (CEPR), February.
DIEBOLD, F. X. and YILMAZ, K. (2008) “Macroeconomic volatility and stock market volatility worldwi-de”. NBER Working Paper Series, No. 14269, August.
EICHENGREEN, B. (2004) “Global imbalances and the lessons of Bretton Woods”, NBER Working Pa-per No. 10497, May.
EICHENGREEN, B. (2008) Globalizing Capital: A History of the International Monetary System. Prince-ton: Princeton University Press, Second Edition.
FLOOD, R. and GARBER, P. (1984) “Collapsing exchange rate regimes: some linear examples.” Journal of International Economics, 1 (2): 1-13.
FRIEDMAN, M. and SCHWARTZ, A. J. (1963) A Monetary History of the United States, 1867-1960.
Princeton: Princeton University Press.
GFSR (2008) Global Financial Stability Report. Financial Stress and Deleveraging Macrofinancial Implica-tions and Policy. IMF, October.
GORTON, G. B. (2008) “The panic of 2007”, NBER Working Paper Series, No. 14358, September. IFS – International Financial Statistics Database. International Monetary Fund, IMF. Washington, DC. IVER, R. and PURY, M. (2008) “Understanding bank runs: The importance of depositor-bank
rela-tionships and networks”, NBER Working Paper Series, No. 14280, August.
KAMINSKY, G. L. (2008) “Crises and sudden stops: Evidence from international bond and syndicated--loan markets”. NBER Working Paper Series, No. 14249, August.
KAMINSKY, G. L. and REINHART, C. R. (1999) “The twin crises: The causes of banking and balance-of--payments problems.” American Economic Review, pp. 473-500.
the Twentieth Century. Vol. 4. University of California Press, Berkeley and Los Angeles, California, Second Edition.
KINDLEBERGER, C. P. (1989) Manias, Panics, and Crashes. A History of Financial Crises. MacMillan Press, Second Editon.
KRUGMAN, P. (1979) “A Model of balance of payments crises.” Journal of Money, Credit and Banking. 11 (3), August.
KRUGMAN, P. (1996) Are Crises Self Fullfilling? NBER Macroeconomics Annual.
KRUGMAN, P. (2000) The Return of Depression Economics, New York: W. W. Norton & Co.
MENDOZA, E. G. and TERRONES, M. E. (2008) “An anatomy of credit booms: Evidence from macro aggregates and micro data”, NBER Working Paper Series, No. 14049, May.
MIAN, A. and SUFI, A. (2008) “The consequences of mortgage credit expansion: Evidence from the 2007 mortgage default crisis”, NBER Working Paper Series, No. 13936, April.
MISHKIN, F. S. (2007) “Housing and monetary transmission mechanism”. NBER Working Paper Series, No. 13518, October.
OBSTFELD, M.; SHAMBAUGH, J. C. and TAYLOR, A. M. (2008) “Financial stability, the trilemma, and international reserves, NBER Working Paper No. 14217, August.
REINHART, C. M. and REINHART, V. R. (2008) “Capital flow bonanzas: An encompassing view of the past and present”, NBER Working Paper Series, No. 14321, September.
REINHART, C. and ROGOFF, K. (2008) “This time is different: A panoramic view of eight century of fi-nancial crises”, NBER Working Paper Series, No. 13882, March.
TEMIN, P. (1976) “Lessons for the present from the Great Depression,” American Economic Review, pp. 40-45, May.
TEMIN, P. (1989) Lessons from the Great Depression. Cambridge: MIT Press.
TONG, H. and WEI, S. (2008) “Real effects of the subprime mortgage crisis: Is it demand or a finance shock?”, NBER Working Paper Series, No. 14205, July.
WEO (2008) World Economic Outlook. Financial Stress, Downturns, and Recoveries. IMF, October, 2008. APPENDIX
Table 1A: Banks, Financing and Insurance Institutions
Banks, Financing and Insurance Institutions – Financial Assistance (up to October 2008)
Current Situation
Fannie Mae and Freddie Mac – (Home Financing) More than US$5 Trillions in Liabilities Nationalized
Merrill Lynch (Investment Bank) – Incorporated by Bank of America US$ 44 Billions Incorporated
Lehman Brothers (Investment Bank) – USA Bankruptcy
AIG (Insurance) US$ 85 Billion – FED Controls 80% of the company Nationalized
HBOS (Bank and Insurance) – Scotland – US$ 22,2 Billions Incorporated
Washington Mutual (Bank) – USA – Incorporated by the JP Morgan US$ 1,9 Billions Bankruptcy
Fortis (Bank) – Belgium, Netherlands and Luxemburg – 11,2 Billions of Euros and BNP
France Nationalized
Bradford & Bingley (Mortgage Financing) – UK and Partially Incorporated by Santander Nationalized
Wachovia (Bank) – USA – US$ 12 Billion by the Wells Fargo Incorporated
Glitnir and Landsbanki – Iceland – Controlled by IFSA Nationalized
Hypo Real Estate – Germany – US$ 70 Billions Nationalized