Performance evaluation of integrated
treatment plant of trickling filter and
constructed wetland
P.M Maheesan1, G Srinikethan2 and Harikumar, P.S3
1
Principal, Swami Nithyananda Polytechnic College Kanhangad 671315 India
2
Professor, Chemical Engineering Department National Institute of Technology Karnataka 575025 India
3
Scientist, Centre for Water Resources Development and Management Calicut 673571 India;
ABSTRACT
A system consisting of trickling filter followed by a vertical intermittent flow constructed wetland system under laboratory condition was evaluated for the treatment of domestic wastewater. The system was able to produce final effluents with low concentrations of both organic and nutrients. Mean effluent concentrations were, respectively: BOD: 22.22mg/L;COD:64.58mg/L;SS:27.63mg/L;NH4-N:0.62mg/L;P:1.72mg/L. The study shows
that the integrated treatment system of trickling filter and vertical intermittent flow constructed wetlands can be effectively used a treatment option for a treatment with positive attributes of conceptual simplicity and lesser energy consumption.
INTRODUCTION
The trickling filter reactors are widely recognized as an appropriate option for the treatment of domestic wastewater in tropical developing countries. The main advantages include simplicity, no mechanization, low sludge production and less energy consumption. However, trickling filters show lower removal efficiencies compared with other secondary processes, which brings about the need for a post treatment of their effluents, especially in terms of organic matter and nutrients. In order to improve water pollution control, removal of nutrients is of great importance. This fact has obviously influenced the water legislation in this field in many parts of the world (Haberl, 1999).
One of the most promising technologies for the post treatment of domestic wastewater is constructed wetlands, which preserve the attributes of conceptual simplicity, no mechanization and no energy consumptions.Vertical flow beds with intermittent flow are extremely reliable regarding removal of nutrients (Kayser et al., 2005). Since wetland systems have been more studied when they are integrated with other treatment processes, it is believed that their performance and behavior as post treatment options for trickling filter effluent should be more investigated.
In this line, the study aims at investigating the performance of integrated trickling filter and vertical intermittent flow constructed wetlands treating the domestic effluent.
MATERIALS & METHODS
Fast drainage controls the height of the saturated zone and results in suction of fresh air to the unsaturated zone. Aeration is enhanced by the cyclic operation of inflow combined with fast drainage.
Figure 1–Integrated lab scale treatment unit of trickling filter and constructed wetland
The wastewater from the dosing tank allows influent to trickle through the distribution pipes over the filter media. This filtered water was then permitted to flow through the constructed wetland vertically and then collected through the control valve fitted at the bottom of the tank.
Sampling and analyses
Sample locations were provided in the
(i) Dosing tank,
(ii) Bottom of trickling filter tank and (iii) Bottom of constructed wetland.
Process Monitoring: The wastewater samples collected from sample locations were analyzed for the following
parameters:5-day Biochemical Oxygen Demand (BOD5), Chemical Oxygen Demand(COD), Suspended
Solids(SS),ammonia-N, nitrate-N , and total phosphorus and pH. All samples were analyzed as per the procedure outlined in Standard Methods (APHA, 2005).
RESULTS AND DISCUSSION
Experiments were carried out in the combined trickling filter and constructed wetland models and were operated for a period of 90 days. Vertivaria sesmoida species was used as a plant in the vertical flow reactor. Table 1 to Table 5 presents the influent concentration to the integrated unit and effluent concentration BOD5, COD, SS,
NH4-N and Phosphate respectively through trickling filter and constructed wetland system. Based on
influent/effluent concentrations to each unit, removal efficiencies of each unit operation and overall removal efficiencies have been calculated and are presented in respective tables. Table 6 presents the mean and standard deviation of the effluent concentration of investigated constituents such as BOD5, COD, SS, NH4-N and
Phosphate. Based on the mean concentrations, mean removal efficiencies have been calculated and are presented in Table 7. The excellent performance in terms of organic matter and nutrients can be readily seen from the experimental results.
Organic matter removal
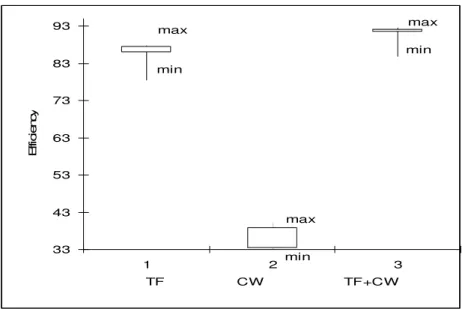
A detail of the performance of the wetland unit alone in terms of BOD5 can be seen in the box-and-whisker plot
in Fig 3(a) & Fig 3(b) which depicts influent and effluent concentrations from both the units, together with removal efficiency in each unit, allowing better comparison between each unit. There was excellent reduction in the BOD5 in the effluent as observed by the results. The influent BOD5 to the treatment plant varied from a low
of 83.2mg/L to a high of 306.5mg/L. The BOD5 of the final effluent varied from a low of 12.5 to a high of
29.5mg/L. Thus, the treatment plant effluent was well within the allowable BOD5 limit of 30mg/L. The
maximum BOD5 reduction of around 92% is achieved through this system. As expected major removal
efficiencies (> 80%) of organic matters occur at the trickling filter. In the vertical flow constructed wetland beds, removal efficiencies achieved for BOD5 and COD were 33.31% and 37.44% respectively. Schonerklee et
al., (1997) reported that a COD removal efficiency of 50 to 60% was achieved through vertical flow beds. The lower efficiency in the present study may be due to low input value in constructed wetland and also due to less hydraulic retention time. It has been well established that percentage efficiency increases with increasing inflow concentration (Schierup et al., 1990; Vymazal 1995). Brix, (1998) also reported that the concentration of BOD5
and COD was largely dependent of inlet concentrations.
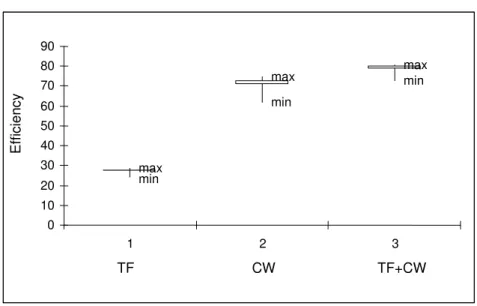
Suspended solids removal
Suspended solids removal efficiency was very good in constructed wetland system, whereas in trickling filter removal efficiency was low. Average value of SS removal efficiencies of 26.96% and 71.45% in trickling filter unit and constructed wetland were obtained. Fig 4(a) & Fig 4(b)presents the box plot of effluent concentrations and removal efficiencies, highlighting the performance in both units.
The vertical flow constructed wetland followed by a secondary treatment achieved high SS removal efficiency (72.74 to 80.77%) as a result of physical filtering by the gravel bed, enhanced by the filtering action of the organic deposits layer which accumulated at the surface. As noted by Boutin et al, (1997), this clogging layer remained self-managing with the action of reed stems and roots and with alternative feed and rest periods.
It can be observed from the results that the SS removal is around 80% through the system. The percentage removal by the trickling filter system varied from 24.47 to 28.57% with an average of about 26.96%. It is noted that the SS reduction is low through the trickling filter and it may be due to sloughing of slime layers attached with media. The removal through constructed wetland system having vertical flow varied from 61.84 to 74.59% with an average of 70%. As the regime of flow was vertical, the major removal mechanism may be filtration. The wetland system performed better than the trickling filter system in removing the suspended solids. The overall suspended solids removal by the entire treatment plant varied from 72.74 to 80.77% with an average of about 75.56%.
Nitrogen removal
Ammonia-nitrogen removal efficiency was only modest in trickling filter and removal efficiency was very good in vertical flow constructed wetland. Fig 5(a) & Fig 5(b) presents effluent concentrations of NH4-N and also the removal efficiency. NH4-N of the raw wastewater varied from 11.0 to 30.8mg/l. The average concentration of
NH4-N in the raw influent wastewater was 21.64mg/l. The NH4-N of the plant effluent varied from 0.25 to
0.85mg/l with an average of t 0.62mg/l. Thus, on an average the integrated treatment plant removed about 97% of NH4-N. The ammonia removal through trickling filter was quite inconsistent. Sloughing of slime layer may
be the reason for the inconsistency.
As expected the NH4-N concentration generally decreased through the vertical flow constructed wetland
system. The average NH4-N concentration of the effluent from the constructed wetland system was 0.62mg/L.
The NH4-N removal by the constructed wetland system having vertical flow was about 96.66%. This high
efficiency can be ascribed to the high oxygen transfer rate, as the flow was intermittent.
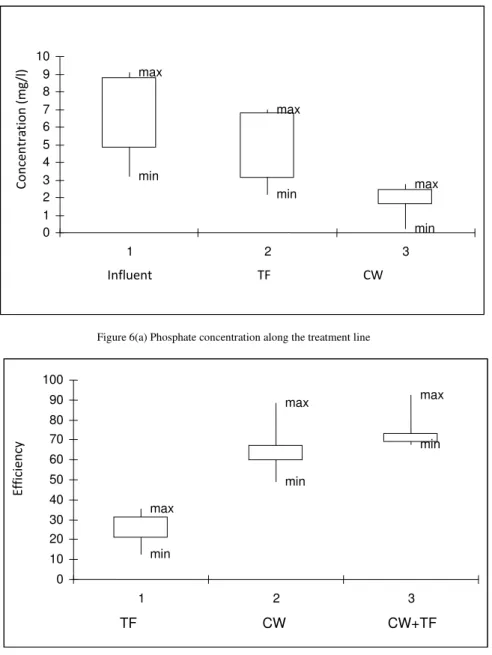
Phosphorus removal
Phosphorus removal took place in trickling filter and wetland, with mean removal efficiencies of 23.8% (Trickling filter) and 64.16% (Constructed wetland). Fig 6(a) & Fig 6(b) presents effluent concentrations of phosphate and also the removal efficiency
27 and 65% were reported by Vymazal, (2002), and Mbuligwe, (2004) reached high removals (69 to 75%) in similar studies.
CONCLUSION
The integrated treatment plant removes on an average 88% of the incoming BOD5 & COD and around 75% of
SS. The nutrient removal, such as NH4-N and total P, were above 97% and 72%, respectively. It is seen that the
trickling filter with intermittent trickling flow is more effective in BOD5 removal and constructed wetland
having vertical intermittent flow is more effective in nutrient removal. The performance of the overall system was quite reasonable. These results are in accordance with the values reported for similar systems in Spain (Alvarez et al. 2008), providing further evidence of how an integrated treatment system improves the treatment performance and minimizes area requirement for the constructed wetland.
In the treatment of domestic sewage, different reactor configurations have been used by various researchers. One such study was carried out by Luiz et al, (1999) by the Association of Septic Tank and Constructed Wetland System for the treatment of domestic wastewater for small communities. The experiment was carried out in the Agriculture Secretary’s Training Centre, Santa Catarina State, responsible for serving approximately 66 people daily, and was fed with local effluent. For carbonaceous pollution notable removal efficiencies were observed for both COD and BOD5 parameter (more than 80%). In another study conducted by
Surampalli et al (2007) by the associated overland flow and wetlands system, the overall average BOD5 removal
by the entire treatment plant was about 90%. The highest % removal was 96% and the lowest was 85%. The overall suspended solids removal by the entire treatment plant varied from 41.7 to 99.2% ( Surampalli et al, 2007). The Ammonia-N and phosphorus (P) removal were in the order of 96% and 63% respectively. Masi et al., (2010) have tested several constructed wetland pilot systems with different pre-treatments in Egypt, Morocco, Tunisia and Turkey. Very efficient organic content reduction and nitrification (92-99%) was reported by them. These literature results are in fair agreement with the experimental results obtained in the present study.
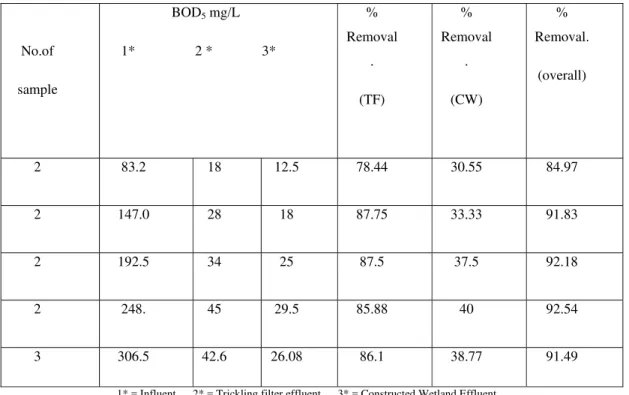
Table 1. Influent and effluent concentration of BOD5 & Removal efficiencies of trickling filter and CWs.
No.of
sample
BOD5 mg/L
1* 2 * 3*
%
Removal
.
(TF)
%
Removal
.
(CW)
%
Removal.
(overall)
2 83.2 18 12.5 78.44 30.55 84.97
2 147.0 28 18 87.75 33.33 91.83
2 192.5 34 25 87.5 37.5 92.18
2 248. 45 29.5 85.88 40 92.54
3 306.5 42.6 26.08 86.1 38.77 91.49
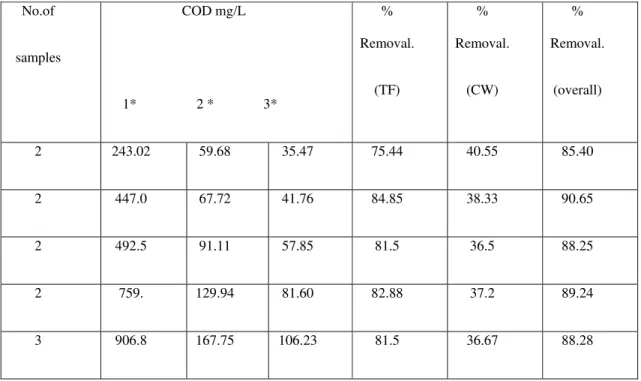
Table 2. Influent and effluent concentration of COD& Removal efficiencies of trickling filter and CWs.
No.of
samples
COD mg/L
1* 2 * 3*
%
Removal.
(TF)
%
Removal.
(CW)
%
Removal.
(overall)
2 243.02 59.68 35.47 75.44 40.55 85.40
2 447.0 67.72 41.76 84.85 38.33 90.65
2 492.5 91.11 57.85 81.5 36.5 88.25
2 759. 129.94 81.60 82.88 37.2 89.24
3 906.8 167.75 106.23 81.5 36.67 88.28
1* = Influent, 2* = Trickling filter effluent, 3* = Constructed Wetland Effluent Table-3. Influent and effluent concentration of SS& Removal efficiencies of trickling filter and CWs.
No.of
samples
SS mg/L
1* 2 * 3*
%
Removal.
(TF)
%
Removal.
(CW)
%
Removal.
(overall)
3 53.2 38 14.5 28.57 61.84 72.74
1 107.0 78 23 27.10 70.51 78.5
2 142.5 104 28.5 27.01 72.59 80
2 163.8 124 31.5 24.47 74.59 80.77
3 197.6 142.95 40.69 27.65 71.53 79.40
Table 4 . Influent and effluent concentration of NH4-N & Removal efficiencies of trickling filter and CWs.
No.of
samples
NH4-N mg/L
1* 2 * 3*
%
Removal.
(TF)
%
Removal.
(CW)
%
Removal.
(overall)
1 11.00 8.12 0.25 26.18 96.92 97.72
1 15.10 15.01 0.58 0.6 96.13 96.16
2 24.5 22.3 0.67 8.97 96.99 97.26
2 26.8 24 0.74 10.44 96.91 97.23
2 30.8 29.4 0.85 4.54 97.11 97.24
1* = Influent, 2* = Trickling filter effluent, 3* = Constructed Wetland Effluent
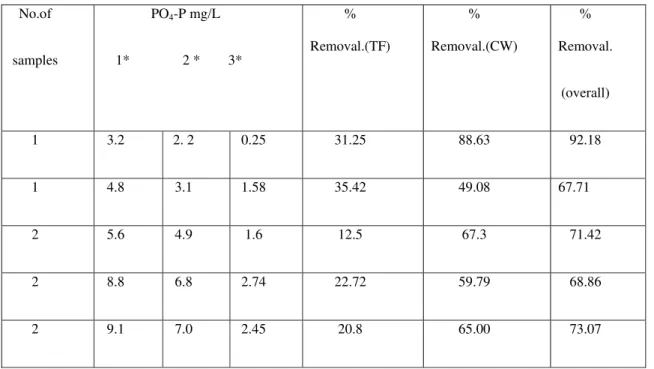
Table 5 Influent and effluent concentration of PO4-P & Removal efficiencies of trickling filter and CWs
No.of
samples
PO4-P mg/L
1* 2 * 3*
%
Removal.(TF)
%
Removal.(CW)
%
Removal.
(overall)
1 3.2 2. 2 0.25 31.25 88.63 92.18
1 4.8 3.1 1.58 35.42 49.08 67.71
2 5.6 4.9 1.6 12.5 67.3 71.42
2 8.8 6.8 2.74 22.72 59.79 68.86
2 9.1 7.0 2.45 20.8 65.00 73.07
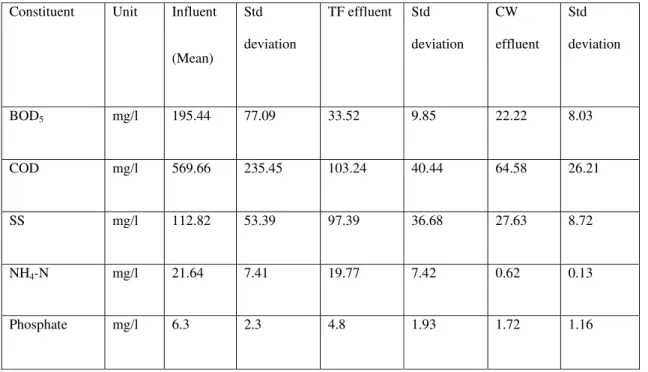
Table 6. Mean and standard deviation of the effluent concentration of trickling filter and CWs
Constituent Unit Influent
(Mean) Std
deviation
TF effluent Std
deviation
CW
effluent Std
deviation
BOD5 mg/l 195.44 77.09 33.52 9.85 22.22 8.03
COD mg/l 569.66 235.45 103.24 40.44 64.58 26.21
SS mg/l 112.82 53.39 97.39 36.68 27.63 8.72
NH4-N mg/l 21.64 7.41 19.77 7.42 0.62 0.13
Phosphate mg/l 6.3 2.3 4.8 1.93 1.72 1.16
Table 7. Mean removal efficiency (%) of each unit and of the system as a whole.
Constituent Trickling filter Constructed wetland Trickling filter+cw
BOD5 82.84 33.31 89.68
COD 81.88 37.44 88.66
SS 26.96 71.45 75.56
NH4-N 8.64 96.66 97.13
Figure 2(a) COD concentration along the treatment line
30 40 50 60 70 80 90
1 2 3
TF CW TF+CW
Ef
fi
c
ie
n
c
y
max
max min
min
min max
Figure 2(b) COD removal efficiencies in each unit and in the overall system
max
max
max
min
min min
0 100 200 300 400 500 600 700 800 900 1000
1 2 3
Influent TF CW
Con
centration
(m
g
/l
)
Figure 3 (a) BOD5 concentration along the treatment line
33 43 53 63 73 83 93
1 2 3
TF CW TF+CW
E
ffi
c
ie
n
c
y
max
min
min max
max
min
Figure 3. (b) BOD removal efficiencies in each unit and in the overall system
max
max
max min
min min
0 50 100 150 200 250 300 350
1 2 3
Influent TF CW
Concentr
at
ion
(m
g
Figure 4 (a) SS concentration along the treatment line
Figure 4 (b) SS removal efficiencies in each unit and in the overall system
max
max max
min
min
min
0 10 20 30 40 50 60 70 80 90
1 2 3
TF CW TF+CW
Effi
cie
n
cy
max
max
max min
min
min 0
40 80 120 160 200
1 2 3
Influent TF CW
Conc
entrati
o
n
(m
g
/l)
0 10 20 30
1 2 3
Influent TF CW
C
o
n
c
en
tr
a
ti
o
n (m
g/
l)
max
max
min
min max min
Figure 5(a) NH4-N concentration along the treatment line
Figure 5 (b) NH4-N removal efficiencies in each unit and in the overall system
max
max max
min
min min
0 20 40 60 80 100 120
1 2 3
TF CW CW+TF
E
fficien
Figure 6(a) Phosphate concentration along the treatment line
Figure 6 (b) Phosphate removal efficiencies in each unit and in the overall system
Reference
[1] Alvarez, J.A., Ruiz,I & Soto, M 2008 Anaerobic digesters as a pre-treatment for constructed wetlands. Eco.Eng.3(3), 54-67.
[2] APHA, 1985 and 2005,Standard methods for the Examination of Water and Wastewater,American Public Health Association Washington DC, USA.
[3] Brix, H. (1998). Denmark. In: Constructed wetlands for wastewater treatment in Europe, J. Vymazal, H. Brix, P.F. Cooper, M.B. Green, R Haberl (eds), Backhuys Publishers, Leiden, The Netherlands, pp.123-152.
[4] Boutin, C., Lienard, A and Esser, D. (1997). Development of a new generation of reed- bed filters in France: first results. Wat. Sci. Tech., 35(5). 315-323.
[5] Haberl, R., (1999). Constructed wetlands: A chance to solve wastewater problems in developing countries. Wat.Sci.Tech 40,(3), 11-17.
[6] Kayser, K and Kunst, S. (2005). Processes in vertical-flow reed beds : nitrification, oxygen transfer and soil clogging Wat.Sci Tech Vopl 51 , No.9, pp 177-184.
[7] Luiz S. Philippi, Rejane H. R. da Costa and Pablo H. Sezerino. (1999). Domestic effluent treatment through integrated system of septic tank and root zone. Wat. Sci. Tech. 40 (3) : 125-131F.
[8] Masi, B. El Hamouri, H. Abdel Shafi, A. Baban, A. Ghrabi and M. Regelsberger (2010). Treatment of segregated black/grey domestic wastewater using constructed wetlands in the Mediterranean basin: the zer0-m experience. Water Science & Technology—WST Vol 61 No 1 pp 97–105
[9] Mbuligwe, S.E. 2004. Comparative effectiveness of engineered wetland systems in the treatment of anaerobically pre-treated domestic
max max max min min min 0 10 20 30 40 50 60 70 80 90 100
1 2 3
TF CW CW+TF
Efficiency max max max min min min 0 1 2 3 4 5 6 7 8 9 10
1 2 3
Influent TF CW
[11] Schierup, H.-H and Brix, H.(1990). Danish experience with emergent hydrophyte treatment systems (EHTS) and prospects in the light of future requirements to outlet quality. Wat. Sci.Tech.,22(3/4), 65-72.
[12] Schonerklee, M., Koch, F., Perfler, R., Haberl, R. And Laber, J (1997). Tertiary treatment in a vertical flow reed bed system – a full scale pilot plant foe 200-600 pe. Wat. Sci.Tech.,35(5), 223-230.
[13] Surampalli, S.K. Banerji, R.D. Tyagi and P.Y. Yang Integrated advanced natural wastewater treatment system for small communities. Water Science & Technology Vol 55 No 11 pp 239–243
[14] Vymazal, J (1995), Constructed wetlands for wastewater treatment.ENVI Trebon, Czech Republic (in Czech).