Associated with Response to Pioglitazone Treatment in
Type 2 Diabetic Patients from Southern China
Hong Yang1,2., Enling Ye1,2., Guangxin Si3
, Liangmiao Chen1,2, Lingqiao Cai1,2, Chengfu Ye1,2, Chi Zhang2, Xuemian Lu1,2*
1Department of Endocrinology, the Third Hospital Affiliate to Wenzhou Medical University, Ruian, Zhejiang, China,2Ruian Center of the Chinese-American Research Institute for Diabetic Complications, the Third Affiliated Hospital of the Wenzhou Medical University, Wenzhou, China,3Department of Endocrinology, Shangdong Jining No. 1 People’s Hospital, Jining, Shangdong, China
Abstract
Introduction:Insulin sensitizing drugs such as pioglitazone are not uniformly treatment effective among individual type 2 diabetic patients. Here, the relationship of pioglitazone efficacy to single nucleotide polymorphisms (SNP) of the adiponectin gene, a critical gene directly regulated by the drug, was examined in a cohort of Chinese Han type 2 diabetic patients.
Methods:Eighty type 2 diabetic patients were treated with pioglitazone (15 mg/day) for 12 weeks without interruption of their current therapeutic regimen. Fasting plasma glucose, fasting insulin, homeostasis model assessment for insulin resistance (HOMA-IR), and glycated hemoglobin (HbA1c%) were collected both prior to and following pioglitazone treatment. Response to pioglitazone was defined as a decrease of at least 15% in HbA1c% levels. Three regions of the adiponectin gene containing SNPs (promoter, intron 2 and exon 2, and exon 3) were amplified and sequenced to determine genotype.
Results:Serum adiponectin levels were significantly increased (p,0.001) whereas fasting plasma glucose, fasting insulin,
HOMA-IR, and HbA1c% values were significantly decreased relative to baseline measurements (p,0.001). Response of
patients with TG and TT genotypes at rs2241766 (exon2; 52.9% vs. 12.7%, respectivelyp= 0.001) was statistically significant
relative to all other patients. Amongst rs2241766 TG and TT patients, the mean decrease in HbA1c% levels was greater where the genotype was TG (1.1560.80 vs. 0.5260.64,p= 0.001).
Conclusions:The adiponectin gene polymorphism rs2241766 T/G is associated with pioglitazone efficacy in type 2 diabetic patients, and status of the polymorphism may be an important clinical factor to consider prior to pioglitazone treatment.
Citation:Yang H, Ye E, Si G, Chen L, Cai L, et al. (2014) Adiponectin Gene Polymorphism rs2241766 T/G Is Associated with Response to Pioglitazone Treatment in Type 2 Diabetic Patients from Southern China. PLoS ONE 9(11): e112480. doi:10.1371/journal.pone.0112480
Editor:Harpal Singh Randeva, University of Warwick – Medical School, United Kingdom
ReceivedJuly 21, 2014;AcceptedOctober 3, 2014;PublishedNovember 18, 2014
Copyright:ß2014 Yang et al. This is an open-access article distributed under the terms of the Creative Commons Attribution License, which permits unrestricted use, distribution, and reproduction in any medium, provided the original author and source are credited.
Data Availability:The authors confirm that all data underlying the findings are fully available without restriction. All relevant data are within the paper.
Funding:This study was supported by a research grant from the Wenzhou Science and Technology Plan (Y20080007, to XL). The funders had no role in study design, data collection and analysis, decision to publish, or preparation of the manuscript.
Competing Interests:The authors have declared that no competing interests exist. * Email: [email protected]
.These authors contributed equally to this work.
Introduction
Type 2 diabetes mellitus (T2DM) is on the rise in current populations worldwide due to changes in weight, for example. Alternative therapeutic strategies are necessary, as patients are known to develop resistance to treatment with insulin. A breakthrough in strategies for these patients occurred when it was discovered that adipocytes secrete a protein, adiponectin (ADIPOQ), which plays a role in in the regulation of glucose and lipid metabolism [1]. ADIPOQ is encoded by one of the most abundant adipose gene transcripts [2]. Regulation of the gene is known to occur at least in part through the nuclear receptor transcription factor, peroxisome proliferator activated receptorc
(PPARc) [3]. Pharmacological compounds, such as the thiazoli-dinediones (TDZ), that target PPARc activity have thus been exploited as insulin sensitizers, and are now widely used for the treatment of insulin resistance in T2DM patients.
recent years, many SNPs in ADIPOQ, have been linked to body mass index (BMI), insulin sensitivity, and T2DM in some cross-sectional studies [4,7–9]. However, relatively few studies have addressed whetherADIPOQgene polymorphisms are associated with pioglitazone therapeutic efficacy. The results so far have not been consistent. In a study with 113 T2DM Chinese patients, the rs266729 polymorphism was associated with response to pioglita-zone, whereas in an Iranian population, the rs2241766 and rs16928751 polymorphisms were not related to response [10,11]. In the current study, the association ofADIPOQgene polymor-phisms with pioglitazone therapeutic efficacy was investigated in Chinese Han patients with T2DM.
Materials and Methods
Ethics statement
The study protocol was approved by the ethics committee of the Third Affiliated Hospital of Wenzhou Medical University. The 80 unrelated individuals were long-term residents in the Wenzhou area of China, and all patients signed the informed consent prior to the study.
Patients
Data were collected from a total of 80 outpatients with T2DM. All patients were derived from the Chinese Han population treated at the Department of Endocrinology of the Third Affiliated Hospital of Wenzhou Medical University between the years 2010 to 2012. Patients included 32 men and 48 women whose ages ranged from 34 to 80 yr (mean 57.05610.48 yr). T2DM was diagnosed according to the World Health Organization criteria from 1999: (1) random plasma glucose$11.1 mmol/L, fasting plasma glucose (FPG) $7.0 mmol/L, or 2-hour oral glucose tolerance test result was$11.1 mmol/L; (2) symptomless: repeat the test a second time on a different day to confirm the diagnosis; (3) any stress (due to infection, trauma, or condition) that causes the level of blood glucose to temporarily rise was excluded. The inclusion criteria were as follows: (1) FPG between 7.0 and 14.0 mmol/L and glycated hemoglobin (HbA1c%) between 7.0 and 11.5%; (2) no change in antidiabetic agents in the last three months; (3) no TZD medications of any type in the past year; and (4) no pregnancy within the past year. Patients were excluded on the basis of the following criteria: (1) type 1 diabetes; (2) a history of diabetic ketoacidosis or acute complications of diabetes, such as hyperosmolar hyperglycemic state; (3) ischemic heart disease or heart failure class II to IV (New York Heart Association; NYHA); (4) insulin treatment; and (5) pregnancy or nursing.
Clinical measurements
Patients took 15 mg/day pioglitazone orally for 12 weeks without interruption of their current therapeutic regimen for T2DM. Venous blood samples were collected from patients after fasting overnight. Clinical and biochemical data, including age, height, weight, waist circumference (WC), blood pressure, fasting plasma glucose (FPG), fasting insulin, HbA1c%, total cholesterol (TC), triglycerides (TG), high-density lipoprotein cholesterol (HDL-C), low-density lipoprotein cholesterol (LDL-C), and ADIPOQ were collected from all 80 patients. FPG, TC, HDL-C, LDL-HDL-C, and TG were determined with the Olympus AU 5400 Automatic Biochemical Analyzer (Olympus Corporation, Mis-hama, Japan). Serum insulin levels were determined with the Beckman Uncicel DxI 800 Chemiluminescence Analyzer (Beck-man-Coulter, Fullerton, CA). Serum ADIPOQ levels were detected by a double antibody sandwich ELISA (Shanghai Westang Bio-tech Co., Ltd.; Shanghai, China). The insulin
resistance (IR) index was assessed by homeostasis model assess-ment (HOMA). The following formula was used to calculate the IR index: HOMA-IR = (FPI6FPG)/22.5 where 22.5 is a constant.
Efficacy evaluation
Clinical samples were analyzed, and "effectiveness" was defined as a decrease in the HbA1c% level by more than 15% relative to the baseline measurement (prior to piaglitazone treatment) in individual patients.
Genotyping analyses
Genomic DNA was isolated from patient blood with a DNA extraction kit according to the manufacturer’s protocol (Shanghai Generay Biotech Co., Ltd.; Shanghai, China). Adiponectin gene SNPs were amplified by polymerase chain reaction (PCR). Primer pairs (Shanghai Generay Biotech Co., Ltd.) were designed using Primer Premier 5 and Oligo 6.0 software to amplify three regions of the adiponectin gene containing 13 polymorphisms (rs266729, rs16861194, rs1501299, rs2241767, rs3821799, rs145335235, rs3774261, rs2241766, rs17846872, rs35469083, rs1063537, rs2082940, rs1063538): promoter, upstream of exon 2 and intron 2, and upstream of intron 3 (Table 1). The reactions were performed in a total volume of 25ml containing 0.1-1ug DNA, 0.8ml of each primer (10mmol/L), and 12.5ml 26PCR Master Mix (Thermo Scientific; Pittsburgh, PA, USA). The cycling parameters for PCR were the following: denaturation 94uC 4 min, followed by 30 cycles of denaturation 94uC 40 s, annealing 56uC 35 s, and extension 72uC 40 s. Specificity of PCR was confirmed by 5% polyacrylamide gel electrophoresis, and products were commercially sequenced (Shanghai Sangon Biological Engineering Technology & Services Co., Ltd.; Shanghai, China).
Statistical analysis
Statistical analyses were performed with SPSS software Version 16.0 for Windows (SPSS Inc.; Chicago, IL, USA). Data showing a normal distribution were summarized as the mean 6 standard deviation (SD), and data showing a non-normal distribution were summarized as medians (P25%–P75%). Data with a normal distribution were compared with a Student’s t-test; data with non-normal distributions were compared with the Wilcoxon rank-sum test. Numeration data were presented as a frequency and compared using the chi-square test. The relationship between the therapeutic efficacy of pioglitazone and individual polymor-phic variants of the adiponectin gene was analyzed using the chi-square test. Logistic regression analysis of relevant variables was performed to identify predictors for therapeutic efficacy of pioglitazone. A value ofp,0.05 was considered to be statistically significant.
Results
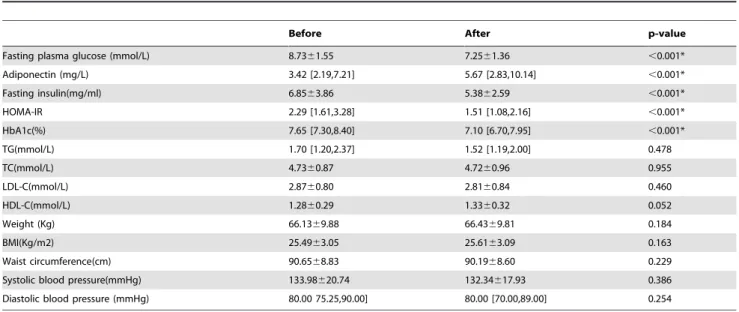
Clinical characteristics are regulated by pioglitazone
respec-tively;p,0.001). Lower levels of FPG, fasting insulin, HOMA-IR, and HbA1c%, in combination with higher serum ADIPOQ concentration indicated that pioglitazone had beneficial effects on the patients. Other clinical indicators (TC, TG, LDL-C and HDL-C) did not change significantly when examined as a group; neither did weight, BMI, WC, and systolic or diastolic blood pressures.
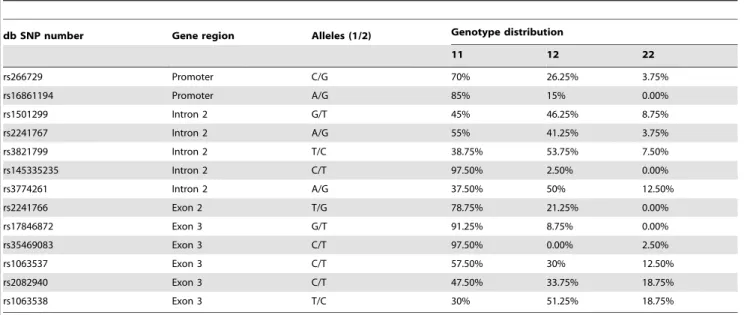
Genotyping
Thirteen SNPs of theADIPOQ gene were genotyped in this study. The distribution of all genotypes (homozygous and heterozygous polymorphic variants) and allelic frequencies are shown in Table 3. All SNPs were found to be in Hardy-Weinberg equilibrium (p.0.05). However, three SNPs (rs35469083, rs17846872 and rs145335235) were eliminated from further analysis due to a low frequency in the target patient population.
Effectiveness of pioglitazone treatment
In general, HbA1c concentrations are used as the definitive measure for whether a drug has any health benefits for patients. Any decrease by greater than 15% is defined as a response to pioglitazone. After 12 weeks of pioglitazone treatment, 21.25% of the 80 patients achieved a decrease in HbA1c% of$15%.
rs2241766 is independently associated with response to pioglitazone
In general, pioglitazone appeared to be beneficial to patients. However, the major objective was to determine whether the overall efficacy of pioglitazone could be attributed to any specific subgroups of patients. Patients were, thus, grouped according to their genotype, and the change in HbA1c% levels was determined. The patients exhibiting the greatest response to 12 weeks of treatment with pioglitazone were in the group with the rs2241766 (exon 2) TG genotype (52.9%). A second rs2241766 genotype, TT, was also associated with an increased response to pioglitazone within this timeframe (12.7%). The difference in the response of patients between rs2241766 genotype TG and TT was statistically significant (p= 0.001). No other associations between individual
ADIPOQ gene polymorphisms and response to pioglitazone treatment were found (Table 4). Finally, logistic regression analysis revealed that rs2241766 was independently associated with response to pioglitazone. Patients carrying the TG genotype responded significantly better in general to pioglitazone compared to the patients carrying the TT genotype (OR = 11.483, 95% CI = 2.637–50.002,p= 0.001; Table 5).
Table 1.Polymerase chain reaction primers and the amplified products for adiponectin gene polymorphisms.
Region Primer sequence Fragment
Promoter F:59-TGGTGGACTTGACTTTACTGGT-39 563 bp
R:59-GCTTGTGGCCTCGAATCGTA-39
Intron 2 and exon 2 F:59-TGCTGTTGCTGGGAGCTGTTCT-39 738 bp
R:59-CATTCTTCATCAGGTCCACGGT-39
Exon 3 F:59-TGAATCCCATATCTACCC-39 609 bp
R:59-TCATGCCACTGCACTCTA-39
F: Forward primer; R: Reverse primer. doi:10.1371/journal.pone.0112480.t001
Table 2.Clinical characteristics of subjects before and after pioglitazone treatment.
Before After p-value
Fasting plasma glucose (mmol/L) 8.7361.55 7.2561.36 ,0.001*
Adiponectin (mg/L) 3.42 [2.19,7.21] 5.67 [2.83,10.14] ,0.001*
Fasting insulin(mg/ml) 6.8563.86 5.3862.59 ,0.001*
HOMA-IR 2.29 [1.61,3.28] 1.51 [1.08,2.16] ,0.001*
HbA1c(%) 7.65 [7.30,8.40] 7.10 [6.70,7.95] ,0.001*
TG(mmol/L) 1.70 [1.20,2.37] 1.52 [1.19,2.00] 0.478
TC(mmol/L) 4.7360.87 4.7260.96 0.955
LDL-C(mmol/L) 2.8760.80 2.8160.84 0.460
HDL-C(mmol/L) 1.2860.29 1.3360.32 0.052
Weight (Kg) 66.1369.88 66.4369.81 0.184
BMI(Kg/m2) 25.4963.05 25.6163.09 0.163
Waist circumference(cm) 90.6568.83 90.1968.60 0.229
Systolic blood pressure(mmHg) 133.98620.74 132.34617.93 0.386
Diastolic blood pressure (mmHg) 80.00 75.25,90.00] 80.00 [70.00,89.00] 0.254
HOMA-IR, homeostasis model assessment for insulin resistance; HbA1c, glycated hemoglobin; TG, triglyceride; TC, total cholesterol; LDL-C, low-density lipoprotein cholesterol; HDL-C, high-density lipoprotein cholesterol; BMI, body mass index.
Mean changes in clinical characteristics before and after pioglitazone treatment are statistically significant between genotypes
The previous analysis was based on the number of patients, out of 80 total or within genotype subgroups, with$15% change in HbA1c%. In order to gain further insight into the physiological benefits of pioglitazone to patients, genotype was examined with regard to each clinical parameter in terms of mean change between the measurements made prior to and following treatment. Polymorphisms at rs2241766 exhibited statistically significant changes within clinical correlates in response to treatment that were not apparent in the previous analysis. The mean decrease in HbA1c% levels after pioglitazone treatment was greater in patients with the rs2241766 genotype TG than the patients with genotype
TT (TG: 1.1560.80% vs. TT: 0.5260.64%,p= 0.001), indicating a synergy of the G allele (rs2241766) with efficacy of pioglitazone in these patients. There were no other significant differences of mean change in FPG, fasting insulin, HOMA-IR, ADIPOQ, TG, TC, LDL-C, HDL-C, BMI, and WC between rs2241766 TG and TT genotypes (Table 6).
The second clinical correlate to emerge as a potential predictor of pioglitazone efficacy was WC. Genotypes of two SNPs within the intron 2 region of theADIPOQgene (rs3774261 and rs3821799) were associated with significant differences in WC. Patients of the rs3774261 genotypes AA and AG+GG experienced a significant mean decrease of WC (AA: 1.00 [20.63, 3.00] vs. AG+GG; 0.00 [21.00, 1.00];p= 0.019). The mean decrease in the insulin value, however, was less for genotype AA than for genotypes AG+GG
Table 3.SNP genotypes of the adiponectin gene and allele frequencies in the Chinese cohort.
db SNP number Gene region Alleles (1/2) Genotype distribution
11 12 22
rs266729 Promoter C/G 70% 26.25% 3.75%
rs16861194 Promoter A/G 85% 15% 0.00%
rs1501299 Intron 2 G/T 45% 46.25% 8.75%
rs2241767 Intron 2 A/G 55% 41.25% 3.75%
rs3821799 Intron 2 T/C 38.75% 53.75% 7.50%
rs145335235 Intron 2 C/T 97.50% 2.50% 0.00%
rs3774261 Intron 2 A/G 37.50% 50% 12.50%
rs2241766 Exon 2 T/G 78.75% 21.25% 0.00%
rs17846872 Exon 3 G/T 91.25% 8.75% 0.00%
rs35469083 Exon 3 C/T 97.50% 0.00% 2.50%
rs1063537 Exon 3 C/T 57.50% 30% 12.50%
rs2082940 Exon 3 C/T 47.50% 33.75% 18.75%
rs1063538 Exon 3 T/C 30% 51.25% 18.75%
doi:10.1371/journal.pone.0112480.t003
Table 4.Association of adiponectin gene SNP with response to pioglitazone.
SNP Response rate P-value (x2) SNP Response rate P-value (x2)
Rs1501299G/T Rs2241767A/G
GG 16.67% AA 27.27%
GT+TT 25% 0.365 AG+GG 13.89% 0.145
Rs2241766T/G Rs2082940C/T
TG 52.94% CC 26.32%
TT 12.70% 0.001* CT+TT 16.67% 0.292
Rs266729C/G Rs1063538T/C
CC 21.43% TT 20.83%
CG+GG 20.83% 0.952 TC+CC 21.43% 0.952
Rs16861194A/G Rs1063537C/T
AA 20.59% CC 26.09%
AG 25% 0.711 CT+TT 14.71% 0.219
Rs3821799T/C Rs3774261A/G
TT 19.35% AA 16.67%
TC+CC 22.45% 0.742 AG+GG 24% 0.438
(AA: 0.45 [20.24, 1.67]; AG+GG: 1.44 [0.33, 2.52];p= 0.030). For the second intron 2 polymorphism (rs3821799), the mean decrease in WC was significantly greater in those patients with genotype TT than in those with the other genotypes (TT: 1.2362.59 cm; TC+CC: 20.0362.39 cm; p= 0.033; Table 7). No significant differences in the mean change of FPG, fasting insulin, HbA1c%, HOMA-IR, ADIPOQ, TG, TC, LDL-C, HDL-C, BMI, or WC after pioglitazone treatment were found when rs2241767 and rs1501299 genotypes within the intron 2 region of
ADIPOQgene were examined (Table 8).
Interestingly, in light of the fact that pioglitazone influences transcription of ADIPOQ, the two SNPs within the promoter region of theADIPOQgene (rs266729 and rs16861194), were not associated with a significant difference in the mean change of FPG, fasting insulin, HbA1c%, HOMA-IR, ADIPOQ, TG, TC, LDL-C, HDL-LDL-C, BMI, or WC between patients with rs266729 genotypes CC and CG + GG or between patients with rs16861194 genotypes AA and AG (data not shown).
Likewise, the mean changes in FPG, fasting insulin, HbA1c%, HOMA-IR, ADIPOQ, TG, TC, LDL-C, HDL-C, BMI, and WC after the pioglitazone treatment were not significantly different among the three SNPs within the exon 3 region of theADIPOQ
gene (rs2082940, rs1063538 and rs1063537; data not shown).
Discussion
Individual differences in patient response to pioglitazone do exist, and many studies have focused on underlying genetic diversity at the ADIPOQ locus as the fundamental cause. Although there is agreement among studies performed by various investigators thatADIPOQgene polymorphisms do influence the response to pioglitazone in T2DM patients, the results of individual studies are inconsistent [11,12,13]. The primary objective of this prospective intervention study was to determine whether genetic variation in theADIPOQgene might be the basis for the inconsistencies reported in response to pioglitazone treatment. The results revealed two major points. Firstly, the decrease in HbA1c% levels after the pioglitazone treatment was greater in those patients with the rs2241766 TG genotype than in patients with other genotypes. Secondly, where response was not evident by the HbA1c% criteria, significant changes in individual clinical correlates were associated with genotypes of individual polymorphisms. For example, the mean change in the FPG levels between the rs3774261 AA and AG + GG genotypes was significantly different. These findings may be clinically relevant
to predict patients who will benefit most from pioglitazone treatment.
The most straightforward scenario for differences in pioglita-zone response would be that the transcriptional activity of PPARc, and thus plasma ADIPOQ levels, may differ based on sequence variability in the promoter region of the gene. Although pioglitazone has been shown to directly regulate transcription of theADIPOQgene through PPARc, our data indicate ironically that there is no association between polymorphisms in the promoter region of the ADIPOQ gene (rs266729 and rs16861194) and response to the drug. The present findings confirm some of the previous findings reported on 80 northern Chinese Han patients with T2DM [10]. This study also revealed that there was no association between the promoter polymorphism rs16861194 and pioglitazone response. However, a weak associ-ation between a polymorphism in the second promoter region (rs266729) and HbA1c% values was found [10]. Specifically, rs266729 CG + GG versus CC was associated with a greater decrease in the HbA1c% value after the pioglitazone treatment (0.13% vs. 0.08%). Treatment protocols between the two studies differed slightly and may account for the association in their results: 10 weeks of treatment pioglitazone at a dose of 30 mg/day study [10] versus 12 weeks at a dose of 15 mg/day in this study. The synonymous ADIPOQ SNP, rs2241766 (+45 T.G, glycine-to-glycine change), is one of the most common polymor-phisms of the gene. Rs2241766 is in close proximity to the splice junction of intron 1 and exon 2 and may affect the splicing of the mRNA. Differences in response to pioglitazone may, thus, be the result of subsequent changes in ADIPOQ protein levels and activity. One of the interesting findings from our study is that the rs2241766 polymorphism was significantly associated with the response to pioglitazone in patients. Furthermore, response amongst these patients alone differed based on genotype. The response rate and mean decrease in HbA1c% values with pioglitazone treatment for patients with genotype TG was 52.94% and 1.15%, respectively. A response and mean decrease was also evident in HbA1c% values for patients with the TT genotype but to a lesser degree, 12.70% and 0.52%, respectively. These differences between the genotypes were statistically significant (p,0.001), indicating that a base pair difference of G to T may influence the efficacy of pioglitazone.
As one of the most common polymorphisms of the ADIPOQ
gene, rs2241766 has been examined for association to treatment response by other investigators. In Iranian patients with T2DM, the rs2241766 polymorphism was not found to be associated with
Table 5.Logistic regression analysis for the influence of clinical and genetic factors on the response to pioglitazone treatment.
Variable Odds ratio 95% CI P-value
Rs1501299 (GT+TT vs. GG) 1.718 0.408–7.230 0.461
Rs2241767 (AA vs. AG+GG) 1.201 0.236–6.120 0.826
Rs3821799 (TC+CC vs. TT) 1.131 0.139–9.204 0.908
Rs3774261 (AG+GG vs. AA) 1.209 0.156–9.352 0.856
Rs266729 (CC vs. CG+GG) 1.219 0.307–4.836 0.778
Rs16861194 (AG vs. AA) 1.274 0.231–7.019 0.781
Rs1063537 (CC vs. CT+TT) 2.972 0.492–17.947 0.235
Rs2082940 (CC vs. CT+TT) 1.303 0.308–5.515 0.719
Rs1063538 (TC+CC vs. TT) 1.255 0.283–5.562 0.765
Rs2241766 (TG vs. TT) 11.483 2.637–50.002 0.001*
the response to pioglitazone [11], although overall Iranian patients did respond better to pioglitazone, 31.7% versus 21.25% in our study. The basis for the difference in response in Iranian patients is unknown and may be due to ethnic differences in the populations analyzed [14,15]. One other possibility is that pioglitazone has physiological effects in addition to transcription mediated by PPARc[16].
Rs2082940, rs1063538 and rs1063537, polymorphisms in exon 3 regions of the ADIPOQ gene, were also examined for associations with therapeutic efficacy of pioglitazone was investi-gated. However, there was no evidence of an association between response to pioglitazone and these polymorphisms. Additional studies including larger cohorts, as well as other common
polymorphisms in ADIPOQ gene, will be helpful to further confirm our results.
A final analysis was performed to identify associations between polymorphisms and specific clinical phenotypes that might be obscured simply because of our definition of response to treatment. In this analysis, a unique, previously undescribed relationship of respone to pioglitazone with intron 2 SNPs, rs3774261, rs3821799, rs2241767, and rs1501299, emerged. Two clinical parameters, WC and insulin resistance, exhibited significant changes in patients with specific SNPs. The mean change in WC was significantly greater in treated patients with the rs3821799 genotype AA compared to those carrying genotypes AG + GG (P = 0.019). In contrast, the reduction in the insulin
Table 6.Clinical characteristics of patients with various genotypes for the rs2241766 before and after the administration of pioglitazone.
rs2241766 P-value
TT TG
FPG (mmol/L) Before treatment 8.6261.52 9.1761.61 0.195
After treatment 7.2261.43 7.4061.07 0.637
Mean change 1.4061.88 1.7761.21 0.440
Fasting insulin (mg/ml) Before treatment 6.8764.14 6.8162.67 0.959
After treatment 5.2462.62 5.8962.51 0.362
Mean change 1.14 [20.02,2.51] 0.71 [0.07,1.35] 0.473
HbA1c (%) Before treatment 7.60 [7.20,8.20] 7.90 [7.30,8.95] 0.256
After treatment 7.4160.94 7.1261.05 0.286
Mean change 0.5260.64 1.1560.80 0.001*
HOMA-IR Before treatment 2.16 [1.46,3.26] 2.45 [1.94,3.39] 0.298
After treatment 1.47 [1.06,2.02] 1.83 [1.22,2.39] 0.137 Mean change 0.66 [0.11,1.23] 0.77 [0.34,1.16] 0.663
Adiponectin (mg/L) Before treatment 4.5163.92 6.0763.64 0.145
After treatment 6.6365.07 8.4865.03 0.185
Mean change 22.1163.95 22.4165.19 0.800
TG (mmol/l) Before treatment 1.8460.95 2.1460.90 0.249
After treatment 1.46 [1.16,2.19] 1.62 [1.31,1.86] 0.394
Mean change 0.0160.78 0.2860.106 0.245
TC (mmol/l) Before treatment 4.6560.85 5.0260.91 0.120
After treatment 4.7261.00 4.7460.87 0.955
Mean change 20.0760.90 0.2860.90 0.153
LDL-C (mmol/l) Before treatment 2.8460.83 2.9960.69 0.479
After treatment 2.8160.87 2.8160.70 0.998
Mean change 0.0360.75 0.1860.70 0.447
HDL-C (mmol/l) Before treatment 1.2960.29 1.2660.31 0.667
After treatment 1.3560.34 1.2660.23 0.261
Mean change 20.0660.22 0.0060.23 0.297
BMI (kg/m2) Before treatment 25.6363.28 24.9461.96 0.276
After treatment 25.7663.34 25.0561.86 0.253
Mean change 20.1360.83 20.1160.65 0.930
Waist circumference (cm) Before treatment 91.4169.43 87.8265.43 0.049*
After treatment 90.9169.04 87.5366.20 0.151
Mean change 0.00 [21.00,2.00] 0.00 [22.00,1.25] 0.609
FPG, fasting plasma glucose; HOMA-IR, homeostasis model assessment for insulin resistance; HbA1c, glycated hemoglobin; TG, triglyceride; TC, total cholesterol; LDL-C, low-density lipoprotein cholesterol; HDL-C, high-density lipoprotein cholesterol; BMI, body mass index.
rs3821799 p-value rs3774261 p-value
TT TC+CC AA AG+GG
FPG (mmol/L) Before treatment 8.6361.48 8.8161.60 0.622 8.5761.49 8.8361.59 0.469
After treatment 7.0961.43 7.3661.32 0.383 6.8861.27 7.4961.37 0.052
Mean change 1.5461.88 1.4461.69 0.810 1.7061.78 1.3561.75 0.396
Fasting insulin (mg/ml) Before treatment 6.0262.95 7.3864.29 0.125 6.1162.95 7.3064.29 0.183
After treatment 5.1062.01 5.5662.91 0.408 5.3162.29 5.4262.78 0.847
Mean change 0.59 [20.21,1.64] 1.25 [0.32,2.54] 0.076 0.45 [20.24,1.67] 1.44 [0.33,2.52] 0.030*
HbA1c (%) Before treatment 8.2061.34 7.8860.82 0.227 8.1761.30 7.9060.88 0.322
After treatment 7.4761.12 7.2760.86 0.374 7.4961.15 7.2660.83 0.345
Mean change 0.7460.68 0.6160.74 0.435 0.6860.74 0.6460.71 0.820
HOMA-IR Before treatment 2.16 [1.46,3.02] 2.43 [1.71,3.43] 0.187 2.06 [1.44,3.07] 2.44[1.68,3.37] 0.229
After treatment 1.47 [1.06,1.86] 1.69 [1.09,2.33] 0.477 1.6360.87 1.7760.87 0.491
Mean change 0.41 [0.21,0.82] 0.80 [0.30,1.27] 0.142 0.45 [0.19,0.92] 0.79[0.29,1.24] 0.178
Adiponectin (mg/L) Before treatment 3.15 [2.68,5.53] 4.14 [1.80,7.43] 0.726 3.06 [2.67,5.75] 4.29 [1.87,7.41] 0.773
After treatment 6.9664.82 7.0665.29 0.935 7.1265.59 6.9664.81 0.897
Mean change 22.4864.47 21.9964.07 0.615 22.4964.93 21.9963.75 0.604
TG (mmol/l) Before treatment 1.8460.93 1.9460.96 0.642 1.8560.95 1.9460.95 0.685
After treatment 1.46 [1.05,1.90] 1.55 [1.27,2.29] 0.186 1.61 [1.18,2.07] 1.48[1.22,2.06] 0.917
Mean change 0.2060.79 20.0160.88 0.286 0.1060.73 0.0560.92 0.778
TC (mmol/l) Before treatment 4.7960.83 4.6960.89 0.595 4.8960.73 4.6360.93 0.199
After treatment 4.6061.01 4.8060.93 0.365 4.6661.01 4.7660.95 0.649
Mean change 0.1960.86 20.1160.92 0.138 0.2360.77 20.1360.96 0.084
LDL-C (mmol/l) Before treatment 2.9660.86 2.8260.76 0.425 3.0160.81 2.7960.79 0.220
After treatment 2.8461.04 2.7960.69 0.807 2.8761.03 2.7860.71 0.636
Mean change 0.1260.73 0.0260.75 0.561 0.1560.67 0.0160.78 0.434
HDL-C (mmol/l) Before treatment 1.2460.31 1.3160.28 0.310 1.2960.29 1.2860.30 0.870
After treatment 1.3060.30 1.3560.33 0.460 1.3260.31 1.3460.33 0.830
Mean change 20.0660.16 20.0460.25 0.749 20.0360.13 20.0660.26 0.540
BMI (kg/m2) Before treatment 25.30
62.83 25.6063.20 0.666 25.6463.40 25.4062.85 0.734
After treatment 25.3462.84 25.7863.25 0.536 25.5963.24 25.6263.03 0.957
Mean change 20.0460.90 20.1860.71 0.446 0.0560.92 20.2360.69 0.126
Waist circumference(cm) Before treatment 89.7167.96 91.2469.37 0.452 91.3869.62 90.2168.39 0.568
After treatment 88.4868.30 91.2868.69 0.158 90.1869.65 90.2068.00 0.993
Mean change 1.2362.59 20.0362.39 0.033* 1.00 [20.63,3.00] 0.00 [21.00,1.00] 0.019*
FPG, fasting plasma glucose; HOMA-IR, homeostasis model assessment for insulin resistance; HbA1c, glycated hemoglobin; TG, triglyceride; TC, total cholesterol; LDL-C, low-density lipoprotein cholesterol; HDL-C, high-density lipoprotein cholesterol; BMI, body mass index.
doi:10.1371/journal.pone.0112480.t007
Adiponectin
Gene
Polymorphism
and
Pioglitazon
e
Treatment
ONE
|
www.ploson
e.org
7
November
2014
|
Volume
9
|
Issue
11
|
rs1501299 p-value rs2241767 p-value
GG GT+TT TT TG
FPG (mmol/L) Before treatment 8.3561.11 9.0561.78 0.034* 8.7461.3 8.7461.81 0.993
After treatment 7.1061.29 7.3961.42 0.342 7.3061.37 7.2161.36 0.779
Mean change 1.2561.43 1.6761.98 0.283 1.4461.70 1.5361.85 0.834
Fasting insulin (mg/ml) Before treatment 6.4462.94 7.2064.49 0.366 7.1063.92 6.5563.83 0.534
After treatment 5.33 3.69,7.00] 4.46 [3.16,6.92] 0.498 5.6562.57 5.0562.63 0.302
Mean change 0.67 [20.03,1.89] 1.11 [0.04,2.87] 0.442 0.88 [20.04,1.89] 1.23 [0.31,2.37] 0.505
HbA1c (%) Before treatment 7.40 [7.10,7.80] 8.10 [7.4,8.90] 0.001* 8.1961.12 7.7760.94 0.073
After treatment 7.0760.76 7.5761.06 0.016* 7.4161.00 7.2760.93 0.508
Mean change 0.5860.60 0.7260.80 0.348 0.7860.78 0.5160.60 0.081
HOMA-IR Before treatment 2.3661.05 2.9862.33 0.115 2.55 [1.63,3.38] 1.98 [1.57,3.17] 0.333
After treatment 1.6860.75 1.7460.96 0.764 1.66 [1.15,2.22] 1.18 [1.05,2.04] 0.138
Mean change 0.69 [0.24,0.93] 0.67 [0.14,2.02] 0.395 0.65 [0.24,0.98] 0.77 [0.15,1.25] 0.653
Adiponectin (mg/L) Before treatment 3.05 [1.54,5.29] 3.83[2.65,7.91] 0.042* 4.7863.97 4.9263.86 0.871
After treatment 5.93 [2.46,9.28 5.6 [2.94,11.81] 0.471 7.4064.76 6.5665.48 0.464
Mean change 22.3564.29 22.0364.18 0.737 22.6263.98 21.6364.46 0.299
TG (mmol/l) Before treatment 1.8960.86 1.9261.02 0.913 1.9660.85 1.8361.05 0.542
After treatment 1.46 [1.19,1.91] 1.61 [1.20,2.59] 0.431 1.62 [1.25,2.13] 1.38 [1.13,1.97] 0.216
Mean change 0.2560.76 20.0860.90 0.080 0.0360.92 0.1160.77 0.659
TC (mmol/l) Before treatment 4.5760.86 4.8660.86 0.143 4.7960.84 4.6660.91 0.514
After treatment 4.4360.79 4.9661.03 0.013* 4.8261.03 4.6160.88 0.343
Mean change 0.1460.92 20.1160.88 0.227 20.0360.97 0.0560.82 0.700
LDL-C (mmol/l) Before treatment 2.71 [2.30,3.24] 2.80 [2.40,3.32] 0.562 2.8860.74 2.8760.87 0.965
After treatment 2.78 [2.30,3.11] 2.70 [2.33,3.34] 0.681 2.8360.87 2.7960.81 0.845
Mean change 0.1260.82 0.0160.68 0.508 0.0560.87 0.0860.56 0.862
HDL-C (mmol/l) Before treatment 1.2460.30 1.3260.29 0.198 1.2660.28 1.3260.31 0.358
After treatment 1.2760.26 1.3860.35 0.118 1.3160.35 1.3760.28 0.383
Mean change 20.0360.22 20.0660.23 0.599 20.0560.20 20.0560.25 0.976
BMI (kg/m2) Before treatment 25.47
62.83 25.5063.25 0.976 25.6363.34 25.3162.68 0.635
After treatment 25.5162.90 25.6963.27 0.804 25.7463.27 25.4562.89 0.681
Mean change 20.0460.91 20.1960.68 0.398 20.1160.84 20.1560.74 0.827
Waist circumference(cm) Before treatment 90.5467.19 90.74610.05 0.919 91.0069.34 90.2268.27 0.698
After treatment 89.5767.34 90.7069.55 0.550 90.3869.21 89.9767.91 0.836
Mean change 1.0021.00,2.38] 0.0021.00,0.38] 0.149 0.00 [21.00,2.00] 0.00 [21.00,1.00] 0.506
FPG, fasting plasma glucose; HOMA-IR, homeostasis model assessment for insulin resistance; HbA1c, glycated hemoglobin; TG, triglyceride; TC, total cholesterol; LDL-C, low-density lipoprotein cholesterol; HDL-C, high-density lipoprotein cholesterol; BMI, body mass index.
doi:10.1371/journal.pone.0112480.t008
Adiponectin
Gene
Polymorphism
and
Pioglitazon
e
Treatment
ONE
|
www.ploson
e.org
8
November
2014
|
Volume
9
|
Issue
11
|
value of the rs3774261 genotype AG+GG patients was greater than for genotype AA (p= 0.030). Our results corroborate analysis performed on a cohort of Italian patients [17]. In the Iranian population, however, the putative relationship of the exon 2polymorphisms with WC was obscured. Only a non-significant association between the rs3821799 polymorphism and WC was observed [18].
The main trend of the future of medicine is personalized medicine, based in part on individual genotypes, in order to provide appropriate, safe, and economic use of a drug [19,20]. This study provides novel data on the relationship between SNP in the ADIPOQ gene and the response to pioglitazone. Several caveats however still exist regarding the results. The major limitation of this study is the small sample size. Secondly, the study does not illuminate the molecular mechanisms by which genotype
variants may influence the response to pioglitazone. Finally, the efficacy of pioglitazone is to a degree is dependent on environ-mental factors such as diet and exercise, and these factors were not addressed in this study. However, the results should stimulate further studies with a much larger sample size, perhaps encompassing more than simply the Chinese Han population, along with more strictly designed clinical and mechanistic studies.
Author Contributions
Conceived and designed the experiments: XL. Performed the experiments: GS EY. Analyzed the data: XL HY EY GS. Contributed reagents/ materials/analysis tools: L. Chen L. Cai CY CZ. Wrote the paper: XL HY EY GS.
References
1. Berg AH, Combs TP, Scherer PE (2002) ACRP30/adiponectin: an adipokine regulating glucose and lipid metabolism. Trends Endocrinol Metab 13: 84–89. 2. Takahashi M, Arita Y, Yamagata K, Matsukawa Y, Okutomi K, et al. (2000) Genomic structure and mutations in adipose-specific gene, adiponectin. Int J Obes Relat Metab Disord 24: 861–868.
3. Iwaki M, Matsuda M, Maeda N, Funahashi T, Matsuzawa Y, et al. (2003) Induction of adiponectin, a fat-derived antidiabetic and antiatherogenic factor, by nuclear receptors. Diabetes 52: 1655–1663.
4. Perez A, Zhao Z, Jacks R, Spanheimer R (2009) Efficacy and safety of pioglitazone/metformin fixed-dose combination therapy compared with piogli-tazone and metformin monotherapy in treating patients with T2DM. Curr Med Res Opin 25: 2915–2923.
5. Derosa G, Sibilla S (2007) Optimizing combination treatment in the management of type 2 diabetes. Vasc Health Risk Manag 3: 665–671. 6. Alwi ZB (2005) The Use of SNPs in Pharmacogenomics Studies. Malays J Med
Sci 12: 4–12.
7. Bouatia-Naji N, Meyre D, Lobbens S, Seron K, Fumeron F, et al. (2006) ACDC/adiponectin polymorphisms are associated with severe childhood and adult obesity. Diabetes 55: 545–550.
8. Yang WS, Yang YC, Chen CL, Wu IL, Lu JY, et al. (2007) Adiponectin SNP276 is associated with obesity, the metabolic syndrome, and diabetes in the elderly. Am J Clin Nutr 86: 509–513.
9. Ye E, Yang H, Chen L, Chen Q, Sun M, et al. (2014) Adiponectin and peroxisome proliferator-activated receptor-c gene polymorphisms and gene-gene interactions with type 2 diabetes. Life Sci 98: 55–59.
10. Li Z, Peng X, Wu Y, Xia Y, Liu X, et al. (2008) The influence of adiponectin gene polymorphism on the pioglitazone response in the Chinese with type 2 diabetes. Diabetes Obes Metab 10: 794–802.
11. Namvaran F, Rahimi-Moghaddam P, Azarpira N, Dabbaghmanesh MH (2012) Polymorphism of adiponectin (45T/G) and adiponectin receptor-2 (795G/A) in an Iranian population: relation with insulin resistance and response to treatment
with pioglitazone in patients with type 2 diabetes mellitus. Mol Biol Rep 39: 5511–5518.
12. Namvaran F, Azarpira N, Rahimi-Moghaddam P, Dabbaghmanesh MH (2011) Polymorphism of peroxisome proliferator-activated receptor gamma (PPAR-gamma) Pro12Ala in the Iranian population: relation with insulin resistance and response to treatment with pioglitazone in type 2 diabetes. Eur J Pharmacol 671: 1–6.
13. Balaji V (2013) Efficacy and safety of pioglitazone in type 2 diabetes in the Indian patients: Results of an observational study. Indian J Endocrinol Metab 17: 709–715.
14. Gu HF, Abulaiti A, Ostenson CG, Humphreys K, Wahlestedt C, et al. (2004) Single nucleotide polymorphisms in the proximal promoter region of the adiponectin (APM1) gene are associated with type 2 diabetes in Swedish caucasians. Diabetes 53 Suppl 1: S31–35.
15. Schwarz PE, Towers GW, Fischer S, Govindarajalu S, Schulze J, et al. (2006) Hypoadiponectinemia is associated with progression toward type 2 diabetes and genetic variation in the ADIPOQ gene promoter. Diabetes Care 29: 1645–1650. 16. Subbaramaiah K, Howe LR, Zhou XK, Yang P, Hudis CA, et al. (2012) Pioglitazone, a PPARcagonist, suppresses CYP19 transcription: evidence for involvement of 15-hydroxyprostaglandin dehydrogenase and BRCA1. Cancer Prev Res 5: 1183–1194.
17. Menzaghi C, Ercolino T, Di Paola R, Berg AH, Warram JH, et al. (2002) A haplotype at the adiponectin locus is associated with obesity and other features of the insulin resistance syndrome. Diabetes 51: 2306–2312.
18. Hasani-Ranjbar S, Amoli MM, Tabatabaei-Malazy O, Rumi Y, Tavakkoly-Bazzaz J, et al. (2012) Effect of adiponectin gene polymorphisms on waist circumference in patients with diabetes. J Diabetes Metab Disord 11: 14. 19. Daien CI, Morel J (2014) Predictive Factors of Response to Biological Disease
Modifying Antirheumatic Drugs: Towards Personalized Medicine. Mediators Inflamm 2014: 386148.