2014, Volume 3, Issue 1, pp. 553-568, Article ID Tech-255 ISSN 2320 - 0243
______________________________________________________________________________________________________
Assessing the Dynamic of Structural Changes in Cerrado
Vegetation of Protected and Non-Protected Areas using NDVI
Joao Arthur Pompeu Pavanelli and Elza Guimaraes
Department of Botany, IBB, UNESP, Univ Estadual Paulista, Botucatu, Sao Paulo, Brazil
Correspondence should be addressed to Joao Arthur Pompeu Pavanelli, [email protected]
Publication Date: 23 May 2014
Article Link: http://technical.cloud-journals.com/index.php/IJARSG/article/view/Tech-255
Copyright © 2014 Joao Arthur Pompeu Pavanelli and Elza Guimaraes. This is an open access article distributed under the Creative Commons Attribution License, which permits unrestricted use, distribution, and reproduction in any medium, provided the original work is properly cited.
Guest Editor-in-Chief: Dr. Qingmin Meng
(This article belongs to the Special Issue “Geospatial Information Sciences: Landscape and Ecosystem Applications”)
Abstract The structure of Brazilian savannah, named locally as “cerrado”, tends to change if the human pressures, such as pasture and intensive fire, are suppressed showing a densification of the physiognomies throughout the time. Vegetation Index acquired from remotely sensed data has been a proper way to study and monitoring large areas, and the Normalized Difference Vegetation Index (NDVI) is one of the most used for this purpose. The aim of this study was to assess the dynamic of structural changes in protected and non-protected areas of cerrado vegetation using NDVI. For this purpose, three cerrado fragments in the state of São Paulo, Brazil, were evaluated for a 26 year time span from 1985 and 2011, being two of them protected against anthropogenic interference. Landsat 5
–Thematic Mapper images were used and processed in ArcGIS. In the protected areas NDVI indicated that the vegetation followed the expected trend of changes for cerrado, with more open physiognomies tending to be denser throughout this period of 26 years, whereas in the non-protected fragment the NDVI evidences human pressure, showing lower phytomass in 2011. NDVI showed to be efficient in detecting and monitoring changes in cerrado vegetation structure, and can be useful to study both, the natural dynamics of cerrado vegetation and the anthropogenic interference in protected areas.
Keywords Brazilian Savannah; Phytomass; Remote Sensing
1. Introduction
The Cerrado (Brazilian savannah) phytogeographic domain occupies more than 20% of Brazilian territory [1], but the intense human pressure during twentieth century led to drastic vegetation suppression, remaining only 34% of original vegetation [2]. Its biodiversity is high expressive, and adding to the fast destruction that it has been submitted, Cerrado has been considered a hotspot for global conservation priorities [3].
International Journal of Advanced Remote Sensing and GIS
554
In São Paulo State, it is estimated that cerrado occupied 14% of its territory in the beginning of twentieth century and nowadays the remaining areas occupy minus than 1% of the total state area, and less than half of them are protected in Conservation Units [4]. Furthermore, most of the Guarani Aquifers recharge areas occur under Cerrado domain, increasing the importance and necessity of its preservation, recovery and conservation [5].
Cerrado presents a complex of physiognomies ranging from grass open vegetation to forest physiognomies [6]. The gradient of density, height and cover of woody species results in different physiognomies presenting an increasing of woody [7] and phytomass content, in this sequence: campo limpo: grasslands with no woody component; campo sujo: continuous grass vegetation, interspersed by few scrubs and small trees; campo cerrado: mid-sized trees, slightly denser than campo sujo, but don´t form canopy, because of the distance among the individuals; cerrado strictu sensu: a continuous grass layer overlaid by a discontinuous tree and shrub layer; cerradão: an almost closed canopy, forming woodlands [1, 4, 8].
Several studies in Brazil show the structural dynamic of the cerrado physiognomies along time, in which denser physiognomies, such as cerradão and cerrado strictu sensu replace less dense ones [8 9, 10, 11, 12]. These studies associate this structural changes to suppression of human impacts, mainly pasture and fire, assuming that the previous condition would be an ecosystem in which features would remain stable if kept anthropogenic interference, but tending to evolve to a denser physiognomy if protected [9].
In general, density and phytomass of the vegetation are related to the amount of leafs and to the amount and geometry of stems and branches [7]. In the case of cerrado vegetation, the amount of leaves is related to the structural gradient of the physiognomies and a rapid and non-destructive way to study and monitoring large-scales phytomass is the use of optical remote sensing [7, 13].
Among several techniques for interpreting qualitatively vegetation cover with optical remotely sensed acquired data, there are the Vegetation Indexes, which are numerical models, having a direct and satisfactory relationship with green leaf biomass [14, 15, 16]. One of the most used Vegetation Indexes is the Normalized Difference Vegetation Index (NDVI). The cerrado physiognomies show increasingly cylindrical volume from less dense to more dense vegetation [7], and the NDVI has a direct relationship with the cylindrical volume [14]. A strong relationship between NDVI and biomass has been demonstrated for cerrado vegetation [17].
The aim of this study was to assess the dynamic of structural changes of the cerrado physiognomies using NDVI, in three cerrado fragments of São Paulo state.
2. Materials and Methods
2.1. Study Areas
International Journal of Advanced Remote Sensing and GIS
555
Figure 1: Location Map of the Municipalities in which the Cerrado Fragments are placed in the State of São Paulo
(Gray Colour)
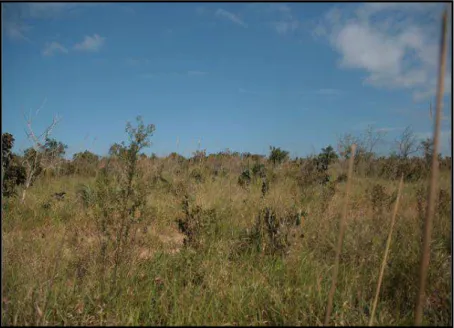
The cerrado fragment placed in Itirapina is part of an integral Conservation Unit, called “Estação Ecológica de Itirapina (ESECI), shown in Figure 2. Its total area is 2300 hectares. Campo sujo vegetation predominates with some disrupted patches of campo cerrado. The soil is classified as quartzarenic neosol [19].
Figure 2: Fragment of Cerrado Vegetation at Estação Ecológica de Itirapina (ESECI), Itirapina Municipality, São
Paulo State, Brazil
International Journal of Advanced Remote Sensing and GIS
556
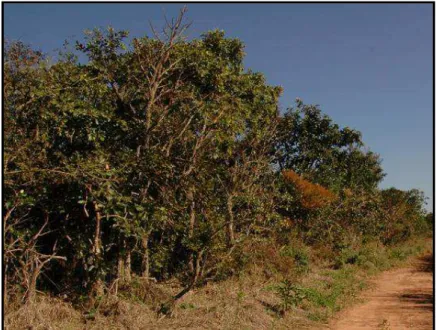
an area on the edge of a highway, surrounded by crops and therefore susceptible to distinct kinds of human impacts.
Figure 3: Fragment of Cerrado Vegetation at Botucatu Municipality, São Paulo State, Brazil
The Cerrado Reserve Palmeira da Serra (CRPS) (Figure 4) is a private reserve in the municipality of Pratânia, with 180 hectares and has areas of cerrado sensu strictu and cerrradão. Land use around this fragment is characterized by sugar cane and Eucalyptus crops. There are two types of soil, red-yellow latosol and red latosol [20].
Figure 4: Fragment of Cerrado Vegetation at Cerrado Reserve “Palmeira da Serra” (CRPS), Pratânia
Municipality, São Paulo state, Brazil (Photo: André Santachiara Fossaluza)
Polygons were drawn delimiting the perimeter of the fragments based on 2011 Landsat images, and
was used the ArcGIS tool “Extract by mask” for processing. From the total area of ESECI we used just
International Journal of Advanced Remote Sensing and GIS
557
2.2. Satellite Images
Landsat-5 Thematic Mapper images from 1985, March 19th and 2011, March 27th were used. This pre-drought period corresponds to the best season to separate cerrado physiognomies. From the spectral point of view, this period has a better contrast between open and dense physiognomies [14]. The study areas are located on the scenes orbit/point 220/75 and 220/76.
2.3. Image Processing
The images were registered using a Landsat-7 Enhanced Thematic Mapper orthorectified image, with the software TerraPixel. Other processing steps were made in ArcGIS, 9.3.
The vegetation index is sensitive to atmospheric interference and its necessary to correct this effect [21]. In this study was used the method developed by Chavez [22]. In this method, the atmospheric correction is achieved from the atmospheric interference estimate in each spectral band, and then the digital numbers are converted into radiance values (Equation 1) and following into reflectance (Equation 2).
Radiance values are obtained by the following equation (Equation 1):
Where, Lλ is the spectral radiance at the sensor´s aperture (W/m² sr m); Lmaxλ is the spectral
at-sensor radiance that is scaled to Qcalmax (W/m² sr m); Lminλ is the spectral at-sensor radiance that
is scaled to Qcalmin (W/m² sr m); Qcalmin is the minimum quantized calibrated pixel value
corresponding to Lminλ (Digital Number); Qcalmax is the maximum quantized calibrated pixel value corresponding to Lmaxλ (Digital Number); Qcal is the quantized calibrated pixel value (Digital Number) [23].
Reflectance in each band is obtained by the following equation (Equation 2):
Where, ρλ is the planetary Top-Of-Atmosphere (TOA) reflectance (unitless); π is the mathematical constant equal to ~3,14159 (unitless); Lλ is the spectral radiance at sensor´s aperture (W/m² sr m); d² is the square of Earth-Sun distance (astronomical units); Esun is the mean exoatmospheric irradiance
(W/m² m); Cosθ is the solar zenith angle (degrees) [23].
All values to calculate radiance and reflectance were obtained from (Chander et al., 2009) [23].
2.4. NDVI
Green leafs absorb solar radiation in the red spectral region (0, 6 micrometers) and use this radiation as a source of energy in the process of photosynthesis, whereas in the near-infrared spectral region (0, 8 micrometers) the energy is not enough to synthesize organic molecules, moreover the absorption in this wavelength would result in the overheating of the plant and possible damages to the tissues, so the plants reflects the energy in the near-infrared region.
(1)
International Journal of Advanced Remote Sensing and GIS
558
The Normalized Difference Vegetation Index is obtained by calculating the ratio between the difference in reflectance in the red spectral region (TM5 Band 3) and near-infrared (TM5 Band 4), divided by the sum of these wavelengths, according to the equation:
Where, NIR is the near-infrared spectral region that corresponds to the TM5 sensor band 4 and Red is the red spectral region that corresponds to the TM5 sensor band 3.
NDVI values vary from -1 to +1, and higher values are related to more dense vegetation (e.g. forest) and lower values are related to less dense vegetation, (e.g. grass fields). Exposed soil values may vary from 0, 2 to negative values, meanwhile water has negative values.
3. Results and Discussion
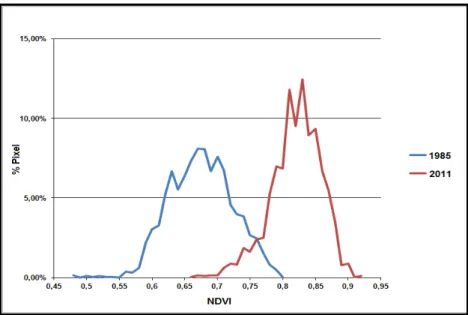
Comparison of the NDVI images and the histograms (Figures 5-6) shows that, over the twenty-six years range, the vegetation in CRPS (Figure 7-9) and in ESECI (Figures 8-10) followed the expected trend of changes in cerrado vegetation, observed in protected areas, with more open physiognomies tending to more dense vegetation with higher biomass.
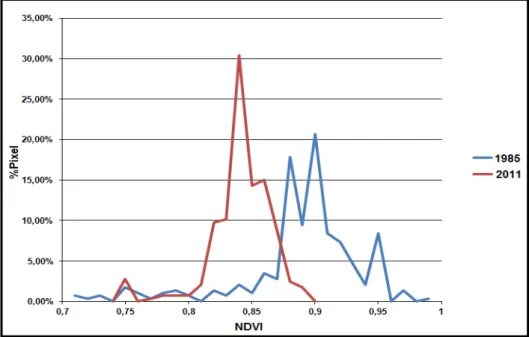
Figure 5: NDVI Values Histograms for the Fragment of Cerrado Vegetation at Cerrado Reserve “Palmeira da
Serra” (CRPS) in 1985 (Blue) and 2011 (Red)
International Journal of Advanced Remote Sensing and GIS
559
Figure 6: NDVI Values Histograms for the Fragment of Cerrado Vegetation at “Estação Ecológica de Itirapina”
(ESECI) in 1985 (Blue) and 2011 (Red)
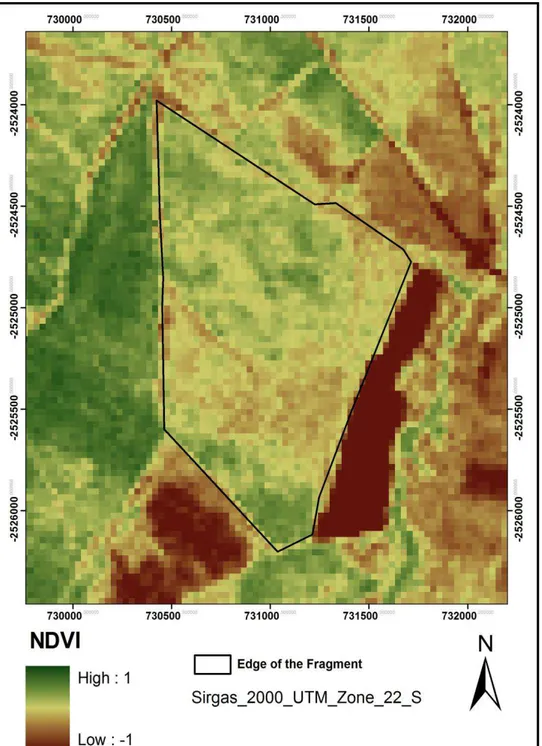
Figure 7 presents the NDVI map of the fragment of cerrado vegetation at Cerrado Reserve “Palmeira
da Serra” in 1985. It is possible to find out the heterogeneity of vegetation cover with NDVI varying
International Journal of Advanced Remote Sensing and GIS
560
Figure 7: Fragment of Cerrado Vegetation at Cerrado Reserve “Palmeira da Serra” (CRPS) NDVI image from
International Journal of Advanced Remote Sensing and GIS
561
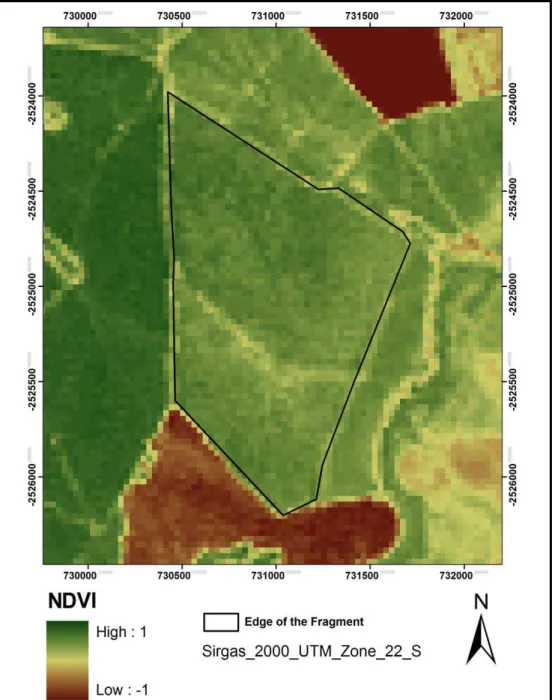
Figure 8: Fragment of Cerrado Vegetation at Cerrado Reserve “Palmeira da Serra” (CRPS) NDVI Image from
2011
In this fragment of cerrado there were indicated two main physiognomies [24]. However it is not possible to distinguish accurately these physiognomies using NDVI image.
International Journal of Advanced Remote Sensing and GIS
562
pasture and fire, we expect an expansion and development of shrub and tree layer towards a denser and forest physiognomies [8]. The increase of the frequency of fire in woody vegetation results in the establishment of opener physiognomies because of high woody mortality rates, which favours grass vegetation development [29, 30]. The pasture impact is more associated to the trampling damage over seedlings by the cattle, hindering growth of shrub and arboreal specimens.
International Journal of Advanced Remote Sensing and GIS
563
Figure 10: Fragment of Cerrado Vegetation at “Estação Ecológica de Itirapina” (ESECI) NDVI Image from 2011
International Journal of Advanced Remote Sensing and GIS
564
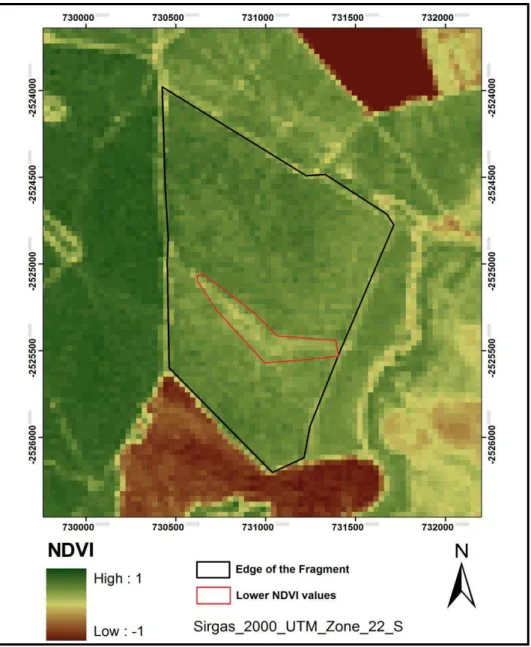
Figure 11: Fragment of Cerrado Vegetation at Cerrado Reserve “Palmeira da Serra” (CRPS) Map showing a
Region with Lower NDVI Values, Evidenced by the Red Polygon in 2011 Map
International Journal of Advanced Remote Sensing and GIS
565
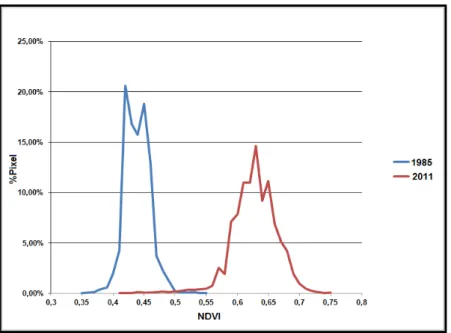
Figure 12: NDVI Values Histograms for the Fragment of Cerrado Vegetation at Botucatu in 1985 (Blue) e 2011
(Red).
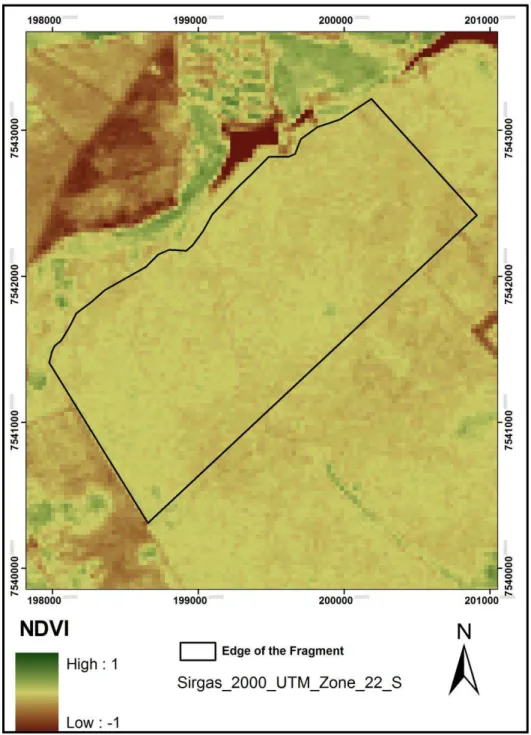
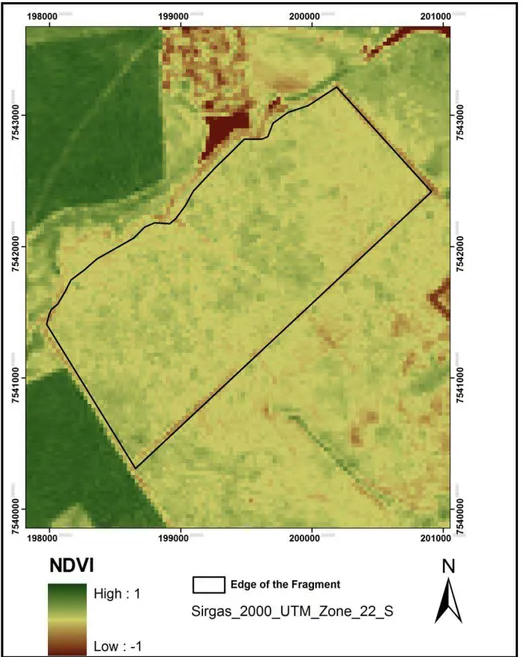
Although fire is a factor of savannah degradation it does not means that it will always influence NDVI with lower values, once the fire is also important for maintenance of more open physiognomies, leading to maintenance of NDVI in these less dense physiognomies [32]. In the case of Botucatu fragment, the fire is a negative impact factor, because of its forest structure, evidenced in both 1985 and 2011 NDVI images (Figure 12-13). Moreover, evidences of fire and gaps opened to install honeybee colonies for apiculture were observed inside the fragment (Figure 14), besides the historical selective logging in the region, which may have contributed to the lower NDVI values in 2011 than in 1985.
Figure 13: Fragment of Cerrado Vegetation at Botucatu. NDVI Images from 1985 (Left) and 2011 (Right). The
International Journal of Advanced Remote Sensing and GIS
566
Figure 14: Evidences of Fire and Apiculture for the Fragment of Cerrado Vegetation at Botucatu Municipality, São
Paulo State, Brazil
Furthermore, changes in the land use around the fragment can be observed between 1985 and 2011 (Figure 13), with the replacement of the original vegetation by agricultural crops and pasture, confirming that this fragment was under human pressures and several types of impact along the twenty six years period of study.
4. Conclusion
In both protected cerrado fragments studied, the vegetation showed the same tendency of other protected areas of cerrado in Brazil [8, 9]. This tendency means that physiognomies with lower biomass and more open vegetation is being replaced by denser physiognomies with higher biomass, which may continue if maintained protection condition, until reaching the cerradão physiognomy.
In the cerrado fragment more vulnerable to human impacts, in Botucatu, the NDVI was efficient to detect disturbances in vegetation around the fragment, such as changes in land use, evidencing the replacement of natural vegetation by crops. So the NDVI showed to be useful to verify anthropogenic impacts on vegetation, especially in the Brazilian savannah, which has suffered intensive pressures in the last decades [2, 4, 33].
Additionally, NDVI seems to be efficient to study and assess the dynamics of cerrado vegetation, allowing to identify structural changes throughout the period in which the area has been protected.
However, it is not possible to distinguish accurately among different physiognomies of cerrado, especially the denser ones just using NDVI images, without field check. It stills remains as a limitation of this method, but efforts should be directed aiming to improve its accuracy.
References
[1] Sano, E.E., Rosa, R., Brito, J.L.S., and Ferreira, L.G. Land Cover Mapping of the Tropical Savanna Region in Brazil. Environmental Monitoring and Assessment. 2010. 166; 113-124
[2] Mantovani, J.E., and Pereira, A., 1998: Estimativa da integridade da cobertura vegetal do cerrado/pantanal através de dados TM/Landsat. Extended Abstracts, Simpósio Brasileiro de Sensoriamento Remoto, 9, São José dos Campos/São Paulo.
International Journal of Advanced Remote Sensing and GIS
567
[4] Durigan, G., Franco, D.C., and Siqueira, M.F., 2004: O que é cerrado? Viabilidade de Conservação dos Remanescentes de Cerrado no Estado de São Paulo. Anablume, 28-32.
[5] Bitencourt, M.D., and Mendonça, R.R., 2004: Viabilidade de conservação dos remanescentes de cerrado no estadode São Paulo. 1st Ed.Anablume. 170.
[6] Mesquita Júnior, H.N., Malthus, T.J., Bitencourt, M.D., and Furley, P.A., 2004: Structural-Functional Model to Remote Sensing of Vegetation Physiognomies Seasonal Variation based on Life Form. Extended Abstracts, 4th International Workshop on Functional-Structural Plant Models, Montpellier, France.
[7] Bitencourt, M.D., Mesquita Júnior, H.N., Kuntschik, G., Rocha, H.R., and Furley, P. Cerrado Vegetation Study Using Optical and Radar Remote Sensing: Two Brazilian Case Studies. Canadian Journal of Remote Sensing. 2007. 33; 468-480.
[8] Pinheiro, E.S., and Durigan, G. Spatial and Temporal Dynamics (1962-2006) of Cerrado Vegetation Types in a Protected Area, Southeastern Brazil. Revista Brasileira de Botânca. 2009. 32; 441-454.
[9] Goodland, R., and Ferri, M.G., 1979: Ecologia do cerrado. EDUSP, 193.
[10] Ratter, J.A., Leitão Filho, H.F., Agent, G., Gibbs, P.E., Semir, J., Shepherd, G.J., and Tamashiro, J. Floristic Composition and Community Structure of a Southern Cerrado Area in Brazil. Notes of the Royal Botanic Garden Edinburgh. 1988. 45; 137-151.
[11] Ratter, J.A., 1992: Transitions between Cerrado and Forest Vegetation in Brazil. Nature and dynamics of Forest-Savanna boundaries. Chapman & Hall. 417-430.
[12] Durigan, G. and Ratter, J.A. Successional Changes in Cerradão and Cerrado/Forest Ecotonal Vegetation in Western São Paulo State, Brazil, 1962-2000. Edinburgh Journal of Botany. 2006. 63; 119-130.
[13] Pinheiro, E.S., Durigan, G., and Santos, J.R. Evaluation of QuickBird Data to Estimate Aboveground Cerrado Phytomass. Ambiência. 2008. 4; 69-83.
[14] Mesquita Júnior, H.N., 1998: Análise temporal com sensor orbital de unidades fisionômicas de cerrado na Gleba Pé-de-Gigante (Parque Estadual de Vassununga – SP). Dissertation, IB, USP, 112.
[15] Tucker, C.J. Red and Photographic Infrares Linear Combinations for Monitoring Vegetation. Remote Sensing of Environment. 1979.8; 127-150.
[16] Gamon, J.A., Field, C.B., Goulden, M.L., Griffin, K.L., Hartley, A.E., Joel, G., Peñuelas, J., and Valentini, R. Relationships between NDVI, Canopy Structure, and Photosynthesis in Three Californian Vegetation Types. Ecological Applications. 1995.5; 28-41.
[17] Mesquita Júnior, H.N. NDVI Measurements of Neotropical Savanna Physiognomies a Gradiente of: Biomass, Structure and Phenology Changes. International Archives of Photogrammetry and Remote Sensing. 2000. 33; 93-100.
International Journal of Advanced Remote Sensing and GIS
568
[19] Instituto Florestal, 2006: Plano de Manejo Integrado das Unidades de Itirapina.318.
[20] Oliveira, J.B., Camargo, M.N., Rossi, M., and Calderano Filho, B. Mapa pedológico do Estado de São Paulo: legenda expandida. Instituto Agronômico/EMBRAPA-Solos. 1999. 1; 64.
[21] Cabacinha, C.D., and Castro, S.S. Relationships between Floristic Diversity and Vegetation Indices, Forest Structure and Landscape Metrics of Fragments in Brazilian Cerrado. Forest Ecology and Management. 2009. 257; 2157-2165.
[22] Chavez, Jr., P.S. An Improved Dark-Object Subtraction Technique for Atmospheric Scattering Correction of Multispectral Data. Remote Sensing of Environment. 1988. 24; 459-479.
[23] Chander, G., Markham, B.L. and Helder, D.L. Summary of Current Radiometric Calibration Coefficients for Landsat MSS, TM, ETM +, an EO-1 ALI Sensors. Remote Sensing of Environment. 2009. 113; 893-903.
[24] Ishara, K.L., and Maimoni-Rodella, R.C.S. Richness and Similarity of the Cerrado Vascular Flora in the Central West Region of São Paulo state, Brazil. Check List. 2012. 8; 32-42.
[25] Archer, S., Scifres, C., and Basshan, C.R. Autogenic Succession in a Subtropical Savanna: Conversion of Grassland to Thorn Woodland. Ecological Monographs.1988. 58; 111-127.
[26] Carmel, Y., and Kadmon, R. Effects of Grazing and Topography on Long-Term Vegetation Changes in a Mediterranean Ecosystem in Israel. Plant Ecology. 1999. 145; 243-254.
[27] Bowman, D.M.J.S., Walsh, A., and Milne, D.J. Forest Expansion and Grassland Contraction Within a Eucalyptus Savanna Matrix between 1941 and 1994 at Litchfi eld National Park in the Australian Monsoon Tropics. Global Ecology & Biogeography. 2001. 10; 535-548.
[28] Archibold, O.W., 1995: Ecology of World Vegetation. 1st Ed. Chapman and Hall Press. 510.
[29] Miranda, H.S., Sato, M.N., Neto, W.N., and Aires, F.S., 2009: Fires in the Cerrado, the Brazilian Savanna. Tropical Fire Ecology. Springer Berlin Heidelberg. 427-450.
[30] Lehmann, C.E.R., Anderson, T.M., Sankaran, M., Higgins, S.I., Archibald, S., Hoffmann, W.A., Hanan, N.P., Williams, R.J., Fensham, R.J., Felfili, J., Hutley, L.B., Ratnam, J., Jose, J.S., Montes, R., Franklin, D., Russell-Smith, J., Ryan, C.M., Durigan, G., Hiernaux, P., Haidar, R., Bowman, D.M.J.S., and Bond, W.J. Savanna Vegetation-Fire-Climate Relationships Differ Among Continents. Science. 2014. 343; 548-552.
[31] Wessels, K.J., Prince, S.D., Frost, P.E., and Van Zyl, D. Assessing the Effects of Human-Induced Land Degradation in the Former Homelands of Northern South Africa with a 1 km AVHRR NDVI Time-Series. Remote Sensing of Environment. 2004. 91; 47-67.
[32] Jacquin, A., Sheeren, D., and Lacombe, J.P. Vegetation Cover Degradation Assessment in Madagascar Savanna based on Trend Analysis of MODIS NDVI Time Series. International Journal of Applied Earth Observation and Geoinformation. 2010. 12; 3-10.