SOBRE O COMPORTAMENTO DE AGENTES
RACIONAIS
PEDRO OLMO STANCIOLI VAZ DE MELO
SOBRE O COMPORTAMENTO DE AGENTES
RACIONAIS
EM REDES COMPLEXAS
Tese apresentada ao Programa de Pós--Graduação em Ciência da Computa´cão do Instituto de Ciências Exatas da Universidade Federal de Minas Gerais como requisito par-cial para a obtenção do grau de Doutor em Ciência da Computa´cão.
ORIENTADOR: ANTONIO
ALFREDO
FERREIRA
L
OUREIROCO-O
RIENTADOR: VIRGILIOAUGUSTO
FERNANDES
ALMEIDA,
CHRISTOS
FALOUTSOS
PEDRO OLMO STANCIOLI VAZ DE MELO
ON THE BEHAVIOR OF RATIONAL AGENTS
IN COMPLEX NETWORKS
Thesis presented to the Graduate Program in Computer Science of the Federal University of Minas Gerais in partial fulfillment of the re-quirements for the degree of Doctor in Com-puter Science.
ADVISOR: ANTONIO
ALFREDO
FERREIRA
LOUREIRO
CO-A
DVISOR: VIRGILIOAUGUSTO
FERNANDES
ALMEIDA, CHRISTOS
FALOUTSOS
Melo
,
Pedro Olmo Stancioli Vaz de.
M528s Sobre o comportamento oe agentes racionais
em reoes
complexas /
Pedro Olmo Stancioli Vaz de Melo
. — Belo
Horizonte, 2011.
xxix, 140 f. : il. ; 29cm
Tese (ooutoraoo) — Universioaoe Feoeral oe
Minas
Gerais – Departamento oe Ciência oa Computação.
Orientaoor:
Antônio Alfredo Ferreira Loureiro
.
Coorientaoor:
Virgilio Augusto Fernandes Almeida
.
1. Computação - Teses. 2. Reoes oe
computaoores –
Teses. 3.
Redes Complexas -
Teses. I. Orientaoor. II.
Orientaoor. III.Título.
UNIVERSIDADE FEDERAL DE MINAS GERAIS INSTITUTO DE CfENCIAS EXATAS
PROGRAMA DE POS-GRADUA<;AO EM CIENCIA DA COMPUTA<;AO
FOLHA DE APROV A<;AO
Sobre
zyxwvutsrqponmlkjihgfedcbaZYXWVUTSRQPONMLKJIHGFEDCBA0comportamento de agentes racionais em redes complexas
zyxwvutsrqponmlkjihgfedcbaZYXWVUTSRQPONMLKJIHGFEDCBAPEDRO OLMO STANCIOLI VAZ DE MELO
Tese defendida e aprovada pela banca examinadora constituida pelos Senhores:
~ ~
PRO;pq;;;~~~ ALFREDOFERREIRALOUREIRO- Orientador Departamento de Ciencia da Computayffo - UFMG
PROF.~,O fuG~T~N~MElDA - Co-orientador
Depart nto de Ciencia da Computayffo - UFMG
PROFA.JUSSARAMARQUESDEALMEIDA Departamento de Ciencia da Computayffo - UFMG
~~~~~ALVES
Departamento de Cienc· a da Computayffo - UFMG
DR. CARLOSALBERTOKAMIENSKI
Centro de Matematica , Computayffo e Cogniyffo - UF ABC
I dedicate this thesis to my mom and dad.
Acknowledgments
First, I thank my family and friends for all the support. Special thanks to my mom and dad, who were there for me all the time I needed. This won’t be forgotten. Then, I thank every-body who contributed and helped me in writing this thesis. My advisor Antonio Loureiro, who was always with me, giving valuable advices and keeping my head together after the bad waves. My co-advisor Virgilio Almeida, who lead my work and my life to a completely different and better direction. My advisor at CMU, Christos Faloutsos, for all the unex-pected time spent in my work and for being so bright, committed and humble, an example that I will take for my life. Raquel Mini, who believed in me and helped me to join the doc-torate program. My colleagues at UFMG, CMU and INRIA for all the ideas and for making this journey much more fun. Special thanks to Fernando, Guidoni, Fernanda, Felipe, Heitor, Marcelo, Leandro, Dudu, Leman and Robson. I also thank all the professors at UFMG who thought me so much inside and outside the classroom.
“Why is it that when one man builds a wall, the next man immediately needs to know what’s
on the other side?” (George R.R. Martin)
Resumo
O avanço constante dos sistemas de informação permite, a uma taxa de crescente, que mais dados sejam gerados e armazenados. A partir das mais rotineiras situações, tais como con-versas telefônicas, a atuação de sistemas tecnológicos de alta complexidade, tais como redes de sensores sem fio (RSSF) para detectar eventos climáticos, dados são gerados e armazena-dos registrando cada ação e decisão tomada pelos agentes desses sistemas. É fascinante que, por trás desses registros, vemos o reflexo do ambiente em si, já que por trás de cada registro, há uma decisão tomada por alguma entidade. Portanto, o conhecimento de como processar esse valioso banco de dados em evolução pode levar, conseqüentemente, para uma melhor compreensão dos interesses e da dinâmica de cada entidade em um determinado ambiente ou na sociedade.
Nesta tese, nos concentramos em sistemas que são compostos de entidades (indiví-duos, organizações e sistemas computacionais), capazes de interagir entre si de uma maneira racional, refletindo seus interesses e dinâmica de atividade. Nós chamamos esses sistemas deRedes Complexas Baseadas em Decisão (RCBD), estes indivíduos e/ou organizações, nós ou agentes, e as interações entre nós, arestas. A principal característica de uma RCBD é que ela evolui de acordo com as motivações pessoais dos seus nós. Portanto, o objetivo principal desta tese é analisar o comportamento dos agentes de uma RCBD. Pretendemos observar cenários reais e hipotéticos, onde as decisões têm um papel importante na evolução da rede. Quando compreendemos plenamente as motivações por trás das ações dos agentes, podere-mos modelar, prever e controlar o seu comportamento. Dividipodere-mos o objetivos principal desta tese em três objetivos específicos: (i) Modelagem, em que o nosso objetivo é representar
fielmente o comportamento dos agentes em uma RCBD; (ii)Predição, em que o nosso
ob-jetivo é prever como evoluirá o sistema, e (iii)Controle, em que o nosso objetivo é criar
mecanismos para fazer os agentes agirem de acordo com um objetivo determinado.
Em primeiro lugar, analisamos as redes de comunicação formada a partir de registros telefonicos de um operadora móvel privada de uma grande cidade. Propomos modelos para o comportamento individual dos usuários dessa rede e, a partir disso, propomos aplicações para redução de dados, detecção de anomalias e monitoramento de rede. Então, analisamos
redes competitivas formadas a partir de ligas esportivas, como a liga profissional de basquete americana (NBA) e a liga profissional de baseball(MLB). Propomos modelos de previsão que podem ser usados para identificar as equipes mais prováveis para ganhar a temporada seguinte. Finalmente, investigamos a tomada de decisões em redes de computadores, em um cenário onde um grupo de RSSFs são implantados na mesma região e elas podem interagir entre elas para solicitar ou compartilhar recursos computacionais. Nós modelamos o prob-lema da cooperação entre duas ou mais RSSFs diferentes pelos conceitos da teoria dos jogos e com isso nós apresentamos, como uma aplicação de controle, um protocolo para permitir a cooperação entre eles.
Palavras-chave: Redes Sociais, Redes Complexas, Tomada de Decisão.
Abstract
The constant advancement of information systems allows, at a growing rate, more data to be generated and stored. From routine situations, such as phone conversations, to the actu-ation of highly complex technological systems, such as Wireless Sensor Networks (WSNs) to detect weather events, data are generated and stored registering every action and decision made by the agents of these systems. It is fascinating that, behind these records, we see the reflection of the environment itself, since behind every record, there is a decision made by some entity. Therefore, the knowledge of how to process this valuable and very large evolv-ing database can lead, consequently, to a better understandevolv-ing of the interests and dynamics of each entity in a determined environment or in the society.
In this thesis, we focus on systems that are made up of entities (individuals, organi-zations and computational systems) capable of interacting among themselves in a rational way, reflecting their interests and activity dynamics. We call these systemsDecision-based Complex Networks (DBCN), these individuals and/or organizations, nodes or agents, and the interactions between nodes, edges. The main characteristic of a DBCN is that it evolves according to the personal motivations of its nodes. Therefore, the main objective of this the-sis is to analyze the behavior of agents of DBCN. We plan to observe real and hypothetical scenarios where decisions play an important role in the evolution of the network. When we fully understand the motivations behind the actions of the agents, we may be able to model, predict and control their behavior. We divide the main objetive of this thesis in three spe-cific goals: (i)Modeling, where we aim to accurately represent the behavior of the agents
in a DBCN; (ii)Predicting, where we aim to predict how the system will evolve, and (iii) Controlling, where we aim to be able to make the agents to act according to a determined
goal.
First, we show a compact analysis of the three aspects of DBCNs we tackle in this thesis, i.e., modeling, predicting and controlling, in three real-world datasets describing user mobility activity. Then, we focus solely on modeling communication networks. We pro-posed models for the individual behavior of the users of this network and, from this, we proposed applications for data summarization, anomaly detection and network monitoring.
Then, we focus on predicting in competitive networks formed from sports leagues such as the North American National Basketball Association (NBA) and the Major League Baseball (MLB). We proposed a prediction model that can be used to identify likely teams to win and to fail in a following season. Finally, we focus on controlling, investigating decision making in computer networks, in a scenario where a group of WSNs are deployed in the same re-gion and they may interact with themselves to request or share computational resources. We modeled the problem of cooperation among two or more different WSNs by the concepts of game theory and from it we present, as a control application, a protocol to allow cooperation among them.
Palavras-chave: Social Networks, Complex Networks, Decision Making.
Resumo Estendido
Motivação
O avanço constante dos sistemas de informação permite, a uma taxa de crescente, que mais dados sejam gerados e armazenados. A Internet, por exemplo, consiste em milhões de dis-positivos computacionais sendo que cada um deles gera, armazena e transmite uma quan-tidade incontável de dados. Claramente, a Internet está indo na direção do paradigma de computação ubíqua, que, tal como previsto no artigo clássico de Mark Weiser, permite que qualquer pessoa, em qualquer lugar, a qualquer momento, interaja com o ambiente. Assim, a partir das mais rotineiras situações, tais como conversas telefônicas, a atuação de sistemas tecnológicos de alta complexidade, tais como as redes de sensores sem fio (RSSF) para de-tectar eventos climáticos, dados são gerados e armazenados registrando cada ação e decisão tomada pelos agentes desses sistemas.
Atualmente, existem estudos sobre os dados de chamadas telefônicas, redes sociais on-line, ferrovias, sites de Internet, redes de citação, filmes e atores, ligas desportivas e muitos outros. A partir desses estudos agora sabemos como as pessoas vinculam sites em suas pági-nas e como comunidades de pessoas em uma rede social online evoluem ao longo do tempo. É fascinante que, por trás desses registros, vemos o reflexo do ambiente em si, já que por trás de cada registro, há uma decisão tomada por alguma entidade. Portanto, o conhecimento de como processar esse valioso banco de dados em evolução pode levar, consequentemente, para uma melhor compreensão dos interesses e da dinâmica de cada entidade em um deter-minado ambiente ou na sociedade.
Nesta tese, nos concentramos em sistemas que são compostos de entidades capazes de interagir entre si de uma forma autônoma, refletindo os seus interesses e dinâmicas de atividade. Nós chamamos esses sistemasRedes Complexas Baseadas em Decisão(RCBD) ou Decision-based Complex Networks (DBCN) e suas entidades de nós ou agentes. Uma RCBD é um tipo especial de rede complexa que contém nós capazes de tomar decisões autônomas, que são guiados principalmente por suas motivações pessoais. Por exemplo, as redes sociais formadas a partir de laços de amizade ou colaborações de trabalho são RCBDs,
uma vez que os nós dessas redes têm poder de decisão para criar arestas. No entanto, redes semânticas formado a partir de textos e redes de terremotos não são RCBDs, uma vez que a criação de arestas é guiada, nestes casos, por um processo central.
Assim como as redes complexas, RCBDs têm um grande número de vértices e arestas que seguem um ou vários padrões, tais como comunidades de nós ou vértices altamente conectados, chamados dehubs. Enquanto em uma rede simples com, no máximo, centenas de nós o olho humano é um instrumento de poder considerável, em uma complexa rede, esta abordagem é inútil. Assim, para estudar, analisar e caracterizar redes complexas, métodos estatísticos e algoritmos eficientes são necessários.
Objetivos
Esta tese tem como objetivo analisar o comportamento dos agentes de RCBDs. Observamos cenários reais e hipotéticos em que as decisões ambientais e sociais desempenham um papel importante na evolução da rede e sobre a forma como os agentes interagem. Quando somos capazes de entender completamente as motivações por trás das ações dos agentes, é possível desenvolver técnicas para modelar, prever e controlar o comportamento de diversas e grandes RCBDs e das suas entidades. Mas especificamente, os principais objetivos desta tese são:
1. Modelagem. Nosso objetivo é criar modelos que podem representar com precisão o
comportamento dos agentes de uma RCBD, levando a um melhor entendimento do sistema;
2. Predição. A partir da compreensão das razões por trás das decisões dos agentes de
uma RCBD, queremos entender como o sistema irá evoluir;
3. Controle.Uma vez que sabemos como o sistema se comportará, proporemos
mecanis-mos de controle para fazer os agentes agirem de acordo com um objetivo determinado.
A partir das decisões locais feitas por agentes de RCBDs, investigamos a evolução global do sistema a fim de propor uma grande variedade de aplicações. Nesta tese, estudamos tipos muito diferentes de RCBDs e propomos diferentes aplicações para todas elas a partir do conhecimento que adquirimos do comportamento dos agentes. Todas as redes analisadas têm em comum o fato de que os agentes são capazes de: (i) tomar decisões autônomas, e (ii) interagir com outros agentes. Além disso, é importante ressaltar que a evolução da rede depende exclusivamente de como estas decisões são tomadas.
Contribuições
Primeiro, apresentamos uma análise compacta dos três aspectos de RCBDs que abordamos nesta tese (modelagem, predição e controle) usando três conjuntos de dados de mobilidade do mundo real (Capítulo 3). Em seguida, nos concentramos na modelagem de redes de comu-nicação (Capítulo 4). Propomos modelos para o comportamento individual dos usuários e, a partir disso, propomos aplicações de redução de dados, detecção de anomalias e monitora-mento de rede. Em seguida, nos concentramos no problema de predição em redes competi-tivas, como a liga profissional de basquete (NBA) e debaseball(MLB) dos Estados Unidos da América (Capítulo 5). Propomos um modelo de predição para identificar o desempenho anual de equipes em ligas esportivas. Finalmente, nos concentramos no aspecto de controle em RCBDs, investigando a tomada de decisão em um cenário onde redes de sensores sem fio são depositadas na mesma região e interagem entre si para solicitar ou compartilhar re-cursos computacionais (capítulo 6). Modelamos este problema a partir da teoria dos jogos e apresentamos uma aplicação de controle que é um protocolo para permitir a cooperação entre essas redes.
Capítudo 3 – Redes de Mobilidade
A principal característica de RCBDs é que as interações entre as suas entidades são, geral-mente, consequência de decisões semi-racionais. Escreve-se “normalmente” e decisões “semi-racionais” porque qualquer sistema está sujeito a eventos aleatórios e escolhas irra-cionais. No entanto, uma vez que a maioria das interações ainda decorrem de decisões conscientes feitas por suas entidades, a evolução de RCBDs é significativamente diferente da evolução de redes aleatórias como, por exemplo, redes de Erdös and Rényi. Assim, en-quanto em uma RCBD as arestas são geradas a partir de decisões semi-racionais, que tendem a ser regulares e a se repetir, em uma rede aleatória as arestas são geradas independentemente dos atributos dos nós, ou seja, a probabilidade de dois nós se conectarem é constante.
Considere, por exemplo, uma RCBD constituída por pessoas e suas rotinas de mobi-lidade. Uma interação entre duas pessoas ocorre se elas se encontram. Se Silva e Moreira trabalham no mesmo escritório e suas horas de trabalho são de 8:00 às 18:00, pode-se prever facilmente que uma interação entre Silva e Moreira irá ocorrer em torno de 8:00 durante os dias da semana. Isso é baseado no fato de que acreditamos fortemente que tanto Silva quanto Moreira decidirão ir ao trabalho todos os dias pontualmente, já que este é, provavelmente, a decisão racional para se tomar. Entretanto, a maioria dos cenários está sujeita a eventos aleatórios que podem desviar o comportamento esperado dos agentes. Silva pode, por exem-plo, viajar à negócios por alguns dias e encontrar pessoas totalmente diferentes. Ou então,
Moreira poderia ficar preso no trânsito e se atrasar, se encontrando com Silva somente às 10:00. O fato é que, apesar de decisões racionais serem regulares, as decisões aleatórias podem muitas vezes ocorrer também e se misturar em grande quantidade com as demais.
Assim, propomos o Random rElationship ClASsifier sTrategy (RECAST), um algo-ritmo classificador de relações sociais, capaz de detectar, entre outros, eventos aleatórios em RCBDs. Eventos aleatórios mascaram os padrões de comportamento comuns por intro-duzirem uma quantidade significativa de ruído, tornando assim o processo de descoberta de conhecimento em RCBDs uma tarefa ainda mais complexa. A capacidade de identificar com precisão os eventos aleatórios em grandes conjuntos de dados é essencial para a análise do comportamento social, bem como para aplicações que dependem de uma descrição precisa de rotinas humanas, tais como sistemas de recomendação, estratégias de roteamentoad-hoc e esquemas de divulgação de mensagens focalizando eficiência de cobertura com um número limitado de mensagens redundantes.
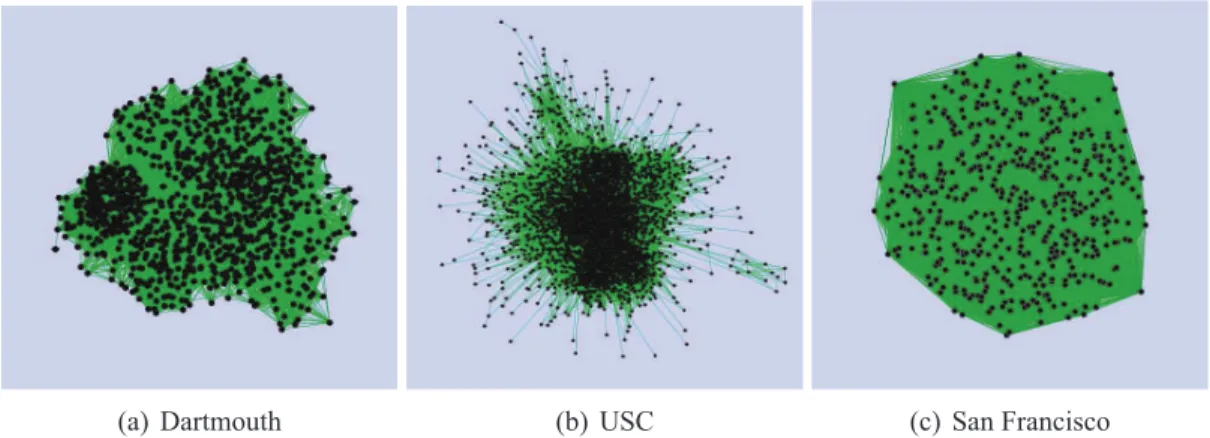
O RECAST nos permite observar muitas diferenças na evolução de RCBDs quando aplicada a três conjuntos de dados do mundo real descrevendo atividades de mobilidade. Foi verificado que essas diferenças são devido às características intrínsecas de cada cenário. Por exemplo, mostramos que o conjunto de dados que descreve o movimento de motoristas de táxi em San Francisco (EUA) tem, na sua maioria, propriedades não-sociais, o que torna a sua representação gráfica semelhante a uma rede aleatória. O mesmo não é verdade para pessoas se movendo em um campus, pois elas se encontram regularmente com um mesmo conjunto de pessoas, tais como seus colegas, professores etc. No entanto, verificamos que diferentes campi possuem dinâmicas de interação e de mobilidade diferentes.
Em resumo, neste capítulo modelamos conjuntos de dados de mobilidade em RCBDs de encontros e, a partir disso, propomos o RECAST. A clara classificação das relações dos usuários fornecida pelo RECAST alavanca imediatamente análises subsequentes. Por exem-plo, mostramos que encontros entre duas pessoas que compartilham de um relacionamento social são mais fáceis de prever. Além disso, mostramos como é possível projetar uma apli-cação de controle para disseminar dados na rede de forma eficiente usando apenas duas das quatro classes que o RECAST identifica.
Capítulo 4 – Redes de Comunicação
Neste capítulo mostramos que o problema da modelagem de agentes em redes de comuni-cação é extremamente desafiador. Padrões de comunicomuni-cação humanos são propensos a mudar à medida que os aspectos tecnológicos e culturais da sociedade mudam. Por exemplo, a duração típica de uma chamada telefônica envolvendo dois telefones fixos é provavelmente diferente daquela que envolve dois telefones móveis. Por isso, usamos este cenário
ador no estudo da modelagem em RCBDs.
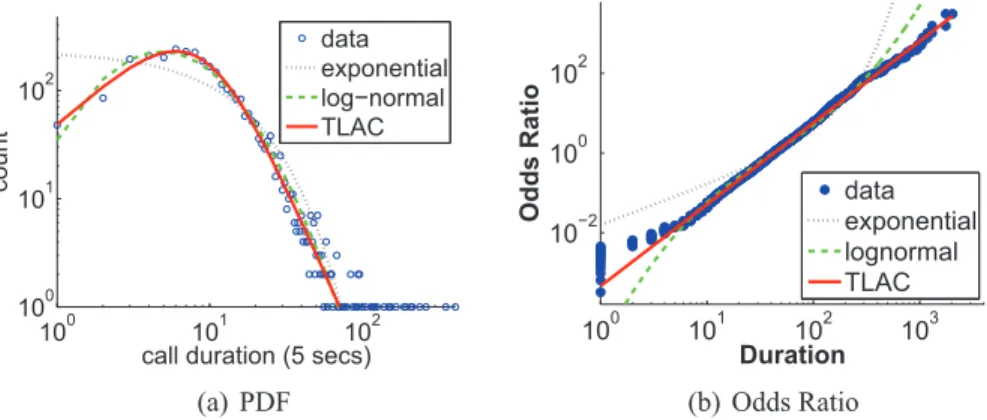
Analisamos a taxa na qual dois agentes sociais comunicam e a duração da sua co-municação. Primeiramente, analisamos o tamanho dos fluxos de comunicação (duração de chamadas de telefone), e mostramos como um bom esforço de modelagem pode conduzir a uma ampla variedade de aplicações. Em resumo, nós abordamos o seguinte problema: dada uma grande quantidade de registros telefônicos, qual é a melhor maneira de representar o comportamento da duração das chamadas de um usuário? Analisamos a duração de cente-nas de milhões de chamadas e propomos o modeloTruncated Lazy Contractor(TLAC) para descrever o tempo das durações telefônicas de um único usuário. Assim, o TLAC modela a distribuição da duração de chamadas (DDC) de um usuário e é parcimonioso, tendo apenas dois parâmetros, ocoeficiente de eficiênciaρe ocoeficiente de fraquezaβ. Nós mostramos que o modelo TLAC foi a melhor alternativa para modelar a DDC de usuários de nosso con-junto de dados, principalmente porque produz uma distribuição que tem cauda e cabeça mais pesadas que as da distribuição log-normal, que é a distribuição mais comumente usada para modelar DDC.
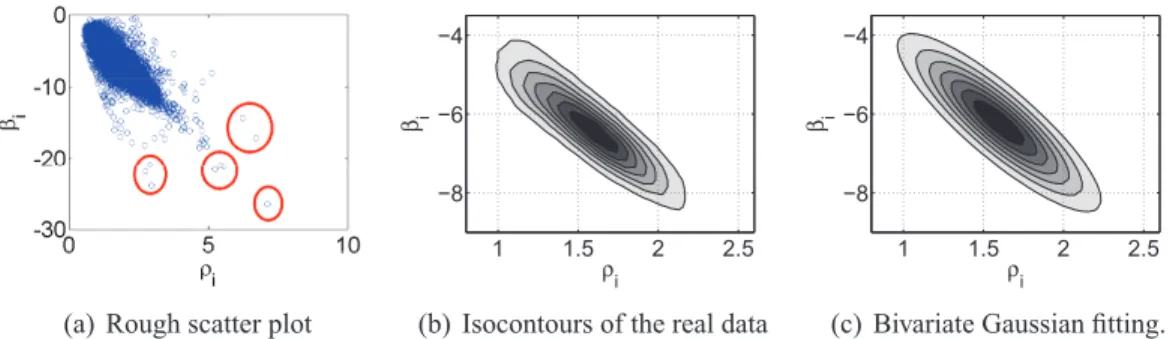
Sugerimos também a utilização dos parâmetros do TLAC como a melhor e mais com-pacta forma de representar o comportamento da duração de chamadas de um usuário. Dessa maneira, propomos aMetaDistpara modelar a população de usuários com um determinado comportamento de duração de chamadas. AMetaDisté a meta-distribuição dos parâmetros
ρie βi da DCC de cada usuárioie, quando seus contornos são visualizados, a sua forma é
surpreendentemente similar a uma distribuição gaussiana bivariada. Essa regularidade fasci-nante, observada em uma base de dados significativamente ruidosa, faz da MetaDista dis-tribuição potencial a ser explorada no sentido de compreender melhor o comportamento da chamada de usuários móveis.
Na análise dos intervalos de tempo entre comunicações, foram considerados vários cenários. A literatura atual tem resultados aparentemente contraditórios para a distribuição marginal dos intervalos de tempo entre eventos. Alguns estudos afirmam bons ajustes com as leis de potência, outros com “processos de Poisson não homogêneos”. Fizemos uma modelagem elaborada que utiliza o conhecimento destes modelos, juntamente com novas observações em dados reais, para propor oSelf-feeding Process (SFP), que representa muito bem as propriedades das marginais de vários conjuntos de dados de comunicação de grande porte, diversificados e do mundo real, tais como chamadas telefônicas, SMS, e-mails, e fóruns online. Mais importante, ele unifica as teorias existentes sobre a dinâmica da comuni-cação humana, gerando distribuições marginais com cauda pesada, caracterizada por rajadas de eventos e longos períodos de inatividade, além de possuir comportamento Poissoniano local. Além disso, o SFP é baseado em uma nova descoberta relatada nesta tese, de que há uma correlação positiva significativa entre intervalos de tempos consecutivos. Finalmente,
é importante ressaltar que o SFP é extremamente parcimonioso, usando no máximo dois parâmetros.
Capítulo 5 – Redes Competitivas
Em redes competitivas, os agentes do sistema competem entre si por uma recompensa ou recursos limitados. Como possíveis exemplos desse tipo de rede podemos citar redes de tra-balhadores à procura de postos de trabalho, como visto noLinkedIn, e em ligas profissionais de esportes. Nesses casos, as organizações, empresas ou equipes querem contratar os mel-hores jogadores e técnicos, ao menor custo possível. Por sua vez, os jogadores e técnicos querem receber o maior salário possível e ainda trabalhar em uma boa equipe. Além disso, tanto as organizações quanto os jogadores e técnicos querem que as organizações cresçam, ou seja, querem expandir no mercado e conquistar títulos em suas ligas. Este cenário ap-resenta vários conflitos de interesses que podem revelar observações interessantes sobre os agentes sociais deste tipo de rede.
Nesta tese, analisamos a rede formada a partir dos times e jogadores de ligas esportivas. Começamos com a NBA em seus 63 primeiros anos de existência. Na etapa de modelagem, vemos a NBA como uma rede complexa em evolução. Em seguida, na fase de predição, propomos métricas que estão correlacionados com o comportamento dos times da NBA, levando em conta apenas a relação social e de trabalho entre os jogadores, treinadores e equipes. Então, com base nessas métricas, propomos modelos para prever o quão bem uma equipe irá jogar na temporada seguinte. Avaliamos também os modelos de predição sobre o conjunto de dados da Major League Baseball. Tanto o NetForY quanto o NetFor , que são os modelos propostos nesta tese, tem resultados surpreendentemente bem em ambos os conjuntos de dados.
Capítulo 6 – Redes de Sensores Sem Fio
Finalmente, analisamos RCBDs formada apenas por dispositivos computacionais. Neste tipo de rede, os agentes podem ser modelados como agentes sociais capazes de tomar decisões. O aspecto principal deste tipo de RCBD é que em redes de computadores agentes não tomam decisões irracionais, pois só podem agir de acordo com a forma que foram programados para agir. Isto significa que as decisões realizadas pelos agentes visam sempre maximizar a sua utilidade e nada mais, agindo de uma maneira puramente egoísta, e decisões irracionais causadas por instabilidades emocionais ou causas semelhantes não existem.
Nós consideramos um cenário em que diferentes redes de sensores sem fio (RSSF) com diferentes proprietários são depositadas no mesmo lugar. Neste cenário, existe a
sibilidade de que um sensor de uma rede coopere com um sensor de outra rede. Quando duas RSSFs compartilham os seus nós sensores na execução de alguma atividade de forma inteligente, as duas redes podem melhorar as suas operabilidades, executando as suas ativi-dades de forma mais eficiente. Apesar de ser óbvia e simples, esta idéia traz consigo muitas implicações que dificultam a cooperação entre as redes. Considerando que uma RSSF tem um caráter racional e egoísta, ela só irá cooperar com outra RSSF se esta oferecer serviços que justificam a cooperação.
Neste capítulo específico, mais uma vez abordamos os três aspectos de RCBDs que analisamos nesta tese: predição, modelagem e controle. Primeiro, temos o problema de modelagem da cooperação entre os diferentes RSSFs usando a teoria dos jogos, que é uma técnica interessante para modelar situações de conflito entre dois ou mais agentes racionais e egoístas. Em redes de computadores, decisões e métricas de utilidade (por exemplo, taxa de transferência e latência) são computacionalmente bem definidas, fazendo com que a teoria dos jogos seja uma ferramenta poderosa para modelar e principalmente prever o comporta-mento dos agentes. A partir deste conhecicomporta-mento, pode-se projetar mecanismos de incentivo para controlar os seus comportamentos.
No problema da cooperação entre diferentes RSSFs depositadas no mesmo local, ini-cialmente nenhum nó sensor está cooperando com nós sensores de outras redes, só encamin-hando mensagens pertencentes à sua própria rede. Uma redeNi, que é um jogador racional
e egoísta, deve, então, alterar a sua estratégia e fazer com que um ou mais dos seus nós sen-sores encaminhem pacotes de outras redes se, e somente se, isso for aumentar o seupayoff
Πi, que é um valor que representa o ganho que Ni terá com ou sem a cooperação. No
en-tanto, se todas as redes mantiverem as suas estratégias e Ni alterar a sua estratégia inicial
e fazer algum dos seus nós sensores cooperar e encaminhar mensagens de outra redes, o gasto de energia deNi aumentará, fazendo que opayoff Πi diminua. Assim, inicialmente,
o jogo está em Equilíbrio de Nash, pois não é possível que uma rede aumente o seupayoff alterando a sua estratégia se todas as outras redes mantiverem as suas. Esse comportamento previsto para as redes só pode ser alterado caso haja intervenção externa como, por exemplo, a injeção de um protocolo distribuído de cooperação nos nós sensores.
Assim, como contribuição final deste capítulo, propomos protocolo Virtual Cooper-ation Bond (VCB), que permite a cooperação entre diferentes RSSFs depositadas em um mesmo local. O protocolo proposto é totalmente distribuído, ou seja, não depende de nen-hum controle central, estabelecendo a cooperação a partir de informações locais dos nós sen-sores. Além disso, o VCB garante que a cooperação só seja estabelecida quando for trazer benefícios para ambas as redes. Resultados de simulação mostram que o VCB economiza a energia das redes e prolonga o seus tempos de vida.
List of Figures
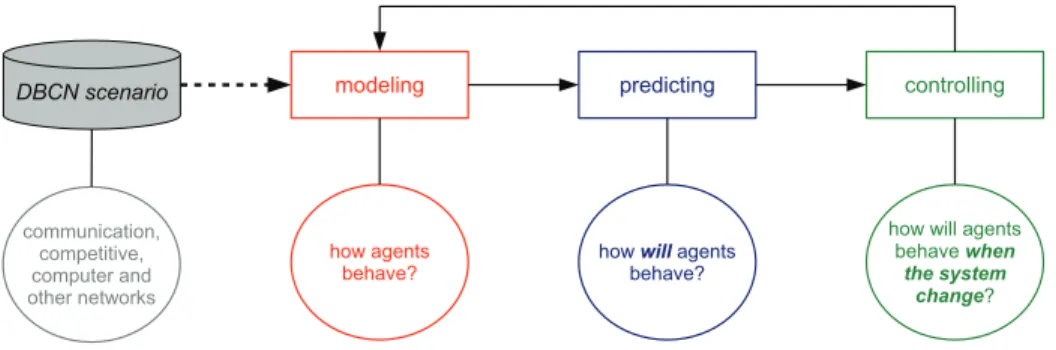
1.1 The summary of this thesis. From DBCNs scenarios, first we model the behavior of the agents and, from this, we are able to predict their behavior. Once we know how the agents will behave, we are able to design control mechanisms to make the agents to act according to a determined goal and, therefore, change the system. New modeling and predicting efforts should be made in the new system to better control its behavior. . . 3
2.1 Payoff matrix of “The Battle of the Sexes” game. . . 14
3.1 Snapshots of the networksGtafter two weeks. . . 19
3.2 The densification of the temporal graphGt(Vt, Et)per each dayt. (a) The
num-ber of new edges added toGt(Vt, Et)per each dayt. (b) The percentage of the
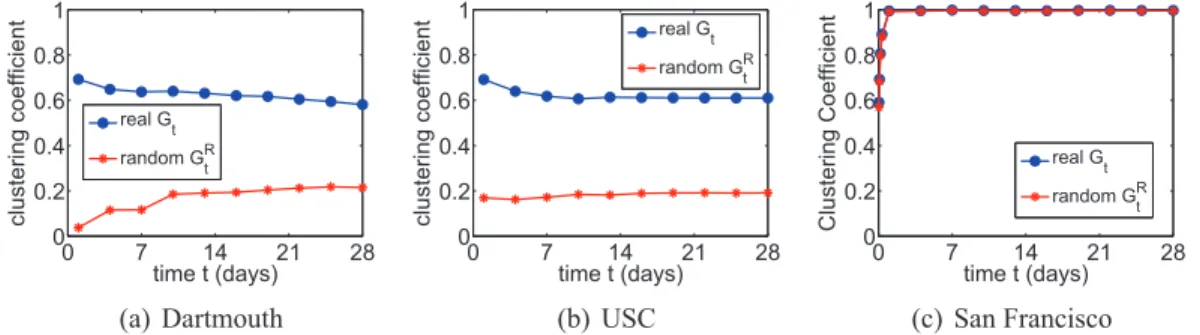
graph that is covered by the new edges. . . 20 3.3 Evolution of the clustering coefficient of the three analyzed networks Gt and
their random correspondentsGR
t . . . 21
3.4 The complementary cumulative distribution function of the edge persistence (a,b,c) and topological overlap (d,e,f) for the three analyzed networks Gt and
their random correspondentsGR
t after four weeks,t= 28days. . . 23
3.5 The number of edges ((a) and (b)) and percentage of encounters ((c) and (d)) of a given class that appears in the first four weeks of data for a given value ofprnd. 26
3.6 [Best viewed in color] Snapshots of the Dartmouth and USC networks after two weeks of interactions, considering only the social edges and only the random edges. Friendshipedges are painted in blue, Bridgesin red, Acquaintanceship in gray andRandomin orange. . . 28 3.7 Evolution of the clustering coefficient of the Dartmouth and USC networksGt
when onlyRandomedges are present compared to their random correspondents
GR
t . . . 29
3.8 The distribution of encounters ((a) and (b)) and appearance ((c) and (d)) of each class in the one weektest setas a function ofprnd. . . 29
3.9 The contamination of the network when edges of a selected class are removed. The vertical lines represent a95%confidence interval. . . 32 3.10 The contamination of the networks using only edges of a selected class. The
vertical lines represent a95%confidence interval. . . 32
4.1 Comparison among the shapes of the log-normal, exponential and TLAC distri-butions. . . 42 4.2 Comparison of models for the distribution of the phone calls duration of a high
talkative user, with 3091 calls. TLAC in red, log-normal in green and exponen-tial in black. Visually, for the PDF both the TLAC and the log-normal distribu-tion provide good fits to the CDD but, for the OR, the TLAC clearly provide the best fit. . . 44 4.3 Percentage of users’ CDDs who were correctly fit vs. the user’s number of calls
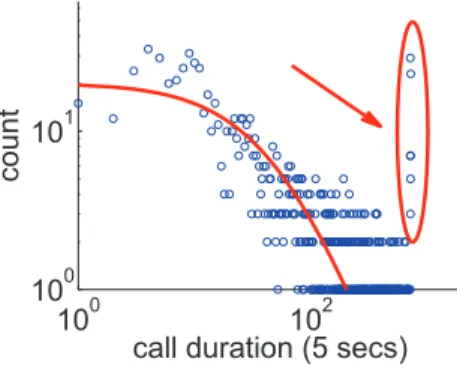
c. The TLAC distribution is the one that provided better fittings for the whole population of customers with c > 30. It correctly fit more than 96% of the users, only significantly failing to fit users with c > 103, probably spammers, telemarketers or other non-normal behavior user. . . 45 4.4 Odds ratio of three talkative customers who were not correctly fit by the TLAC
model. . . 46 4.5 Scatter plot of the parameters ρi and βi of the CDD of each userifor the first
month of our dataset. In (a) we can not see any particular pattern, but we can spot outliers. By plotting the isocontours (b), we can observe how well a bivariate Gaussian (c) fits the real distribution of theρiandβiof the CDDs (’meta-fitting’) 47
4.6 Evolution of the MetaDist over the four months of our dataset. Note that the collective behavior of the customers is practically stable over time. . . 48 4.7 The TLAC lines of several customers plotted together. (a) We can observe that,
given the negative correlation of the parametersρi andβi, that the lines tend to
cross in one point. (b) We plot the isocontours of the lines together and approx-imately 50% of the customers have TLAC lines that pass on the high density point (duration=17s, OR=0.15). . . 49 4.8 Outlier whose CDD can not be modeled by the TLAC distribution. . . 50 4.9 Cumulative distributions for ρandβ. We can observe that ρis lower bounded
by0.5andβ is lower bounded by1. These values are coherent with the global intuition on human calling behavior. . . 51
4.10 Isocontours of the users’ CDD efficiency coefficient ρ and their summarized attributes. . . 52
4.11 Isocontours of the users’ CDD efficiency coefficient β and their summarized attributes. . . 53
4.12 The inter-event time distribution of the most talkative user of our four datasets, with 44785 SMS messages sent and received. We observe that both the power law fitting (PL fitting) with exponent 2and the exponential fitting, generated by a PP, deviate from the real data. We also observe that the OR is very well fitted by a straight line with slope≈1. . . 55
4.13 IEDs of anonymous users of the PHONE dataset. Observe that for these three users, the Odds Ratio is well fitted by a power law. The MLE fitting gives the same values for the slopeρ. . . 56
4.14 The goodness of fit of our proposed model. We show the Probability Density Function (PDF) of theR2s measured for every user in the four datasets. Observe that theR2value for the great majority of the users is close to1. . . . 57
4.15 The PDF of the slopes ρi measured for every userui of our four datasets.
Ob-serve that the typicalρi for the users of the phone, Enron and Digg datasets is
approximately1, while for the users of the SMS dataset is approximately2. . . 58
4.16 The PDF of the medians µi measured for every user of our four datasets.
Ob-serve that the typicalµi for the users of the phone, SMS and Enron datasets is
approximately1hour, while for the users of the Digg dataset is approximately2 minutes. . . 58
4.17 IEDs of anonymous users of the SMS dataset. Observe that for these three users, the Odds Ratio is well fitted by a power law. The MLE fitting gives the same values for the slopeρ. . . 59
4.18 IEDs of three users of the Enron dataset. Observe that for these three users, the Odds Ratio is well fitted by a power law. The MLE fitting gives the same values for the slopeρ. . . 60
4.19 IEDs of three stories of the DIGG dataset. Observe that for these three stories, the Odds Ratio is well fitted by a power law. The MLE fitting gives the same values for the slopeρ. . . 61
4.20 I.I.D. fallacy: dependence between ∆t and ∆t−1. (a) The median of the inter-event times ∆ts for their respective preceding ∆t−1s for one talkative user of each of the four datasets and for a synthetic data generated by the SFP, all rep-resented in logarithmic intervals. (b) The sample autocorrelation for the same individual of Figure 4.12 and for synthetic data generated by the SFP, PP and LLG-iid, with the same number of phone calls and median. Observe that both the real data and the SFP indicates∆tand∆t−1are positive correlated. . . 62 4.21 The empirical probability of an individual’s inter-event times to be
autocorre-lated given his/her number of events. Note that as the number of events grows, the probability of having an autocorrelated series also grows. . . 63 4.22 Comparison of the event times generated by the SFP0 model with the
inter-event times of the user of Figure 4.12. Observe that both the PDF (a) and the OR (b) are almost identical. . . 65 4.23 Unification Power of SFP: non-Poisson/bursty in the long term (first two
columns), but Poisson in the short term (last two columns). First row: Traffic of the user of Figure 4.12 - event-count per unit time ((a), (c)) and respective cumulative event-count ( (b), (d)). Second row: synthetic traffic, by the SFP model (with matchingµ,ρand event-count). Observe that (1) both time series are visually similar; (2) both are bursty in the long run (spikes; inactivity) (3) both are Poisson-like in the short term (last two columns) . . . 67
5.1 Average accuracy of the network-based models and of the Yesterday model, that is currently the state of the art. The accuracy is measured using the Spearman’s rank correlation coefficient ρ. While the NetFor has similar performance, the NetForY consistently beats the“Yesterday”, with up to14%improvement. . . 72 5.2 The majority of players marginally contributes to their teams in terms of
box-score statistics in comparison with a few players who have significant contribu-tions. Observe the complementary cumulative distribution of the players effi-ciencies and averages in points, assists and rebounds per season. . . 76 5.3 The majority of players have scored in their careers marginal values of
box-score statistics in comparison with a few players who have significant contribu-tions. Observe the probability density function (PDF) of the number of points, rebounds and assists the players achieved in their careers. The distributions fol-low a power law with a cutoff in the tail. . . 76 5.4 The efficiency of players acquired by a team has, in general, little effect on its
future performance. . . 78
5.5 NBA network changes: the number of new nodes and transactions (new edges) over the years. Note that after 1976 there is much more mobility (transactions), with the number of new nodes being around 70 while the number of transactions keep on growing. . . 81 5.6 The Team Volatility hurts the performance of the teams, i.e., the more a team
hires and fires players and coaches, the worst. Observe the regularly negative Spearman’s rank correlation ρbetween the Team Volatility ∆dand the perfor-mance of the teams. Note that, differently than box-score statistics, our network-based features can capture such correlation. . . 83 5.7 Again, note that the Roster Aggregate Volatility hurts the performance of the
teams, i.e., the more a team hires players and coaches that are constantly chang-ing their teams, the worst. The Spearman’s rank correlationρbetween theRoster Aggregate VolatilityΣ∆dand the performance of the teams is consistently neg-ative. This is another observation that cannot be drawn from usual box-score statistics. . . 84 5.8 There is no clear correlation between theTeam Inexperienceand the performance
of the teams. However, a closer look indicates that the correlation fluctuates smoothly, what suggests that the temporal scenario plays an important role in this feature. . . 86 5.9 A high coherence and rapport among players and the coach is a good indicator
that a team will succeed. Note that the Spearman’s rank correlationρbetween the Roster Aggregate Coherenceccyt and the performance of the teams is regularly
positive. . . 87 5.10 The larger the roster size, the worst for the team. The Spearman’s rank
correla-tion ρbetween theRoster Size syt and the performance of the teams is
consis-tently negative. . . 87 5.11 The proposed network-based models had good performances in predicting the
whole rank of the teams. Observe the Spearman’s rank correlation coefficientρ betweenΠyt and r
y
t. The average correlationρfor the NetForY is0.68and for
the NetFor is0.59, significative high values. . . 92 5.12 The network-based models consistently indicate a high performance team as
their top team. They correctly predicted the top performance team ≈ 35% of the times. Note that the higher the count values at the right at the distribution, the better. . . 93 5.13 The averageρbetweenΠyt andr
y
t for three consecutive years. The global average
correlationρfor the NetForY is0.59and for the NetFor and“Yesterday” model is0.52 . . . 97
5.14 The difference∆ρ=ρM1−ρM2between theρcoefficients achieved by the two modelsM1andM2. . . 97 5.15 Performance of the network-based models and of the “Yesterday” model in
identifying the best performance team. . . 98
6.1 A scenario where different WSNs are deployed in the same location. We see three networks,N1, N2andN3, and a possible cooperation edgee3(j, f), where nodef accepts data of networkN3coming from sensor nodej. . . 109 6.2 Payoff matrix of the “WSN-Cooperation” game. . . 109 6.3 The Virtual Cooperation Bond: a feasible model to execute the GTC strategy
(w(e) =d2). . . 109 6.4 The algorithm describing the establishment of the VCB. . . 112 6.5 Cooperation results when the number of nodes is varied. . . 112 6.6 Cooperation results when path loss exponent is varied. . . 112 6.7 Cooperation results when the number of networks is varied. . . 114 6.8 Cooperation results when the networks have different configurations. . . 114
A.1 Changing the value ofCchanges the location of the distribution. The median of the distributionµvaries linearly withC,µ=a×C+b, witha= 2.6andb= 3.8. The 95% confidence interval forais(2.715,2.723)and for bis (−8.60,16.3). Since the confidence interval forbcontains0,bis not significant. . . 121 A.2 Changing the value of a changes the slope ρ of the distribution in a way that
ρ=a−1. . . 122
B.1 The weightswiof the network-based prediction models over time. . . 123 B.2 Distributions of the null model results over 100000 simulations. . . 124 B.3 The proposed network-based models are not significantly sensitive toWY.
Ob-serve that we could even had used values ofWY that would give slightly higher
results than the ones we used in the previous sections. . . 126 B.4 Relationship between the clustering coefficient and the age of teams and players.
In this case, the age is the number of years a team or player have being active in the league. Note that there is a clear non-linear correlation between the clustering coefficient and the age of the nodes. . . 127
List of Tables
3.1 Classes of relationship. . . 25 3.2 Datasets used in this thesis. . . 35
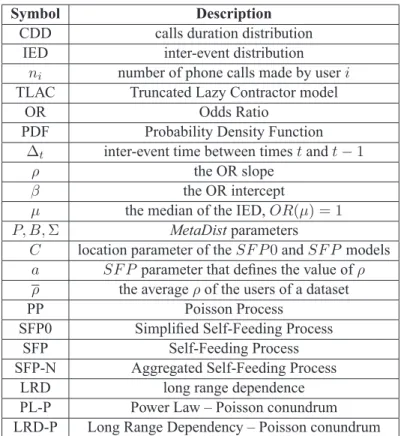
4.1 Table of symbols. . . 39 4.2 Evolution of the meta-parameters (rows 1-5) and theFocal Points(rows 6-7)
dur-ing the four months of our dataset. . . 49 4.3 Correlations between summarized attributes andρandβ. . . 52
5.1 Table of symbols. . . 82 5.2 Comparison among the Network Model and other prediction models. Inboldthe
best result and initalicthe runner up. Note that our proposed NetForY always achieved the best result. Moreover, the NetFor had a better performance than the“Yesterday” in the early years and in selecting the best performance team. . 95
6.1 Table of symbols. . . 102
Contents
Acknowledgments xi
Resumo xv
Abstract xvii
Resumo Estendido xix
Motivação . . . xix Objetivos . . . xx Contribuições . . . xxi Capítudo 3 – Redes de Mobilidade . . . xxi Capítulo 4 – Redes de Comunicação . . . xxii Capítulo 5 – Redes Competitivas . . . xxiv Capítulo 6 – Redes de Sensores Sem Fio . . . xxiv
List of Figures xxvii
List of Tables xxxiii
1 Introduction 1
1.1 Motivation . . . 1 1.2 Objective . . . 2 1.3 Contributions . . . 4 1.4 Work Organization . . . 6
2 Related Work 7
2.1 DBCN Modeling . . . 7 2.2 Predicting and Controlling . . . 10 2.3 Fundamentals of Game Theory . . . 12
3 Decision-Based Complex Networks 17
3.1 Motivation . . . 17 3.2 Modeling . . . 19 3.3 Classification . . . 22 3.3.1 DBCNs features . . . 22 3.3.2 The RECAST algorithm . . . 24 3.3.3 Classification results . . . 26 3.4 Prediction . . . 29 3.5 Controlling . . . 30 3.6 DBCNs Analyzed . . . 34
4 Modeling in Communication Networks 37
4.1 Introduction . . . 37 4.2 Communication Flow Size . . . 38 4.2.1 Preliminaries . . . 38 4.2.2 Call Duration Distribution . . . 40 4.2.3 TLAC Over Time . . . 46 4.2.4 Applications . . . 50 4.3 Communication Dynamics . . . 53 4.3.1 Contradicting Models . . . 53 4.3.2 Marginal Distributions . . . 54 4.3.3 Temporal Correlations . . . 61 4.3.4 Proposed Model: “SFP” . . . 63 4.3.5 Discussion . . . 65 4.4 Final Remarks . . . 68
5 Predicting in Competitive Networks 71
5.1 Introduction . . . 71 5.2 Related Work . . . 73 5.3 The NBA Network . . . 74 5.3.1 Problem Definition . . . 74 5.3.2 Motivation . . . 75 5.3.3 The Network Definition . . . 78 5.4 Proposed Network Features . . . 80 5.4.1 Preliminaries . . . 80 5.4.2 Team Volatility . . . 82 5.4.3 Roster Aggregate Volatility . . . 83
5.4.4 Team Inexperience . . . 84 5.4.5 Roster Aggregate Coherence . . . 85 5.4.6 Roster Size . . . 86 5.5 Network-based Prediction Models . . . 88 5.5.1 Problem Definition . . . 88 5.5.2 NetFor . . . 88 5.5.3 NetForY . . . 90 5.6 Results and Validation . . . 91 5.6.1 Results . . . 91 5.6.2 Comparison . . . 93 5.7 Generality . . . 96 5.8 Final Remarks . . . 98
6 Controlling Computer Networks 101
6.1 Introduction . . . 101 6.2 Cooperation Among Different Networks . . . 103 6.3 Related Work . . . 104 6.4 WSN Cooperation Game . . . 105 6.5 A Solution to the Game . . . 107 6.6 Establishing the VCB . . . 110 6.7 Numerical Results . . . 111 6.8 Final Remarks . . . 113
7 Conclusions and Future Work 115
A Modeling in Communication Networks 119
A.1 The Log-logistic Distribution . . . 119 A.2 The need for C in SFP . . . 120 A.3 The Two Parameters of SFP . . . 120
B Predicting in Competitive Networks 123
B.1 Metrics Weights . . . 123 B.2 Random Model Comparison . . . 124 B.3 Parameter Sensitivity Analysis . . . 125 B.4 Network Features to Node Attributes . . . 125
Bibliography 129
Chapter 1
Introduction
1.1
Motivation
The constant advancement of information systems allows, at a growing rate, more data to be generated and stored. The Internet, for example, consists of millions of computing devices in which each one of them is responsible for generating, storing and transmitting countless data. Clearly, the Internet is going in the direction of the Ubiquitous Computing paradigm, which, as envisioned in Mark Weiser’s classic paper The computer for the 21st century [Weiser, 1999], predicts the access to computing environments by any person, anywhere, at any time, so that computing devices are coupled to the most trivial objects, such as clothing labels, cups of coffee, pens or any personal object [de Araujo, 2003]. Moreover, there are Wireless Sensor Networks (WSNs) [Akyildiz et al., 2002], which are a special type of ad hoc net-work, designed to collect data from the environment they are inserted and providing such information to the final user.
Thus, we can expect an increasing amount of data to be generated from the most diverse situations. Currently, for instance, there are research studies on data from phone call records [Du et al., 2009; Seshadri et al., 2008; Hidalgo and Rodriguez-Sickert, 2008], online social networks [Leskovec et al., 2007; Hill and Nagle, 2009; Kumar et al., 2006], railroads [Faloutsos et al., 1999], Internet websites [Faloutsos et al., 1999; Albert et al., 1999], citation networks [Guo et al., 2009], movies and actors [Jensen et al., 2008], sports leagues [Vaz de Melo et al., 2008a] and many others. From these studies we now know, for instance, how people link websites in their homepages and how communities of people evolve over time. It is fascinating that, behind the names and the numbers registered in all these data, we see the reflection of the environment itself, i.e, behind every record, there is a decision made by some entity. Therefore, the knowledge of how to process this invalu-able evolving database can lead, consequently, to a better understanding of the interests and
2 CHAPTER1. INTRODUCTION
dynamics of each entity in a determined system, community or in the society.
Crandall et al. [2008], for instance, analyzed a large dataset from Wikipedia and they verified that the communications between editors is related to the similarities they have, namely the probability of occurring a communication between two individuals increases as there are similarities between them. As another example, Backstrom et al. [2006a] analyzed a LiveJournal [LiveJournal, 2010] dataset, which is an online social network with more than 10 million users, and the DBLP [DBLP, 2010], which is a database of publications on some areas of computer science with over 400000 articles, in order to understand how user communities are formed and evolve over time. They concluded, among other things, that the tendency of an individual entering a community is influenced not only by the number of friends he/she has within the community, but mainly by how those friends are connected among them. The fact is that the data generated from social interactions has a tremendous potential for uncovering and modeling the human behavior.
In this thesis, we focus on systems that are made up of entities capable of inter-acting among themselves in a autonomous way, reflecting their interests and activity dy-namics. We call these systems Decision-based Complex Networks (DBCNs), these en-tities, nodes or agents, and the interactions between nodes, edges. A DBCN is a spe-cial type of complex network Newman [2003] that contains nodes capable of making autonomous decisions, which are guided mainly by their personal motivations. For in-stance, social networks [Backstrom et al., 2006b; Kumar et al., 2006; Leskovec et al., 2008; Mislove et al., 2007] formed from friendship ties or work collaborations are DBCNs, since the nodes of these networks have decision power to create edges. On the other hand, se-mantic networks formed from texts [Steyvers and Tenenbaum, 2005] and earthquake net-works [Abe and Suzuki, 2004] are not DBCNs, since the edges creation is guided, in these cases, by a central process.
As general complex networks, DBCNs are characterized by having a large number of vertices and edges that exhibit a pattern, such as communities or highly connected vertices, called hubs [Albert et al., 1999]. While in a simple network with at most hundreds of nodes the human eye is a tool of considerable power, in a complex network, this approach is use-less. Thus, to study, analyze and characterize complex networks, fast statistical methods and algorithms are necessary.
1.2
Objective
1.2. OBJECTIVE 3
role on the evolution of the network. When we fully understand the motivations behind the actions of the agents, we are able to devise techniques to model, predict and control the behavior of diverse and large DBCNs. As we show in Figure 1.1, we divide the main objective of this thesis in:
1. Modeling. Our goal is to design models that can accurately represent the behavior
of the agents in a DBCN, significantly contributing to a better understanding of the system;
2. Predicting.From the understanding of the reasons behind the decisions of the agents,
we aim to predict how the system will evolve;
3. Controlling. Once we know how the system will behave, we design control
mecha-nisms to make the agents to act according to a determined goal.
Figure 1.1. The summary of this thesis. From DBCNs scenarios, first we model the behavior of the agents and, from this, we are able to predict their behavior. Once we know how the agents will behave, we are able to design control mechanisms to make the agents to act according to a determined goal and, therefore, change the system. New modeling and predicting efforts should be made in the new system to better control its behavior.
4 CHAPTER1. INTRODUCTION
how these decisions are made. The analyzed systems and the respective proposed applica-tions for them are described below.
Communication Networks. First, we analyze communication networks, in which every agent is an individual capable of communicating freely to any other agent in the network. More specifically, we investigate more than 1 billion mobile phone records from a private mobile phone company of a large city, spanning≈0.1TB. We study and propose models for the individual behavior of the users of this network and, from this, we propose applications for data summarization, anomaly detection, user classification and network monitoring.
Competitive Networks. Second, we tackle competitive networks, in which the social agents of the system compete among themselves for a reward or limited resources. In this case, we analyze two sports leagues: the North American National Basketball Association (NBA) and the Major League Baseball (MLB). In these networks, the social agents are both the teams and the players, and they compete for titles and money, i.e., while the players want to have high salaries, the teams want to pay less for their players, at the same time that both types of agents want to win games and titles. For these networks, we propose a prediction model that can be used to identify likely teams to win and to fail in the following season.
Computer Networks. Finally, we consider a scenario in which the agents are computing devices with a limited set of decisions that aim to improve the operability of the system they are inserted in. More specifically, we investigate a scenario where a group of WSNs is deployed in the same region and they may interact among themselves to request or share computational resources. We model the problem of cooperation among two or more different WSNs by the concepts of game theory and, from it, we present, as a control application, a protocol to allow cooperation.
1.3
Contributions
In this thesis, we propose that the understanding of the motivations for the local decisions made by the agents of DBCNs lead to the understanding of how the network globally evolves. We analyzed three different types of networks from the perspective of agents and, in the following, we enumerate the contributions we propose from this analysis:
1.3. CONTRIBUTIONS 5
follow a striking bivariate Gaussian; Finally, we show several applications that can be drawn from the TLAC and theMetaDist, such as anomaly detection and data summa-rization;
2. Proposal of the Self Feeding Process (SFP) model for the inter-event time between hu-man activities, that matches real data well, and has a very simple, intuitive explanation: the time for the next communication event depends on the time it took for the previous event to occur. The SFP model generates a particular case of the TLAC distribution and unifies earlier communication traffic models;
3. We propose the use of network features to analyze the decisions made by the agents of competitive networks, more specifically teams, players and coaches in sports leagues. From this analysis, we construct parameter-free models to predict a team success in sports leagues. We show that complex network metrics provide good prediction infor-mation without using box score statistics;
4. Finally, we analyze the behavior of agents of computer networks when they are al-lowed to make local decisions. More specifically, we consider a scenario where dif-ferent WSNs are deployed in the same region and we propose a protocol to allow cooperation among the networks.
The following publications are the current results for this thesis:
• In [Vaz de Melo et al., 2010], we analyze phone call durations of millions of users of a large mobile phone operator;
• In [Vaz de Melo et al., 2011a], we analyze the inter-event times of millions of users of a large mobile phone operator.
• In [Vaz de Melo et al., 2008a], we show that complex network metrics can be used to predict the behavior of basketball teams;
• In [Vaz de Melo et al., 2012], we propose a model to predict the behavior of sports teams;
• In [Vaz de Melo et al., 2008b] and [Vaz de Melo et al., 2008c], we analyze the problem of cooperation when different Wireless Sensor Networks are deployed in the same location;
6 CHAPTER1. INTRODUCTION
• In [Vaz de Melo et al., 2011b], we show how game theory is being used in Wireless Sensor Networks;
1.4
Work Organization
This thesis is organized as follows.
Chapter 2
Related Work
In this thesis, our goal is to study the decisions made by the agents of DBCNs. We divide this study by analyzing separately three important aspects of these networks: modeling, predicting and controlling. Thus, in this chapter, we show how these three aspects are being tackled in the literature when focusing DBCNs. In Section 2.1, we show relevant models of real and modern DBCNs. In Section 2.2, we show the challenges and opportunities for predicting and controlling in DBCNs. Finally, in Section 2.3, we show the basics concepts of game theory, since it is a fundamental mathematical technique to study decisions of rational agents.
2.1
DBCN Modeling
In the literature, there are several generative models that construct networks from local decisions of the nodes [Mitzenmacher, 2004; Chakrabarti and Faloutsos, 2006; Zhou and Lipowsky, 2005]. These models were designed to reproduce real world net-works that can not be generated by the traditional Erdös and Rényi [1960] random model. In nature, there are examples of complex networks that were modeled from the most diverse databases, such as phone call records [Du et al., 2009; Seshadri et al., 2008; Hidalgo and Rodriguez-Sickert, 2008], online social networks [Leskovec et al., 2007; Hill and Nagle, 2009; Kumar et al., 2006], railroads [Faloutsos et al., 1999], In-ternet websites [Faloutsos et al., 1999; Albert et al., 1999], citation networks [Guo et al., 2009], movies and actors [Jensen et al., 2008], sports leagues [Vaz de Melo et al., 2008b; Onody and de Castro, 2004] and many others.
Formally, each networkG(V, E)has a set of nodes (agents)V, a set of edges (connec-tions)E, and a set ofN observable characteristicsc1, c2, ...cN, that may or may not change
over time. The goal of the generative models is, from a initial and simple networkG0(V0, E0)
8 CHAPTER2. RELATEDWORK
and from a node local functionf, to construct a network that has all theN observable char-acteristics c1, c2, ...cN of the network. This local function f is designed to dictate which
decisions each node should make in order to construct the network with the desired charac-teristics.
In random networks, such as the Erd˝os and Rényi networks, thisf function is the most simple as possible: the probability of node ito connect to node j is p∀j ∈ V. However, in real complex networks, this probability changes according to the local characteristics of the nodes iand j. For instance, it was verified that in online social networks, two nodes are more likely to connect as the number of friends they share increase [Kumar et al., 2006]. Moreover, it was also verified that as a website is more popular, i.e., it has many other websites pointing to it, it is also more likely to receive new links [Faloutsos et al., 1999]. Thus, in complex networks, the functionf that governs the nodes’ decisions is constructed by modeling their preferences, which can be the desire to connect to friends of their friends, or just to connect to the most popular nodes in the network.
One of the main observed characteristics of several complex networks that exist in nature is that they are scale-free networks (SFNs). SFNs [Newman, 2003; Li et al., 2005; Keller, 2005] were introduced by Barabasi and Albert [1999] to model network topologies such that the degree distribution follows a power law [Clauset et al., 2009]. The distribution of the random variableX defines that the degree distribution follows a power law if, given its cumulative distribution functionF(x) = P(X ≤ x) and its complementary cumulative distribution function F(x) = P[X > x], F(x) = 1−F(x) ≈ cx−α for some constant
0< c <∞and tail indexα >0[Li et al., 2005]. For1< α <2,F has infinite variance and finite mean but, for0< α≤1, both the variance and the mean are infinite. Besides this, one interesting property of this distribution is thatlog(P[X > x])≈log(c)−αlog(x), making the plot ofF in logarithmic scales to be a line with slope−αfor high values ofx. For more examples and details on how to identify power laws, please refer to [Clauset et al., 2009].
To the best of our knowledge, the first model that aimed to reproduce the scale-free characteristic of complex networks from the local decisions of the agents was the BA model [Barabasi and Albert, 1999]. This model, inspired in thecumulative advantagemodel proposed by Price [1976], incorporates two characteristics to explain the network formation: growth and preferential attachment. The first one stipulates that the number of nodes of the network grows with time, while the second one stipulates that the more connections a node has, the higher the chances for it to receive more edges. This phenomenon, also known as “the rich gets richer”, will result in a network with a few nodes with many connections, calledhubs, and many nodes with a few.
2.1. DBCN MODELING 9
the BA model is given from a connected network withn0 >2initial nodesv1, ..., vn0. Then,
a new nodevn0+1 joins the network and connects to a nodevj,0 < j ≤ n0 according to a
probability that is proportional to the degreedjofvj. Formally, the probabilitypi,j of a node
vito connect to an existing nodevjis:
pi,j =
dj
Pn u=1du
.
Leskovec et al. [2008] extensively validated the BA model for four collections of real data: FLICKR, DELICIOUS, LinkedIn and YAHOO! ANSWERS. It was found that, even
compared with more sophisticated variations, the BA model is the one that best explains the
degree distribution of the databases analyzed. However, the BA model considers that the
nodes have the global knowledge of the network, which is not realistic for most networks.
To overcome this drawback, Leskovec et al. [2008] and Vázquez [2003] propose a local
version of the BA model, where the process of creating the edges does not depend on the
global knowledge of the network. These models stipulate that the nodes decide to connect to
a node if the edge will close a triangle, considering, then, solely the local information of the
node: its neighborhood.
While the scale-free characteristic could be successfully reproduced by the local
func-tion of generative models, there were still other relevant network characteristics that
re-mained without any explanation. Therefore, other generative models were proposed in order
to develop a unified theory on the local behavior of the nodes of the most popular complex
networks.
Chen and Shi [2004] proposed two variations of the BA model considering relocation
and deletion of edges of the network. Holme and Kim [2002] defined an additional step to the
BA model, where each edge created by the BA model generates a second additional edge that
closes a triangle. This model is interesting because it creates a network with characteristics
of an SFN and a “small-world” network [Milgram, 1967; Albert et al., 1999; Amaral et al.,
2000].
Moreover, Leskovec et al. [2007] proposed theforest firemodel, which in addition to
the characteristics previously described, is also capable of reproducing two new observations
made from the temporal analysis of real networks: the densification lawand theshrinking
diameter. The first stipulates that the number of edges grows super-linearly with the number
of nodes while the second one stipulates that the network diameter decreases with time.
To generate these characteristics, the local node function states that, after connecting to a
10 CHAPTER2. RELATEDWORK
Considering weighted networks, McGlohon et al. [2008] modified the forest fire
model, proposing thebutterflymodel, that states that the nodes should also connect to nodes
that are distant from its vicinity. This model is able to capture discovered characteristics of
weighted graphs, such as thefortification effect, which states that the relationship between
the number of edges of a graph and their total weight is superlinear, following a power law.
Still in weighted graphs, Du et al. [2009] proposed the Pay and Call game to model the
behavior of users in a network formed from mobile users of a telecom operator. It was
con-sidered that each user is a rational agent that will make calls if the benefit from a call is higher
than its cost. With this model, the authors could reproduce some of the characteristics we
described so far, such as scale-free property and also new characteristics, such as the “clique
participation law” that states that the number of maximal cliques in the network follows a
power law.
2.2
Predicting and Controlling
The theoretical models that were proposed for characterizing the evolution of social networks
improved significantly our knowledge on these systems. Therefore, as our knowledge on the
behavior of social networks grows, the problem of predicting which links will appear in
the future becomes easier or, at least, less complicated. The fact is that the methods for
forecasting the occurrence of future edges are based on the knowledge embedded in these
models, as we see in this section.
Liben-Nowell and Kleinberg [2007] defined the link prediction problem as a basic
computational problem underlying social network evolution as: Given a snapshot of a social
network at timet, how can we accurately predict the edges that will be added to the network
during the interval from timetto a given future timet′. Basically the link prediction problem
asks to what extent can the evolution of a social network be modeled using features
intrin-sic to the network itself. As we see in this definition given by Liben-Nowell and Kleinberg
[2007], the link prediction problem is directly related to problem of modeling in DBCNs.
Moreover, the problem of link prediction play an important role in understanding the
evolution of DBCNs and is relevant to a large number of applications. For instance, a
company can analyze the interactions within the informal social network among its
mem-bers and then suggest promising interactions or collaborations that have not yet been
uti-lized within the organization [Kautz et al., 1997; Raghavan, 2002]. Moreover, a social
net-work analysis could be made monitoring terrorist netnet-works in order to spot individuals who
are working together even though their interaction has not been directly observed [Krebs,