INFLUENCE OF THE OPERATING PARAMETERS ON THE FLUX DURING MICROFILTRATION OF THE STEEPWATER IN THE STARCH INDUSTRY
Zita I. Šereša*, Ljubica P. Dokića, Biljana S. Pajina, Dragana M. Šoronja Simovića, Drago Šubarićb, Jurislav Babićb and Aleksandar Z. Fišteša
a
University of Novi Sad, Faculty of Technology, Bulevar cara Lazara 1, 21000 Novi Sad, Serbia b
Josip Juraj Strossmayer University, Faculty of Food Technology, Franje Kuhača 18, 31000 Osijek, Croatia
The subject of the work is the possibility of applying microfiltration through a ceramic tubular membrane with 100 nm pore sizes to the steepwater obtained in the production process of corn starch. The dry matter content should be reduced in the steepwater permeate. Thus the consumption of the process water would be reduced, the nutrients from the steepwater could be exploited as feed and the wastewater problem would consequently be solved. The objective of the work was to examine the influence of the operating parameters on the permeate flux during steepwater microfiltration. The parameters that vary in the course of microfiltration, were the transmembrane pressur and flow rate, while the permeate flux and dry matter content of the permeate and reten-tate were the dependent parameters, constantly monitored during the process. Another objective of this study was to investigate the influence of static turbulence promoter on the permeate flux during steepwater microfiltration. Static mixers enhance permeate flux, thus the microfiltration can be performed longer. As a result of the statistical analysis, the optimal conditions for steepwater microfiltration were determined. The maximum value of the permeate flux without mixer (25 lm-2h-1) was achieved at a pressure of 2 bars and a flow rate around 100 lh-1. With the use of static mixer the flux is 2,5 times higher compared to the one obtained without the mixer. The dry matter content of the permeat after 2.5 hours of mucrofiltration was lowered by 40%.
KEY WORDS: steepwater, microfiltration, ceramic membranre, permeate flux, dry matter content
INTRODUCTION
Governments of the developed countries have tried to increase the pressure on the largest waste producers in order to reduce the undesired environmental pollution. For example, the Commission of the European Communities introduced the Integral Pollution and Prevention Control Directive. The purpose of the directive is to achieve integrated prevention and the control of pollution arising from the particular activities listed in its Annex I. Among others, the directive defines the Best Available Techniques (BAT) as
the most effective and advanced stage in the development of activities and their operation methods which indicate the practical suitability of particular techniques for providing in principle the basis for emission limit values designed to prevent and, where that is not practicable, generally to reduce emissions and the impact on the environment (1, 2). One of them is membrane technique.
Membrane separation is a filtration technique in which a feed stream is fractionized with a porous membrane. Some of the dissolved solids are held back because their mo-lecular size is too large to allow them to pass through. The size range depends upon the pore sizes of the used membrane. Fractionation of the feed stream occurs, with some mo-lecules being concentrated on the upstream side of the membrane, which is known as the concentrate or retentate. The smaller molecules pass through the membrane into the per-meate stream. There are few membrane processes where they can be characterized by dri-ving forces that cause mass transfer of solutes (e.g. difference in concentration – dialy-sis), difference in electric potential - electro-dialydialy-sis), difference in pressure – microfiltra-tion, ultrafiltramicrofiltra-tion, nanofiltramicrofiltra-tion, reverse osmosis) (3, 4, 5).
The main problem in the performance of microfiltration is concentration polarization and fouling of the membrane. Concentration polarization causes deposition of retained compounds on the membrane surface. A number of reviews have described the process in detail (5, 6). The pure water flux of micro- and ultrafiltration membranes is usually high, but when separation starts through the membrane, the permetae flux falls very quickly, which is caused by the gel formation on the membrane surface. This gel layer forms a secondary barrier to the flow through the membrane (5, 7). There is no possibility for avoiding membrane fouling but it can be limited by applying a number of different tech-niques which enhance membrane flux. These techtech-niques might be pre-treatment of feed stream, backflushing, fluidized bed, fluid instability, application of electric, magnetic and ultrasonic fields (5). Fluid instability can be more useful in overcoming concentration polarization and membrane fouling, various possibilities have been tested: turbulence promoters, pulsation and rotating membrane filter (Taylor vortex flow). Turbulence pro-moters as static mixers were applied for permeate flux enhancement during the separation of non-sucrose compounds from sugar beet syrup (8). There are several papers dealing with the application of membrane filtration for purification of wastewater from starch processing industry or for filtration of the starch suspensions (9, 10). Membrane filtration is used in order to achieve an increase in the quality of the finished sweetening and syrup products. It has also found its application in the process of water elimination, i.e. dehy-dration in the course of the production. It is used to isolate proteins from diluted process flows (11).
EXPERIMENTAL
Microfiltration experiments were conducted on the samples of steepwater, which were obtained from the corn starch wet milling plant „Jabuka“, Pančevo (Serbia). The procedu-re of microfiltration on a single-channel ceramic membrane with 100 nm poprocedu-re sizes on the laboratory apparatus for microfiltration has already been published (12).
The central part of the apparatus is the module with the membrane inside. In this stu-dy, use was made of the ceramic membrane of GEA manufacturer (Germany). The mem-brane is single-channel, 250 mm lenght, with the inner diameter of 6.8 mm and outer dia-meter of 10 mm. The membrane is made of -Al2O3 with TiO2 layer. The active mem-brane surface equals 0.005 m2. The pore sizes of the membrane are 100 nm. This pore size is twice smaller than that usually used for starch wastewater, e.g. ny Cancino-Mada-riaga and Aguirre (13). These authors used a 0.2 m PVDF membrane of 7.5 m2. Their experiment was carried out in a real production plant on wastewater solutions with and without a prior sedimentation step. Šaranović et al. (12) investigated microfiltration of wheat starch wastewater on ceramic membrane with 200 nm pore sizes, and achieved a dry matter decrease of about 50–60%. For this investigation of steepwater microfiltration, the membrane with 100 nm pore sizes could be used because it contains smaller particles and no starch. Dry matter content was 6.5%, out of which proteins were 50%, lactic acid 26%, carbohydrates (as dextrose) 2.5%, and total ash 21.5%.
The static turbulence promoter used during experiments was the stainless steel Kenics static mixer. The static turbulence promoter was inserted inside the whole membrane tube and was fixed properly to avoid any movement due to the fluid flow (12).
The microfiltration experiments were planned based on a full 23 factorial designed experiment (14). In this experiment, the factors, i.e. the independent parameters were the transmembrane pressure (p) and flow rate (Q). Table 1 shows the values for the indepen-dent parameters which varied during the course of filtration.
Table 1. Varied values of independent variables
Independent variables Q [L/h] P [bar] Varied values 50 / 150/ 200 1 / 2/ 3 Q - flow rate [L/h]
P - transmembrane pressure [bar]
The dependent parameters monitored during the process of microfiltration, permeate flux and dry matter content of permeate and retentate were determined at the beginning, during and at the end of microfiltration (4).
The determination of dry matter content in steepwater and of permeate and retentate was based on the following: defined volume of steepwater, permeate or retentate weight in the laboratory glass, with a known mass of the glass. The glass with the content of the sample was put in the water bath. When the water evaporated, the glass with the content was dried at 105oC to a constant weight.
The membrane was cleaned before each experiment with 0.5% solution of Ultrasil 11. The effectiveness in membrane cleaning was assessed by examining the water flux reco-very. The cleaning procedure was repeated until the 95% of original water flux was resto-red.
The influences of transmembrane pressure and flow rate on the permeate flux with the time were analyzed by means of a statistical multifactorial analysis of the experimental data (12).
Responses fitted with the polynomial model [1] of the second degree were: permeate flux without static mixer - JNSM, and permeate flux with static mixer - JSM:
z = b0+b1·x+b2·y+b11·x·x+b22·y·y+b12·x·y [1]
where z - JNSM or JSM [l/m2h], x - P [bar], y - Q [l/h] and b0, b1, b2, b11, b22, b12 - coef-ficients.
RESULTS AND DISCUSSION
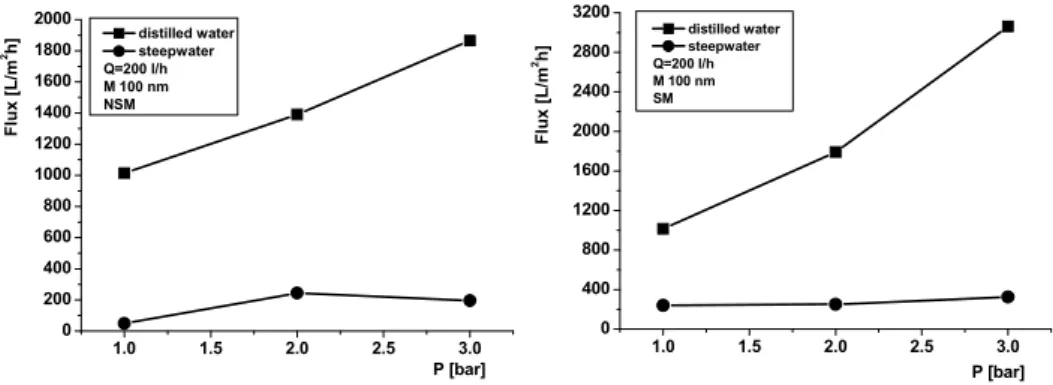
Fig. 1 compares the dependence of the fluxes of distilled water and steepwater on the transmembrane pressure for the microfiltration on the ceramic membrane with pore sizes of 100 nm at flow rate of 200 L/h, and at room temperature. It shows how many times are the permeate flux smaller compared to the water flux. The water flux is the basic parame-ter for flux comparison with the permete steepwaparame-ter flux. It is evident that the permeate flux of steepwater is 5-10 times reduced at transmembrane pressures of 1-3 bars com-pared to the water flux. Fig. 1 shows just the preliminary experiments at the first few mi-nutes of the microfiltration.
After this experiment, the main experiments were started based on a full 23 factorial design. At each combination of pressure and flow rate, the microfiltration were stopped after cca. 3 hours. Figures 2, 3, and 4 show the results of these experiments.
1.0 1.5 2.0 2.5 3.0
0 200 400 600 800 1000 1200 1400 1600 1800 2000 Fl u x [ L /m 2h] P [bar] distilled water steepwater Q=200 l/h M 100 nm NSM
1.0 1.5 2.0 2.5 3.0
0 400 800 1200 1600 2000 2400 2800 3200 Flu x [ L /m 2h] P [bar] distilled water steepwater Q=200 l/h M 100 nm SM
Figure 1. Dependence of the fluxes of distilled water and steepwater permeate on the transmembrane pressure in the microfiltration on the ceramic membrane with pore sizes of 100 nm at flow rate of 200 L/h, at room temperature with (SM) and without (NSM) the
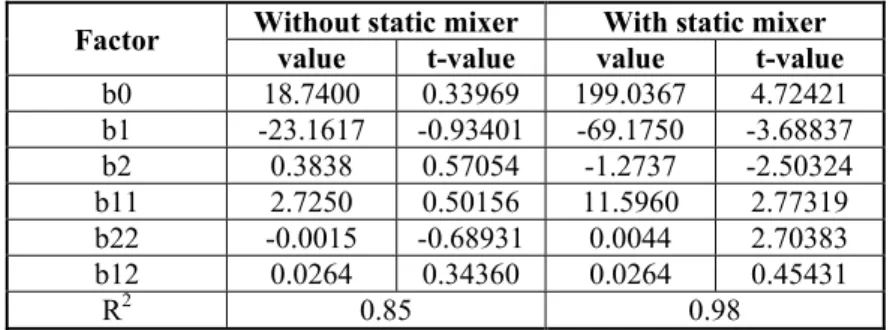
The results of fitting the experimental values of the permeate flux after 2.5 hours of microfiltration of the second-order polynomial are shown in Table 2.
The second-order polynomials (flux as a function of the pressure and flow rate) [2] and [3] stand for the case without and with the use of the static mixer, respectively:
JNSM= 18.74-23.1617·P+0.3838·Q+2.725·P2+0.0264·P·Q-0.0015·Q2 [2]
JSM= 199.0367-69.175·P-1.2737·Q+11.596·P2+0.0264·P·Q+0.0044·Q2 [3]
They approximate well the experimental results for the system without (R2 =0.85) and with static mixer (R2 =0.98). The relatively high values of R2 obtained for all responses indicate good fit of the experimental data to equation (12). The closer the value of R2 to the unity, the better the empirical model fits the actual data (16). The significance of each coefficient was determined through the t-values. The larger the magnitude of the t-value the more significant is the corresponding coefficient. The polynomial model tested for the selected responses were significant at the 95% confidence level (p-value; 0.05, Table 2).
Table 2. Results of fitting the experiemntal values of the permeate flux, after 2.5 hours of microfiltration
Factor Without static mixer With static mixer value t-value value t-value
b0 18.7400 0.33969 199.0367 4.72421
b1 -23.1617 -0.93401 -69.1750 -3.68837
b2 0.3838 0.57054 -1.2737 -2.50324
b11 2.7250 0.50156 11.5960 2.77319
b22 -0.0015 -0.68931 0.0044 2.70383
b12 0.0264 0.34360 0.0264 0.45431
R2 0.85 0.98
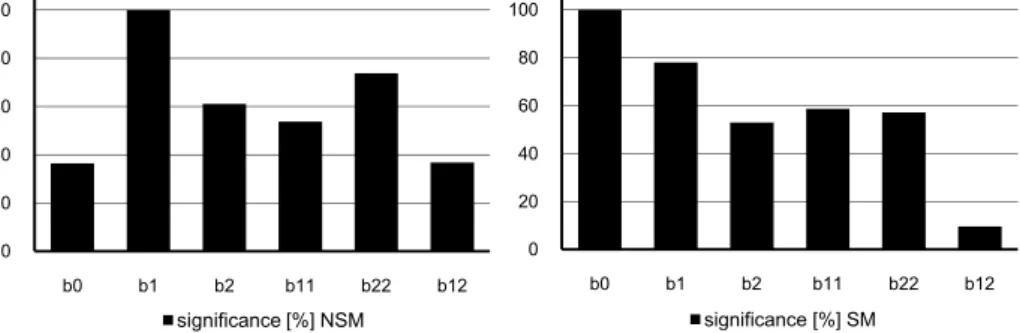
Figure 2. Significance of the individual coefficient of the average permeate flux correlation with and without static mixer
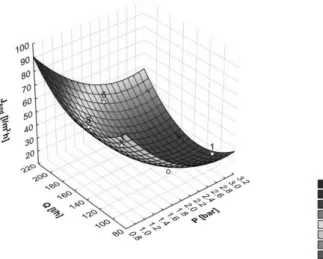
Based on the obtained experimental values and using the program Statistica 8.0 a regression equation was obtained, which best describes the dependence of the flux on the transmembrane pressure and flow rate, and the graphs depicting two dependent variables are shown in Fig. 3. In the case without static mixer, the most important linear factor influencing the permeate flux without turbulence promoter is the pressure and the figure shows that the highest flux values without static mixer caan be achieved (over 25 L/ m2h) when the flow rate is held around 150 L/h and the transmembrane pressure under 2 bars.
Figure 3. Dependence of the steepwater permeate flux on the transmembrane pressure and flow rate for the microfiltration without static mixer
It could be expected that the permeate flux would increase with the transmembrane pressure. However, there is a negative effect of a higher transmembrane pressure: the cake layer may become more compact as the transmembrane pressure increases, leading to a greater flux reduction (16). At higher steepwater flow rates, with increasing trans-membrane pressure, the permeate flux initially increases, eventually reaching a stationary value (18). A higher steepwater flow rate results in a higher tangential shear stress and
0 20 40 60 80 100
b0 b1 b2 b11 b22 b12 significance [%] NSM
0 20 40 60 80 100
the particles on the membrane surface are more unstable (19). Consequently, less cake mass can be formed under a higher flow rate, which leads to an increase in the average permeate flux. It can be noticed that with increasing flow rate at all transmembrane pressures, the average permeate flux in the system without static mixer increases.
Figure 4. Dependence of the steepwater permeate flux on the transmembrane pressure and flow rate in the microfiltration with static mixer
The effects of the transmembrane pressure and flow rate on the permeate flux in the system with static mixer are presented in Fig. 4. Evidently, the increases in the trans-membrane pressure results in a decreased permeate flux at all flow rates. In the system with the presence of static mixer a steady state value of the permeate flux is not achieved with increasing transmembrane pressure, as it is the case in the system without static mixers. The main reason is that the turbulence promoter allows the creation of the secondary flow to improve mass transfer and mixing of fluids near the surface membrane, which also reduces the deposition (7). On comparing the values of permeate flux in the system with and without static mixers it can be seen that the increase in the permeate flux, achieved by increasing the transmembrane pressure at low flow rates and pressures is around 300%. The static mixer as turbulence promoter provides a high-speed flow and better mixing, and allows slower deposition of particles on the membrane surface and reduces the thickness of the cake (20). With the increase of steepwater flow rate, the permeate flux increases at all transmembrane pressures, but the flux increase is more evident increase at lower transmembrane pressures. At higher pressures, it may happen that some particles from steepwater penetrate into the membrane pores, decreasing thus the mixing effects.
- 0.84
81 . 479 05 .
32 t
NSM e
J [4]
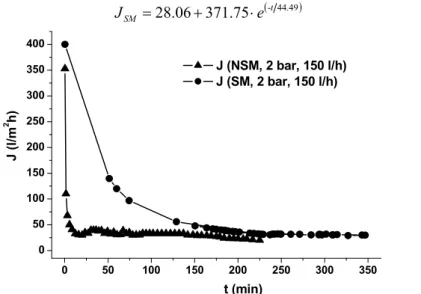
where the R2 is 0.98. From the picture, it can be seen that after just 5 minutes the flux declines from 352 to 50 l/m2h. After that, until 225 minute the declination is slower, but it ends with 20 l/m2h. The use of a static mixer during the ultrafiltration is much better. The flux decline is slower (at 129 minute the flux reaches 55 l/m2h). The flux decline with the use of static mixer can be described by equation [5], where the R2 is 0,99:
- 44.49
75 . 371 06 .
28 t
SM e
J [5]
0 50 100 150 200 250 300 350
0 50 100 150 200 250 300 350 400
J (l/m
2 h)
t (min)
J (NSM, 2 bar, 150 l/h) J (SM, 2 bar, 150 l/h)
Figure 5. Time dependence of the steepwater permeate flux with (SM) and without (NSM) the use of the static mixer under the same operating conditions
The dry matter content of the retentate increased in average by 10%, and the dry mat-ter content of the permeate decreased by about 20–40%, depending on the microfiltration mode (NSM or SM). This means that during the steepwater microfiltration permeate con-tains 40% less particles, and thus it can be considered for the use as recicled water in the corn starch production.
CONCLUSIONS
On the basis of the study of the effects of the steepwater microfiltration conditions, the following conclusions can be drawn:
After 2,5 hours of microfiltration without static mixer, the maximum value of the permeate flux (25 lm-2h-1) was achieved at the pressure under 2 bars and the flow rate around 150 lh-1.
By using static mixer, the maximal flux is around 90 lm-2h-1, which is almost 4 times higher than the flux value reached in the system without a static mixer.
The dry matter content of the retentate increases in average by 10%, and the dry matter content of the permeate is lowered by about 20–40%, depending on the microfiltration mode (NSM or SM)
Acknowledgement
The authors acknowledge the financial support of the Secretariat for Science and Technological Development of the Province of Vojvodina through the project „Cookies and crackers with functional characteristics with special dietary needs“.
REFERENCES
1. European Commision: Reference Document on Best Available Techniques in Com-mon Waste Water and Waste Gas Treatment / Management Systems in the Chemical Sector. February 2003 (pdf), http://eippcb.jrc.es (accessed 10/09/2012).
2. European Commision: Reference Document on Best Available Techniques in the Food, Drink and Milk Industries. Dated January 2006 (pdf), http://eippcb.jrc.es (accessed 10/09/2012).
3. Cheryan M.: Ultrafiltration Handbook. Lancaster, Basel, Technomic Publishing Co. Inc. (1986) 73-125.
4. Šereš Z.: Ultrafiltracija u industriji šećera. Monography, Zadužbina Andrejević, Beograd i Tehnološki fakultet, Novi Sad (2009) 23-33.
5. Baker R. W.: Membrane Technology and Application, John Wiley & Sons, West Sussex (2004) 1-14, 161-189, 237-272.
6. Gupta B.B., Howell J.A., Wu D. R. and Field W.: A helical baffle for cross-flow microfiltration. J. Memb. Sci. 99 (1995) 31-42.
7. Zhen X.-H., Yu S.-L., Wang B.-F and Zheng H.-F.: Flux enhancement during ultrafiltration of produced water using turbulence promoter, J. Environ. Sci. 18 (2006) 1077-1081.
8. Šereš Z., Gyura J., Djurić M., Vatai Gy. and Jokić A.: Separation of non-sucrose com-pounds from sugar-beet syrup by ultrafiltration with ceramic membrane containing static mixer, Desal. 250 (2010) 136-143.
9. Yeh H.M., Chen H.Y. and Chen K.T.: Membrane ultrafiltration in a tubular module with a steel rod inserted concentrically for improved performance, J. of Memb. Sci. 168 (2000) 121-133.
11.Rausch K. D.: Membrane Technology in the starch processing industry,Starch/Stärke 54 (2002) 273-284.
12.Šaranović Ž., Šereš Z., Jokić A., Pajin B., Dokić Lj., Gyura J., Dalmacija B., Šoronja Simović D.: Re-duction of solid content in starch industry wastewater by microfil-tration, Starch/Starke 63 (2011) 64-74.
13.Cancino-Madariaga B. and Aguirre J.: Combination treatment of corn starch waste-water by sedimentation, microfiltration and reverse osmosis, Desalination 279 (2011) 285-290.
14.Krstić D.M., Tekic M.N., Caric M.D.and Milanovic S.D.: Static turbulence promoter in cross-flow microfiltration of skim milk, Desal. 163 (2004) 297-309.
15.Akhnazarova S.and Kafarov V.: Experiment optimiziation in chemistry and chemical engineering, MIR Publishers, Moscow (1982) 77-149.
16.Lee Y. and Clark M.M.: Modeling of flux decline during crossflow ultrafiltration of colloidal suspensions, J. Memb. Sci. 149 (1998) 181-202.
17.Djuric M., Gyura J.and Zavargo Z.: The analysis of process variables influencing some characteristics of permeate from ultra- and nanofiltration in sugar beet proces-sing, Desal. 169 (2004) 167-183.
18.Vladisavljevic G.T., Vukosavljevic P.and Bukvic B.: Permeate flux and fouling resis-tance in ultrafiltration of depectinized apple juice using ceramic membranes, J. Food Eng. 60 (2003) 241-247.
19.Hwang K.-J., Hsu Y.-L. and Tung K.-L.: Effect of particle size on the performance of cross-flow microfiltration, Advanced Powder Technology 17 (2006) 189-206. 20.Pal S., Bharihoke R., Chakraborty S., Ghatak S.K., De S. and Gupta S: An
experi-mental and theoretical analysis of turbulence promoter assisted ultrafiltration of synthetic fruit juice, Separ. and Purif. Tech. 62 (2008) 659-667.
ɍɌɂɐȺȳɊȺȾɇɂɏɉȺɊȺɆȿɌȺɊȺɇȺɎɅɍɄɋɉȿɊɆȿȺɌȺɌɈɄɈɆ
ɆɂɄɊɈɎɂɅɌɊȺɐɂȳȿȼɈȾȿɈȾɆɈɑȿȵȺɍɂɇȾɍɋɌɊɂȳɂ
ɋɄɊɈȻȺ
. a, . a, . a, .
a
, , . a
a
, , 1, 21000 ,
, , 18, 31000
,
-.
-,
.
100 nm.
,
.
-.
25 l/m2h,
2 100l/h.
2,5
-. 2,5 40%
, .
Ʉʂɭɱɧɟɪɟɱɢ: , ,