Rictor
/TORC2 Regulates
Caenorhabditis elegans
Fat Storage, Body Size, and Development
through
sgk-1
Kevin T. Jones1, Elisabeth R. Greer1, David Pearce2, Kaveh Ashrafi1*
1Department of Physiology and Diabetes Center, University of California San Francisco, San Francisco, California, United States of America,2Department of Medicine, University of California San Francisco, San Francisco, California, United States of America
The target of rapamycin (TOR) kinase coordinately regulates fundamental metabolic and cellular processes to support growth, proliferation, survival, and differentiation, and consequently it has been proposed as a therapeutic target for the treatment of cancer, metabolic disease, and aging. The TOR kinase is found in two biochemically and functionally distinct complexes, termed TORC1 and TORC2. Aided by the compound rapamycin, which specifically inhibits TORC1, the role of TORC1 in regulating translation and cellular growth has been extensively studied. The physiological roles of TORC2 have remained largely elusive due to the lack of pharmacological inhibitors and its genetic lethality in mammals. Among potential targets of TORC2, the pro-survival kinase AKT has garnered much attention. Within the context of intact animals, however, the physiological consequences of phosphorylation of AKT by TORC2 remain poorly understood. Here we describe viable loss-of-function mutants in theCaenorhabditis eleganshomolog of the TORC2-specific component, Rictor(CeRictor). These mutants display a mild developmental delay and decreased body size, but have increased lipid storage. These functions ofCeRictorare not mediated through the regulation of AKT kinases or their major downstream target, the insulin-regulated FOXO transcription factor DAF-16. We found that loss ofsgk-1, a homolog of the serum- and glucocorticoid-induced kinase, mimics the developmental, growth, and metabolic phenotypes ofCeRictormutants, while a novel, gain-of-function mutation insgk-1suppresses these phenotypes, indicating that SGK-1 is a mediator ofCeRictor activity. These findings identify new physiological roles for TORC2, mediated by SGK, in regulation ofC. eleganslipid accumulation and growth, and they challenge the notion that AKT is the primary effector of TORC2 function.
Citation: Jones KT, Greer ER, Pearce D, Ashrafi K (2009)Rictor/TORC2 regulatesCaenorhabditis elegansfat storage, body size, and development throughsgk-1. PLoS Biol 7(3): e1000060. doi:10.1371/journal.pbio.1000060
Introduction
Target of rapamycin (TOR), a serine/threonine kinase of the phosphatidylinositol kinase-related family, is broadly conserved in eukaryotes, and in all systems examined, it is required for normal growth [1]. The TOR kinase acts as a sensitive cellular fuel gauge that receives inputs from multi-ple growth-promoting signals and, in turn, orchestrates a vast array of cellular responses such as translational control, ribosome biogenesis, and autophagy [1]. TOR’s control of these vital cellular processes makes it, on the organismal scale, a critical player in numerous disease states, such as cancer, aging, and cardiovascular disease [2].
One reason for the immense diversity of TOR-regulated processes is that the kinase operates in two complexes, each with its own unique set of components and subsequent substrates [3]. The proteins Raptor and Rictor (rapamycin-insensitive com-panion of mTOR) are mutually-exclusive binding partners for TOR and define the TORC1 and TORC2 complexes, respectively [3]. TORC1 can also be distinguished from TORC2 functionally, because only TORC1 is inhibited by the compound rapamycin [3–5]. The use of this drug has been the major driving force in the study of the TOR kinase—it enabled the identification of key TORC1 targets [6–8], and the TOR kinase itself was first discovered by genetic analysis in yeast aimed at determining the mechanism of rapamycin’s growth-inhibitory action [9].
Deciphering physiological functions of TORC2 has been hampered by lack of pharmacological inhibitors and lethality
of yeast and rodentRictormutants, although the development of tissue-specificRictorandRaptorknockout mice has recently been reported [10–12]. While TOR- and Raptor-deficient mouse embryos die soon after implantation,Rictor-deficient embryos die in midgestation around embryonic day 10.5 (E10.5), suggesting that TORC2 is not required for early proliferative and developmental events.Rictorknockout mice are, at the time of embryonic arrest, slightly smaller and developmentally delayed compared to wild-type littermates [13,14]. The first viable Rictormutant to be studied in any organism wasPianissimo(Pia), the singleDictyosteliumhomolog. These mutants are unable to activate adenylyl cyclase in response to chemotactic GPCR signaling [15]. Viable Rictor
mutants have also recently been described in Drosophila
[16,17]. Consistent with the mouse data, reported phenotypes of Drosophila Rictor mutants include a mild developmental delay and an overall reduction in body size [16,17].
Academic Editor:Tony Hunter, Salk Institute for Biological Studies, United States of America
ReceivedAugust 7, 2008;AcceptedFebruary 2, 2009;PublishedMarch 3, 2009
Copyright:Ó2009 Jones et al. This is an open-access article distributed under the terms of the Creative Commons Attribution License, which permits unrestricted use, distribution, and reproduction in any medium, provided the original author and source are credited.
Abbreviations:HM, hydrophobic motif; Rictor, rapamycin-insensitive companion of mTOR; TOR, target of rapamycin
Another source of complexity in understanding the physiological roles of TORC2 is that, like any kinase, it has multiple substrates. A seminal discovery in elucidating the functions of TORC2 was its identification as a kinase activator of AKT [18], which is a key mediator of signaling of insulin and other pro-growth factor pathways and a kinase that is inappropriately activated in numerous cancers [19]. AKT, like all related AGC family kinases, is phosphorylated at several distinct sites, including the activation loop, mediated by PDK1, and the C-terminal turn and hydrophobic motifs, mediated by TORC2 [18,20,21]. Although hydrophobic motif (HM) phosphorylation of AKT has become a major readout for TORC2 function, it is not required for AKT to phosphorylate many of its substrates [22]. As in mammals, phosphorylation of the HM domain of Drosophila AKT is severely reduced in Rictor-deficient flies [16,17], yet AKT functions remain largely intact [16]. Similarly, removal of this phosphorylation site from the Drosophila AKT does not prevent its capacity to restore normal growth to tissues lacking AKT [16]. Thus, while HM motif phosphorylation of AKT increases its kinase activity in vitro [23] and has been postulated to permit maximal levels of kinase activity in vivo [16], the physiological significance of AKT as an effector of TORC2 in intact animals has been difficult to assess. Other AGC family kinases, such as PKC and SGK (serum- and glucocorticoid-regulated kinase), contain the conserved HM motif and have been proposed to mediate in vivo functions of TORC2 in yeast [24,25], yet the interplay of TORC2 and its various potential effectors in animals remain poorly under-stood.
Another complicating factor in elucidating the physiolog-ical functions of TORC2 is that genetic analyses of TORC2 in mammalian cell culture and in intact animals have yielded differing results. For instance, siRNA-induced knockdown of
Rictorin mammalian cells disrupts the actin cytoskeleton [26], but ablation of Rictor through homologous recombination causes lethality without notable effects on the actin
cytoske-leton [13,14]. Together, these observations raise the need for disentangling the TOR signaling network within the context of intact animals, where contributions of various potential effectors of TORC2 on size, growth, and other potential physiological processes can be rigorously examined.
Here, we report the identification of viable, loss-of-function Rictor mutants in C. elegans. In addition to these mutants having body size and growth defects, similar to previous reports ofRictormutants in other organisms [16], we demonstrate that they also show an increase in stored fat. Our genetic analyses of these mutants indicate that TORC2 regulates the observed fat storage, size, and developmental phenotypes through sgk-1, rather than the AKTs. These findings reveal that the SGK kinase family is a key physiological mediator of the pro-growth and lipid storage effects of TORC2.
Results
Identification ofC. elegans Rictor Mutants
In a screen aimed at identifying C. elegans mutants with altered lipid storage, we isolatedlpo-6(mg360), an allele of the singleC. eleganshomolog of TORC2-specific componentRictor
(encoded by the gene F29C12.3). C. elegans stores fat in intestinal and skin-like hypodermal cells, and intestinal stores are readily detectable using the vital dye Nile Red [27]. Mutants identified in this screen were termed ‘‘lpo,’’ or lipophilic dye abnormal. Thelpo-6(mg360) mutation results in a single amino acid substitution at a highly-conserved residue in the C-terminal region of the protein, which has been shown to be required for Rictor function in Saccharomyces cerevisiae[28] (Figure S1). The excess fat accumulation oflpo-6
(mg360) mutants was associated with enlarged lipid-storing subcellular particles throughout intestinal cells, as well as an overall increase in Nile Red fluorescence (Figure 1A and 1B). We confirmed increased lipid storage phenotype of lpo-6
(mg360) by staining with other lipid dyes—fatty acid-conjugated BODIPY [27,29] and the fixed stain Sudan Black [30] (Figure S2A and S2B). Overexpression of the wild-type, genomic CeRictor locus in lpo-6 (mg360) mutants not only reversed the increased fat phenotype of this mutant but resulted in lower-than-wild-type fat levels (Figure 1C), suggesting that the recessive mg360 mutation is a loss-of-function allele. In addition to having excess fat,lpo-6mutants displayed decreased adult body size (Figure 1D) and a slight developmental delay, phenotypes quite similar to those noted in Drosophila Rictor mutants [16]. The decreased size and developmental delay of lpo-6 (mg360) mutants were also rescued to wild type by transgenic expression of the wild-type genomicCeRictorlocus (Figure 1E and unpublished data). In an unrelated Nile Red screen, we later isolated another allele of CeRictor, ft7, which is likely to be a null, as this mutation results in a very early stop (Figure S1). Consistent with this interpretation, the lpo-6 (ft7) mutation causes a greater increase in fat storage, smaller body size, and a more severe developmental delay than thelpo-6(mg360) mutation (Figure 1A, 1B, and 1D).
To compare lipid staining at matched developmental stages, we allowed CeRictor mutants to grow for a longer period of time than wild-type animals (see Materials and Methods for details) so that we always assayed fat content at the start of egg-laying in all strains. The increased fat staining
Author Summary
ofCeRictormutants was not the result of this correction, as animals grown for the same duration of time as wild type still displayed increased fat staining even though they were less mature (Figure S2C). The excess fat ofCeRictormutants was not simply a reflection of the same total fat contained within a smaller volume either. In fact, other similarly small-sized mutants did not display enhanced fat accumulation (Figure 2C). Together, these findings indicate thatCeRictorfunctions to regulate fat storage, growth, and development.
CeRictorMutant Phenotypes Are Mimicked by Loss of Another TORC2 Component
While originally designated as a lethal gene inactivation, the loss of CeTOR kinase encoded by let-363 allows for
completion of embryonic development but causes a non-conditional larval-stage arrest with dauer-like phenotypes [31,32]. Loss of daf-15/CeRaptor also results in dauer-like developmental arrest [31,32]. By contrast, under identical growth conditions, CeRictor mutants and wild-type animals grow to reproductive adults without entry into the dauer stage. We found that animals in which theC. eleganshomolog oflst-8(encoded byC10H11.8) was targeted by RNAi also grew to reproductive adults without dauer entry and, as adults, displayed the fat, size, and developmental delay phenotypes of CeRictor mutants (Figure S3 and unpublished data). lst-8
encodes for a G protein b subunit–like protein whose mammalian homolog is found in both TORC1 and TORC2 complexes. Surprisingly, however, mLST-8mutant mice
dis-Figure 1.Loss ofCeRictorCauses Increased Lipid Storage and Decreased Body Size
(A) Images of Nile Red staining of lipids in anterior intestinal cells of adult wild-type,lpo-6(mg360), andlpo-6(ft7) strains. Representative images are shown. In each image, anterior of the animal is to the right.
(B) Quantification of Nile Red staining. Mean fluorescence intensity is reported as a percentage of the mean for wild-type animals (error bars indicate s.e.m.). Single asterisk indicates ap-value,0.05, and double asterisk indicatesp-value,0.01 (wild type versus mutant, two-tailedt-test,n¼5–7). (C) Quantification of Nile Red staining. Mean fluorescence intensity is reported as a percentage of the mean for wild-type animals (error bars indicate s.e.m.). Single asterisk indicates ap-value0.05, and double asterisk indicates p-value,0.01 (wild type versus mutant, two-tailedt-test,n¼5–8).lpo-6
(þ) and (-) refer to the presence or absence of wild-typeCeRictortransgene.
(D) Quantification of body size measurements. The perimeter of each worm was measured. Values reported as mean size as a percentage of mean for wild type (error bars indicate s.e.m.). Double asterisk indicatesp-value,0.01 (wild type versus mutant strain, two-tailedt-test,n¼10).
(E) Quantification of body size measurements. The perimeter of each worm was measured. Values reported as mean size as a percentage of mean for wild type (error bars indicate s.e.m.). Double asterisk indicatesp-value,0.01 (wild type versus mutant strain, two-tailedt-test,n¼10).lpo-6(þ) and (-) refer to the presence or absence of wild-typeCeRictortransgene. Body size of rescuedlpo-6mutants (lpo-6(mg360); lpo-6(þ)) is not significantly different from wild-type animals (p-value¼0.88, two-tailedt-test,n¼10).
play the phenotypes ofRictor, notRaptor, mutants, and they are not defective in the phosphorylation of known TORC1 targets [14]. Thus, our findings are consistent with murine characterizations showing thatRictormutant phenotypes are recapitulated by inactivation of lst-8 while TOR mutant phenotypes are recapitulated by Raptor inactivation. While we are unable to rule out the possibility that RNAi may not fully abrogatelst-8expression, these data support the notion that phenotypes associated withlpo-6 mutations are due to reduced TORC2 signaling.
Expression Pattern ofCeRictor
To determine the spatial relationship between Rictorand other components of TOR complex, we examined the expression pattern of a GFP reporter fusion controlled by the rescuing promoter ofCeRictor. GFP reporter fusions to let-363/CeTOR and daf-15/CeRaptor are expressed throughout development and adulthood in most tissues, including intestine, skin-like hypodermis, pharyngeal and body wall muscle, and the nervous system [31,32]. Expression ofCeRictor
reporter fusion was limited to the intestinal and hypodermal cells at early larval stages. As animals grew to the adult stage, visible expression was restricted to the intestinal cells and a single pharyngeal interneuron, I1 (Figure S1C–S1E). We do not yet know the relevance of the observed I1 expression; however, expression of the GFP reporter fusion in key fat-storing tissues ofC. elegansis consistent with a role forCeRictor
in regulating fat accumulation.
CeRictorActs Independently of the DBL-1 TGF-bPathway to Regulate Body Size
BecauseRictormutants in both the fly and mouse display a proportionate and subtle decrease in body size [13,16], we chose to examine the mechanisms by whichCeRictorregulates size. Changes in either cell number or cell size may alter total body size. The reduced body size oflpo-6mutants, however, is unlikely to be the result of a failure in cell proliferation, as there are no obvious groups of cells missing or reduced in number in lpo-6 mutants. These animals only show a size defect after they complete larval development (unpublished data). Together with the fact that theC. eleganscell lineage is highly invariant, these findings suggest that the small size of
CeRictormutant reflects a defect in achieving post-mitotic cell size.
The major size-regulatory pathway inC. elegansis mediated by a TGF-b ligand, DBL-1, that connects signaling upstream in the nervous system to the skin-like hypodermal cells and modulates cell size throughout the organism in a dose-dependent manner [33]. Size regulatoryegl-4,dbl-1,sma-6, and
lon-1define a linear genetic pathway (Figure 2A). The EGL-4 cGMP-dependent protein kinase is required for mediating food-related sensory cues that elicit diverse behavioral and physiological responses [34]; it also acts in sensory neurons to regulate body size [35]. Gain-of-function mutations in egl-4
[e.g.,egl-4(ad450)], cause a decrease in size, whereas loss-of-function mutations [e.g.,egl-4(n478)] result in increased size [35,36]. The large size of loss-of-functionegl-4mutants is fully suppressed by loss ofdbl-1[35]. The DBL-1 ligand is produced in the neurons of the nerve cord that extends the length of the animal, and it signals through the SMA-6 and DAF-4
TGF-breceptors acting in the hypodermis to promote normal size [37,38]. In turn, the SMA-6/DAF-4 receptors regulate the transcription of numerous genes that specifically influence cell growth; one such target is LON-1, a protein of uncharacterized biochemical function whose transcription is repressed by DBL-1 and SMA-6. Loss-of-function mutations inlon-1increase body size and suppress the small size ofdbl-1
andsma-6mutants [39,40].
We probed the relationship betweenCeRictorsignaling and this previously-characterized size pathway by constructing double mutant strains bearing thelpo-6(mg360) mutation and other size-altering mutations. The lpo-6 (mg360) mutation decreased body size in nearly all backgrounds examined
Figure 2.CeRictorRegulates Size Independent of thedbl-1Pathway (A) Genetic regulatory hierarchy of the dbl-1-mediated body size pathway. Molecular function, expression pattern, and representation of null phenotype for each component are indicated.
(B) Quantification of body size measurements. The perimeter of each worm was measured. Sizes are reported as percentage of wild type (error bars indicate s.e.m). For each gene, sizes of both mutant strain alone (black bars) and mutant strain also harboring thelpo-6(mg360) mutation (gray bars) are shown. Asterisks indicate significance of difference between single mutant andlpo-6(mg360);mutant strain; single asterisk indicatesp-value,0.05 and double asterisk indicatesp-value,0.01 (two-tailedt-test,n¼10–20 per strain).sma-6(wk7) andsma-6(wk7) ;lpo-6(mg360) are not significantly different (two-tailed t-test, p¼0.24). Percentages above bars represent the percent reduction in lpo-6
(mg360); mutant strain as compared to mutant strain alone (percentage refers to size as a percentage of wild type).
(C) Quantification of Nile Red staining. Mean fluorescence intensity is reported as a percentage of the mean for wild-type animals (error bars indicate s.e.m.). For each gene, sizes of both mutant strain alone (black bars) and mutant strain also harboring thelpo-6(mg360) mutation (gray bars) are shown. Asterisks indicate significance of difference between single mutant andlpo-6(mg360); mutant strain; single asterisk indicates
p-value,0.05, and double asterisk indicatesp-value,0.01 (two-tailed
t-test,n¼5–7 per strain). As indicated in Materials and Methods, the reported values for fat correspond to Nile Red fluorescence within the first three pairs of intestinal cells without adjustment for differences in cell size between mutants.
(Figure 2B). Several observations indicated that CeRictor
cannot be placed within a linear genetic relationship with other size-regulatory pathway components. First, the small-sizedlpo-6(mg360) mutant was not fully suppressed by size-increasingegl-4andlon-1mutations, nor did it fully suppress the effects of these mutations (Figure 2B). Second, loss of
CeRictorhad a much greater effect in normal-sized or large strains, compared to small-sized strains (Figure 2B). For example, loss ofCeRictorreduced the size oflon-1mutants by nearly 20%, whereas it reduced the size of dbl-1 or sma-6
mutants by only 3–5%, a 4- to 6-fold difference. Thus, rather thanCeRictoracting as a component of the size-regulatory dbl-1pathway, these epistatic relationships indicate thatCeRictor
has a permissive function acting in parallel with the dbl-1
pathway to shape the final organismal form. In support of this hypothesis, thelpo-6(mg360) mutation resulted in increased lipid staining in every size-altering background, suggesting thatCeRictordoes not act through the DBL-1 pathway (Figure 2C).
The excess fat storage and genetic relationship ofCeRictor
mutants with other size-pathway mutants suggested that
CeRictor may influence organismal size by regulating the utilization of resources toward energetic processes like cell growth and development. As such, because of an increased demand for resources, mutants that display excessive cell size (such as thelon-1andegl-4loss-of-function mutants) would be more dependent upon growth-permissive TORC2 signaling than mutants with modest size.
CeRictorMutants Display Wild Type Feeding Behavior but Decreased Fecundity
To further characterize the role of CeRictor in energy balance, we examined whether CeRictor activity is also necessary to promote other energetically demanding pro-cesses. CeRictor mutants had grossly normal rates and patterns of locomotion (unpublished data). By contrast, these animals produced ;40% fewer progeny than wild type, resulting in over 100 fewer offspring on average
(Figure 3A). We also examined food intake behavior of
CeRictormutants by measuring the pharyngeal pumping rate [41]. The more severe feeding-defective (eat) mutants share some phenotypes with CeRictor mutants—decreased size, slow growth, and reduced brood size [41]. Unlike the eat
mutants, however, the pumping rate oflpo-6(mg360) animals was indistinguishable from that of wild-type animals under well-fed conditions (Figure 3B), suggesting that the in-creased lipid storage ofCeRictormutants is not attributable to feeding behavior and that their pleiotropic phenotypes are not simply due to insufficient nutrient intake at the level of feeding. Our findings suggest that TORC2 activity promotes body size, development, and progeny production in a regulated fashion, consistent with the known role of TOR kinase as a gauge of nutrient availability that coordinates utilization of energetic resources. Moreover, the severity of phenotypes caused by loss ofCeRaptorrelative to those caused byCeRictorindicate that the TOR kinase can fine tune responses of the organism to environmental conditions.
CeRictorRegulation of Lipid Storage, Size, or Development Is Independent of AKT and DAF-16/FOXO Signaling
To investigate the molecular mechanisms through which
CeRictorregulates fat storage, size, and development, we first focused onAktand insulin signaling. AKT phosphorylation at the HM site by TORC2 has been hypothesized to be a major output of TORC2 [18,22], and the Akt/insulin signaling pathway is a major regulator of metabolism and growth [42].C. eleganshas two AKT homologs that act redundantly to phosphorylate the FOXO transcription factor, DAF-16, which is a key effector of responses elicited upon reduced insulin signaling [43]. Inactivation of the daf-2 insulin receptor or simultaneous inactivation of bothAktgenes results in dauer arrest that is fully suppressed by mutation ofdaf-16 [43]. If
CeRictor acts solely through activation of the Akt genes to inhibit DAF-16/FOXO, then null mutations indaf-16 should suppress allCeRictormutant phenotypes. Strikingly, we found that elimination of daf-16/FOXO did not alter the lipid storage, body size, nor developmental phenotypes ofCeRictor
mutants (Figure 4A–4D). These results show thatCeRictoracts in parallel to or downstream ofdaf-16 in regulation of size, rate of development, and fat accumulation.
Next, we explored the possibility that CeRictor functions through the Akt pathway but independent of its DAF-16 output. To avoid dauer arrest caused by inactivation of both
Akt genes and to specifically investigate daf-16-independent outputs ofAktsignaling, we asked whetherakt-1; akt-2; daf-16
triple mutants mimicked any of the phenotypes seen in
CeRictor mutants. These triple mutants accumulated nearly wild-type fat levels (Figure 4A and 4B), exhibited slightly elevated body size (Figure 4C), and displayed a very mild developmental delay (Figure 4D). Moreover, the quadruple
lpo-6(mg360); akt-1; akt-2; daf-16mutant strain was no different with respect to fat storage or body size than lpo-6 (mg360) alone (Figure 4A–4C). These results show that the excess fat and reduced size of CeRictor mutant are unlikely to be consequences of reduced AKT activity, because complete removal of AKT activity does not mimic or alter these phenotypes. Furthermore, we found that the loss ofCeRictor
in the context ofakt-1,akt-2, anddaf-16mutations resulted in a synthetic reduction in developmental rate (Figure 4D),
Figure 3.Inactivation ofCeRictorDoes Not Affect Feeding Rate but Is Required for Normal Reproduction
(A) Total number of progeny was counted for individual wild-type or lpo-6(mg360) animals (n¼10 per strain). Average brood sizes are expressed as a percentage of wild type (error bars indicate s.e.m.). Double asterisk indicatesp-value,0.01(two-tailedt-test).
(B) Feeding rate (pharyngeal pumping) was measured inlpo-6(mg360) and wild-type animals (n¼20 for each strain). Average rate is expressed as a percentage of wild type (error bars indicate s.e.m.). Strains were measured as well-fed adults. Wild-type andlpo-6(mg360) animals are not significantly different (p¼0.14, two-tailedt-test).
delaying the onset of egg-laying by nearly 24 h relative to wild type [compared to a roughly 6-h delay inlpo-6(mg360) alone]. This again suggests that the growth delay ofCeRictormutants is not merely a reflection of reduced AKT activity but that
CeRictoracts in parallel to a novel, daf-16–independent Akt
signaling pathway to regulate development. These results do not exclude the possibility thatCeRictormay activateAktfor other physiological processes or under other conditions, but they strongly indicate that the fat, size, and developmental phenotypes ofCeRictorare not consequences of compromised AKT signaling.
CeRictorActs in a Pathway withsgk-1to Regulate Lipid Storage, Size, and Development
Since the AKTs and DAF-16/FOXO were not the relevant outputs forCeRictorwith respect fat, size, and developmental rate, we investigated the possibility of TORC2 regulation of these processes through other AGC family kinases. Knockdown of the three C. elegans PKC homologs resulted in visible phenotypes, but not those associated with CeRictor mutants (unpublished data). Strikingly, however, targeting the single SGK homolog, sgk-1, by RNAi resulted in fat, size, and developmental phenotypes strongly resembling CeRictor
mu-Figure 4.CeRictorRegulation of Lipid Storage, Size, and Development Is Independent ofAktandFOXOFunction (A) Images of Nile Red staining of lipids in anterior intestinal cells.
(B) Quantification of Nile Red staining. Mean fluorescence intensity is reported as a percentage of the mean for wild-type animals (error bars indicate s.e.m.). Asterisk indicatesp-value,0.05 (wild type versus mutant, two-tailedt-test,n¼4–5).lpo-6(mg360);daf-16andlpo-6(mg360);akt-1;akt-2;daf-16
are not significantly different fromlpo-6(mg360) (two-tailedt-tests,p-values for both comparisons are 0.44).
(C) Quantification of body size. Values are reported as mean size as a percentage of mean for wild type (error bars indicate s.e.m.). Double asterisk indicatesp-value,0.01 (wild type versus mutant strain, two-tailedt-test,n¼10).lpo-6(mg360);daf-16andlpo-6(mg360);akt-1;akt-2;daf-16are not significantly different fromlpo-6(mg360) (two-tailedt-test,p-values are 0.84 and 0.12, respectively).
(D) Developmental timing of mutant strains. Animals were grown from synchronized L1s for 72 h at 208C; individuals were then scored for developmental stage. Fifty nine–156 animals were used for each strain.
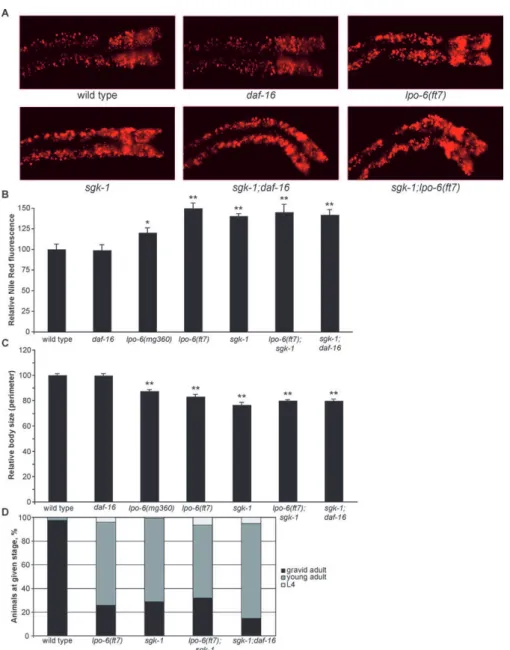
tants (unpublished data). We confirmed these RNAi phenotypes by using ansgk-1mutant likely to be a null, because a deletion in this strain removes most of the region encoding the SGK-1 kinase domain [44].sgk-1null mutants displayed a fat accumu-lation phenotype very similar to that oflpo-6(ft7) (the likely null allele of CeRictor), both in terms of enlarged lipid particle morphology (Figure 5A) and total fluorescence (Figure 5B). As previously reported [44],sgk-1mutants had decreased size and a slight developmental delay, and these phenotypes were highly similar to those oflpo-6(ft7) animals (Figure 5C and 5D).
BothCeRictorandsgk-1are expressed in the intestinal cells, raising the possibility of a direct regulatory connection [44]. To ascertain whether CeRictor and sgk-1 define a singular pathway, we examined the phenotypes oflpo-6; sgk-1double mutants. Although each null allele on its own had robust Nile Red, size, and developmental phenotypes, the double mutant showed no enhancement of any of the three phenotypes when compared with sgk-1 alone (Figure 5A–5D), demon-strating that lpo-6 and sgk-1 act in the same pathway to regulate these processes. Consistent with CeRictor’s daf-16–
Figure 5.CeRictorandsgk-1Define a Single Regulatory Pathway Governing Fat Storage, Body Size, and Developmental Rate (A) Images of Nile Red staining of lipids in anterior intestinal cells.
(B) Quantification of Nile Red staining. Mean fluorescence intensity is reported as a percentage of the mean for wild-type animals (error bars indicate s.e.m.). Single asterisk indicatesp-value,0.05, and double asterisk indicatesp-value,0.01 (wild type versus mutant, two-tailedt-test,n¼5–6).lpo-6
(ft7) is not significantly different fromsgk-1(two-tailedt-test,p-value¼0.20).sgk-1does not statistically differ fromsgk-1;lpo-6(ft7) orsgk-1;daf-16 (two-tailedt-tests,p-values¼0.63 and 0.81, respectively).
(C) Quantification of body size. Values reported as mean size as a percentage of mean for wild type (error bars indicate s.e.m.). Double asterisk indicates
p-value,0.01 (wild type versus mutant strain, two-tailedt-test,n¼10).sgk-1does not statistically differ fromsgk-1;lpo-6(ft7) orsgk-1;daf-16(two-tailed
t-tests,p-values¼0.11 and 0.14, respectively).
(D) Developmental timing of mutant strains. Animals were grown from synchronized L1s for 72 h at 208C; individuals were then scored for developmental stage. Sixty–185 animals were used for each strain.
independent function, we found that the complete loss of
daf-16did not suppress or otherwise alter the fat, size, and developmental delay phenotypes of sgk-1 mutants (Figure 5A–5D). All previously described phenotypes of sgk-1
inactivation in C. elegans (increased tendency for dauer formation when combined with other mutations, enhanced stress resistance, and extended lifespan) had been shown to operate entirely through the inhibition of DAF-16/FOXO [44]. Thus, our findings indicate that additional mediators of
SGK function remain to be identified. Finally,sgk-1mutants also exhibited the same synthetic developmental delay phenotype in the context of the akt-1; akt-2; daf-16 triple mutants (Figure 6A) that we observed with lpo-6 (mg360) mutants (Figure 4D). Taken together, our genetic results indicate thatCeRictorandsgk-1function in a shared pathway to regulate fat storage, size, and development. These results are consistent with findings inS. cerevisiae, where the TORC2 complex has been shown to directly phosphorylate the SGK
Figure 6.A Gain-of-Function Mutation insgk-1Suppresses the Fat Storage, Body Size, and Developmental Phenotypes oflpo-6(mg360)
(A) Developmental timing of mutant strains. Animals were grown from synchronized L1s for 72 h at 20 8C; individuals were then scored for developmental stage. Sixty–185 animals were used for each strain. One hundred and six–181 animals were used for each strain. In all panels of this figure,sgk-1(gf) refers to the describedsgk-1(ft15) allele, andsgk-1refers to the null deletion allele,sgk-1(ok538).
(B) Images of Nile Red staining of lipids in anterior intestinal cells.
(C) Quantification of Nile Red staining. Mean fluorescence intensity is reported as a percentage of the mean for wild type or vector control (error bars indicate s.e.m.). Asterisk indicatesp-value,0.05 (lpo-6(mg360);sgk-1(gf) grown on vector control versussgk-1RNAi, orlpo-6(mg360) grown on vector control versuslpo-6(mg360);sgk-1(gf) grown on vector control, two-tailedt-test,n¼5–6).sgk-1grown on vector control does not differ significantly fromsgk-1grown onsgk-1RNAi (two-tailedt-test,p-value¼0.77).
(D) Quantification of body size. Values reported as mean size as a percentage of mean for wild type on vector control (error bars indicate s.e.m.). Double asterisk indicatesp-value,0.01 (lpo-6(mg360);sgk-1(gf) grown on vector control versussgk-1RNAi, orlpo-6(mg360) grown on vector control versus
lpo-6(mg360);sgk-1(gf) grown on vector control, two-tailedt-test,n¼10).sgk-1grown on vector control does not differ significantly fromsgk-1grown onsgk-1RNAi (two-tailedt-test,p-value¼0.89).
homolog Ypk2 to regulate growth and ceramide synthesis [24,25].
A Novel, Gain-of-Function Mutation insgk-1Suppresses the Lipid Storage, Size, and Developmental Phenotypes of
CeRictor
To demonstrate that CeRictor regulates lipid metabolism and growth by activatingsgk-1, we first attempted to generate a constitutively active form of SGK-1. We reasoned that such an activated SGK-1 would rescue phenotypes caused by loss ofCeRictor. We speculated that substitutions of glutamic acid or aspartic acid for the threonine at residue 444 in the HM domain of CeSGK-1, equivalent to S422 in mouse SGK-1, might result in a constitutively active SGK-1. We generated SGK-1 constructs with a glutamic acid substitution at Thr444 alone and aspartic acid substitutions simultaneously at Thr444 and the predicted phosphorylated residue within the turn motif. The introduction of these transgenes into
CeRictormutants did not, however, result in rescue of any of the phenotypes of these mutants (unpublished data). The structural and biochemical reasons why these amino acid substitutions failed to generate activated SGK-1 are not known, but these results are similar to what has been reported inS. cerevisiae. In that system, substituting aspartic acid residues at both the hydrophobic motif and turn motif phosphorylation sites on Ypk2 also fails to rescue tor2
mutants [25].
Next, we undertook an unbiased, forward mutagenesis screen aimed at identifying suppressors ofCeRictor. To isolate specific suppressors ofCeRictor, we mutagenizedlpo-6(mg360); akt-1; akt-2; daf-16animals and screened the F2generation for those that suppress this strain’s developmental delay. As a secondary screen, we then searched for suppressors that also abrogate the increased Nile Red phenotype of the quadruple mutant strain. Reasoning that an activating mutation insgk-1
might suppressCeRictor, we sequenced the sgk-1 locus in all potential mutants that passed both rounds of screening and identified one line with a mutation insgk-1. This allele,sgk-1
(ft15), has a G-to-A transition resulting in a Glu-to-Lys amino acid substitution at residue 116, shortly before the start of the kinase domain (Figure S4A and S4B). The sgk-1 (ft15) mutation partially suppresses the synthetic developmental delay of thelpo-6; akt-1; akt-2; daf-16 strain (Figure 6A), and exposure of lpo-6; akt-1; akt-2; daf-16; sgk-1 (ft15) quintuple mutants tosgk-1RNAi abrogated the effects of theft15allele, suggesting that this allele is likely a gain-of-function mutation insgk-1(unpublished data).
To determine its effect onCeRictoralone, we outcrossed the
sgk-1(ft15) mutation, removing theakt-1anddaf-16mutations in the background; however, becausesgk-1is linked to the akt-2locus, the outcrossedft15mutant strain also retained the
akt-2deletion, which we have shown does not suppress any of the phenotypes of lpo-6(mg360) (Figure 4A–4D). sgk-1 (ft15) mutants displayed wild-type body size and fat, and the mutation completely suppressed both the decreased body size and increased fat phenotypes oflpo-6 (mg360) mutants (Figure 6B–6D). The ft15 allele also suppressed the slight developmental delay of thelpo-6(mg360) single-mutant strain (unpublished data). Finally, the sgk-1 (ft15) mutation was inherited in a semi-dominant manner, and inactivation of sgk-1by RNAi abolished the ability ofsgk-1(ft15) to suppresslpo-6
(mg360) phenotypes (Figure 6C and 6D). Interestingly, sgk-1
(ft15) is a weaker suppressor of the more severe, nullCeRictor
allele,lpo-6(ft7); in this background, it partially suppresses the small size phenotype and does not significantly reduce fat staining (Figure S4C and S4D). We do not currently know the biochemical consequences of the mutation caused byft15on SGK-1 activity. Similarly, additional studies are needed to elucidate how SGK-1 activity is specifically affected by the partial or total loss ofCeRictorfunction. Nevertheless, these genetic results strongly indicate that theft15allele produces an activating mutation in SGK-1 and that this mutation suppresses nearly all of the phenotypes associated with
CeRictor, demonstrating conclusively that CeRictor signals throughsgk-1to regulate lipid storage, size, and development. In sum, the observations that loss-of-function mutations in
sgk-1 mimic phenotypes ofCeRictor, while a forward genetic screen aimed at finding suppressors ofCeRictoridentified an
sgk-1 gain-of-function mutation, indicate that sgk-1 is a physiologically significant mediator of TORC2 activity inC. elegans.
Discussion
We have found that loss of Rictorfunction causes devel-opmental delay, reduced size and reproduction, but excess fat accumulation in C. elegans. Similar phenotypes have been observed by another group using independently generated alleles of Rictor (A. Soukas and G. Ruvkun, personal communication). As inactivation of another core TORC2 component, LST-8, recapitulates theCeRictorphenotypes, our findings suggest that, as in all other systems examined,
CeRictorfunctions as part of the TORC2 complex. We found that the phenotypes caused by CeRictor inactivation were independent of activities of AKT and its downstream effector, the DAF-16/FOXO transcription factor. We further found that all of the phenotypes associated with loss of
CeRictorwere fully mimicked by loss of sgk-1 and that these phenotypes were suppressed by a novel, gain-of-function mutation in sgk-1. These data indicate that Rictor, through TORC2, regulates fat storage, size, and development in C. elegans, and it governs all three phenotypes through upstream activation ofsgk-1.
While the discovery that TORC2 phosphorylates AKT on its HM motif has been critical in characterization of various TORC2 complex components and identifying potential TORC2 targets based on HM domain homologies, the most prominent phenotypes caused by inactivation of TORC2 inC. elegansare independent of this activity.CeRictorappears to act through sgk-1 but in parallel to both Aktgenes to promote development, as the simultaneous loss of bothAkthomologs andCeRictor/sgk-1results in a synergistic developmental delay. This genetic interaction occurs in the absence of daf-16
activity, demonstrating FOXO-independent outputs for the
overexpression of FOXO transcription factor or inactivation of PTEN, a phosphatase that elevates PIP3 levels and thus enhances AKT activity [16]. Consistent with our findings, under normal growth conditions, abrogation of AKT’s HM domain phosphorylation has minimal effects on AKT-dependent cell growth inDrosophila[16].
The TORC2-SGK regulatory pathway is conserved across phylogeny and is used for a variety of physiological processes. InS. cerevisiae, TORC2 regulates ceramide synthesis through activation ofYPK2(an SGK homolog inS. cerevisiae), which in turn is required for membrane synthesis and active cell growth [24]. Gain-of-function mutations in YPK2 suppress the lethality of TORC2 loss-of-function mutations [25], just as the ft15 gain-of-function mutation in sgk-1 suppresses the metabolic and growth phenotypes ofCeRictor. Interestingly, in
Dictyostelium, TORC2 is required to activate both the closest
AktandSgkhomologs, and both kinases regulate cell growth and chemotaxis [45]. In mammals, the regulation of SGK family kinases by mTORC2 and its physiological significance are just beginning to be probed. Recently, mTORC2 has been shown to be required for mSGK1 hydrophobic motif phosphorylation in mammalian cells, and immunoprecipi-tated mTORC2 directly phosphorylates mSGK1 in vitro [46]. Furthermore, phosphorylation of an SGK1-specific target is reduced in cells deficient in mTORC2 components [46]. Thus, SGK appears to be the predominant effector of TORC2 under normal growth conditions inS. cerevisiaeandC. elegans, and a similar regulatory interaction is suggested by in vitro and cell-based studies in mammalian systems.
Whether TORC2 and SGK kinase family regulate fat metabolism in mammals is not yet known. A muscle-specific deficiency of Rictor has recently been reported, and Rictor
seems to be largely dispensable for proper muscle cell morphology, function, and respiration [10]. While an adi-pose-specific knockout ofRaptorhas been described, a similar knockout ofRictorhas not [11]. Whereas theC. elegansgenome contains a single SGK gene, mammals have three.Sgk1 and
Sgk3 knockout mice have surprisingly mild phenotypes, possibly due to redundant functions of SGKs.Sgk2-null mice have not yet been reported. Sgk3-null mice display a transient growth delay and defects in hair follicle development, whereasSgk1-null mice are defective in salt balance under a salt-deficient diet and their glucose uptake by various tissues post glucose load is blunted [47,48]. The deep evolutionary origins of numerous mammalian andC. elegansfat regulatory pathways suggest that in mammals, as inC. elegans, mTORC2 and mSGK family of kinases may also play roles in lipid metabolism; likewise, it will be important to demonstrate whether mTORC2 activation is required for any of the processes known to be governed by the mSGKs, such as sodium transport and blood pressure regulation.
Materials and Methods
C. elegans strains and maintenance. Nematodes were grown
according to standard protocols at 208C [49]. N2 Bristol was used as wild-type strain. The following strains were used:daf-16(mgDf47)I,
daf-16(mgDf47)I;lpo-6(mg360)II,daf-16(mgDf47)I;lpo-6(mg360)II;akt-1
(mg306) V;akt-2 (tm812) X, daf-16 (mgDf47) I;lpo-6 (mg360) II;akt-1
(mg306)V;akt-2(tm812);sgk-1(ft15)X, daf-16(mgDf47)I;akt-1 (mg306)
V;akt-2(tm812)X,daf-16(mgDf47)I;akt-1(mg306)V;akt-2(tm812);sgk-1
(ok538)X,daf-16(mgDf47)I;sgk-1(ok538)X,sma-6(wk7)II,sma-6(wk7)
II;lpo-6(mg360)II,lpo-6(mg360)II,lpo-6(mg360)II;lon-1(e185)III,lpo-6
(mg360) II;egl-4 (ad450sd) IV, lpo-6 (m,g360) II;egl-4 (n478) IV, lpo-6
(mg360)II;dbl-1(nk3)V,lpo-6(ft7)II,lpo-6(mg360)II;akt-2(tm812);sgk-1
(ft15)X,lpo-6(ft7)II;akt-2(tm812);sgk-1(ft15)X,lpo-6(ft7);sgk-1(ok538)
X,lpo-6(mg360);ftEx560[Plpo-6::lpo-6genomic::polycis-GFP; Pmyo-2::mCherry],
lon-1(e185)III,egl-4(ad450sd)IV,egl-4(n478)IV,dbl-1(nk3)V,akt-2
(tm812);sgk-1(ft15)X,sgk-1(ok538)X,N2;ftEx645[Plpo-6::GFP; Podr-1::RFP].
Lipid staining. Nile Red staining and image analysis were performed as described previously [50,51]. Briefly, images were taken with identical exposure times and below saturation of pixel intensity. The first three pairs of anterior intestinal cells were selected (we previously demonstrated that this is generally representative of fat content quantification that includes the entire animal). Using ImageJ software, Nile Red–stained particles were enhanced by the Spot-Tracker Gaussian filter, a mask was created to remove background signal, and fluorescence intensity was measured. For all experiments, worms were synchronized by hypochlorite treatment of adults and imaged at the onset of egg-laying. All comparisons were conducted on animals that were at the same developmental stage. Due to the delay in developmental rate, strains containinglpo-6(mg360) were imaged 4–6-h later than wild type, strains containinglpo-6(ft7) orsgk-1were imaged 9–10 h later than wild type, andlpo-6(mg360);akt-1;akt-2;daf-16
worms were imaged ;20 h later than wild type. Because of suppression of the developmental delay phenotype oflpo-6(mg360), thelpo-6(mg360);sgk-1(ft15) was plated at the same time assgk-1(ft15) and wild type.C. eleganswere stained with BODIPY 500/510 C1,C12 in the same manner as that described for Nile Red, but the concen-tration was different: 1mg/ml BODIPY in DMSO stock was diluted 1:2,500 then 0.5 ml were added to 6-cm NGM plates seeded with OP50. Sudan Black staining was performed as described previously [50]. Representative images from single experiments are shown; each experiment was repeated on variably numerous occasions but at least twice. In each experiment 5–10 animals were quantified per genotype.
Body size measurements.Images of adult worms were taken at 53
magnification, and perimeter was traced and measured using Open-lab software (Improvision). Pixel measurements were converted to microns by calibration using a stage micrometer. Animals were measured at the onset of egg-laying; developmental timing differ-ences were adjusted as described above. Single experiments are shown—each experiment was performed at least twice, and in each experiment 10–20 animals were measured per genotype.
RNAi. RNAi by feeding was performed as described previously [52]. RNAi clone againstC10H11.8(lst-8homolog) from the Ahringer feeding library was used [53]. RNAi was induced for two generations (synchronized adults were grown from L1s on HT115 expressing RNAi or L4440, then eggs harvested by hypochlorite treatment). Synchronized progeny were plated on RNAi plates with Nile Red and analyzed as adults. For sgk-1 RNAi experiments, the RNAi clone againstW10G6.2(sgk-1) from the Vidal feeding library was used [54]. In these experiments, RNAi was induced for one generation, starting as synchronized L1s.
Rescue and promoter::GFP reporter constructs. Entire genomic locus forlpo-6(F29C12.3) plus 1,039 base pairs of upstream sequence was amplified in three PCR fragments overlapping by 1 kb. The last fragment contained a polycistronic sequence fused to GFP and the
unc-5439UTR (gift of G. Brown) by PCR fusion. All three fragments were injected at 10 ng/ll into the gonad oflpo-6(mg360) adults. For expression pattern, rescuing promoter was amplified by PCR, cloned into Gateway vector (Invitrogen), and fused in-frame to GFP with the
unc-5439UTR. Plasmid was injected into N2 animals at 100 ng/ll with
Podr-1::RFPas a coinjection marker.
Feeding rate measurements.Experiments were performed essen-tially as described previously [50]. Egg-laying adults were measured in each experiment; strains were adjusted for developmental differences as indicated above.
the increased staining of the originallpo-6(mg360); akt-1; akt-2; daf-16
strain were selected for future study.
Supporting Information
Figure S1.Molecular Cloning ofCeRictorMutants
(A) Gene structure forlpo-6(F29C12.3). Intron/exon boundaries are shown to scale. Below is a schematic of the LPO-6 protein; numbers reflect amino acid sequence of LPO-6 protein (there are no consensus domains in the protein as predicted by sequence homology). Sites and consequences of bothmg360andft7mutations are shown.
(B) Multiple-species alignment of conserved, C-terminal region where
mg360 allele substitution is found. Asterisk denotes the mutated residue.
(C) Expression pattern of rescuinglpo-6promoter fused to GFP in adult animal. Note exclusively intestinal expression pattern, with the exception of I1 interneuron. Image results from merge of fluores-cence and DIC channels.
(D) Expression pattern of rescuinglpo-6promoter fused to GFP in early larval animal. Note both intestinal (I) and hypodermal (H) expression. Image results from merge of fluorescence and DIC channels.
(E) Expression of rescuing lpo-6 promoter fused to GFP in I1 interneuron. Image results from merge of fluorescence and DIC channels. Neuron was identified as I1 due to the position of the cell body and a projection crossing the pharynx and extending anterior on the side opposite the cell body.
Found at doi:10.1371/journal.pbio.1000060.sg001 (3.26 MB PDF).
Figure S2.Increased-Fat Phenotype ofCeRictorMutants Is Confirmed by Other Lipid Staining Methods and Is Not Due to Developmental Timing
(A) Images of fatty acid-conjugated BODIPY staining in adult wild type,lpo-6(mg360) andlpo-6(ft7) strains. Representative images are shown.
(B) Images of Sudan Black B staining in wild type,lpo-6(mg360) and
lpo-6(ft7) strains. Sudan Black staining is generally less sensitive than Nile Red and Bodipy-conjugated fatty acids in detecting fat stores. Because of the variability of Sudan Black staining, we previously devised a protocol [50] allowing for pairwise comparison between strains stained within the same tube. Thus, representative images of wild-type and test animals from each experiment are shown. (C) Comparison of fat accumulation as detected by Nile Red staining insgk-1andCeRictormutants. All strains were allowed to grow for the same amount of time after synchronized hatching by hypochlorite treatment of parents. Differences in developmental timing were not corrected. Mean fluorescence intensity is reported as a percentage of the mean for wild-type animals (error bars indicate s.e.m.). Asterisk indicatesp-value,0.05 (wild type versus mutant, two-tailedt-test,n¼ 5–6).
Found at doi:10.1371/journal.pbio.1000060.sg002 (845 KB PDF).
Figure S3. Two-Generation lst-8 RNAi Results in Fat and Size Phenotypes Similar toCeRictorMutants
(A) Representative images of control- and RNAi-treated animals
(adult stage) stained with Nile Red. Note an increase in fluorescence intensity and an increase in lipid particle size, similar to what was noted withlpo-6mutants.
(B) Quantification of body size. RNAi value reported as mean size as a percentage of mean for control treatment (error bars indicate s.e.m.). Double asterisk indicatesp-value,0.01 (control versus RNAi, two-tailedt-test,n¼10). Note that body size of RNAi-treated animals is nearly identical to that oflpo-6(ft7) mutants (see also Figure 1D). Found at doi:10.1371/journal.pbio.1000060.sg003 (714 KB PDF).
Figure S4.Molecular Cloning ofsgk-1 (ft15) and Epistasis Analyses withlpo-6(ft7)
(A) Schematic representation of CeSGK-1, showing to scale its conserved domains, putative phosphorylation sites (TM¼turn motif and HM¼hydrophobic motif), and location and consequence offt15
mutation.
(B) Multiple-species alignment of conserved region whereft15allele substitution is found. Asterisk denotes the mutated residue. (C) Quantification of body size. Values reported as mean size as a percentage of mean for wild-type animals (error bars indicate s.e.m.). Double asterisk indicates p-value ,0.01 (wild type versus mutant strain orlpo-6(ft7) vs.lpo-6(ft7);sgk-1(gf), two-tailedt-test,n¼10). In all panels,sgk-1(gf) refers to thesgk-1(ft15) allele.
(D) Quantification of Nile Red staining. Mean fluorescence intensity is reported as a percentage of the mean for wild-type animals (error bars indicate s.e.m.). Double asterisk indicates p-value,0.01 (wild type versus mutant, two-tailedt-test,n¼5–8).lpo-6(ft7);sgk-1(gf) does not differ significantly fromlpo-6(ft7) orsgk-1(gf) (p-values¼0.39 and 0.07, respectively).
Found at doi:10.1371/journal.pbio.1000060.sg004 (817 KB PDF).
Acknowledgments
We thank members of the Ashrafi lab for helpful discussions, expert technical assistance, and a critical reading of this manuscript. We thank theCaenorhabditisGenomic Center, Dr. Shohei Mitani and the National BioResource Project, Dr. Patrick Hu, and the Kenyon lab for strains. Thelpo-6(mg360) allele was isolated by KA in the laboratory of Dr. Gary Ruvkun. We also thank Morris Feldman and Kevan Shokat for sharing data and a critical reading of this manuscript.
Author contributions. KTJ and KA conceived and designed the experiments. KTJ performed the experiments. KTJ analyzed the data. ERG contributed reagents/materials/analysis tools. KTJ, DP, and KA wrote the paper.
Funding.KTJ and ERG were supported by predoctoral fellowships from the National Science Foundation and American Heart Association, respectively. KA was supported by a Career Award from the Burroughs Wellcome Fund and a Searle Scholar Award from the Kinship Foundation. This work was funded by grants from the National Institutes of Diabetes and Digestive and Kidney Diseases (RO1DK070149) and a Sandler grant in Basic Research to KA. The funders had no role in study design, data collection and analysis, decision to publish, or preparation of the manuscript.
Competing interests.The authors have declared that no competing interests exist.
References
1. Wullschleger S, Loewith R, Hall MN (2006) TOR signaling in growth and metabolism. Cell 124: 471–484.
2. Tsang CK, Qi H, Liu LF, Zheng XF (2007) Targeting mammalian target of rapamycin (mTOR) for health and diseases. Drug Discov Today 12: 112–124. 3. Loewith R, Jacinto E, Wullschleger S, Lorberg A, Crespo JL, et al. (2002) Two TOR complexes, only one of which is rapamycin sensitive, have distinct roles in cell growth control. Mol Cell 10: 457–468.
4. Hara K, Maruki Y, Long X, Yoshino K, Oshiro N, et al. (2002) Raptor, a binding partner of target of rapamycin (TOR), mediates TOR action. Cell 110: 177–189.
5. Kim DH, Sarbassov DD, Ali SM, King JE, Latek RR, et al. (2002) mTOR interacts with raptor to form a nutrient-sensitive complex that signals to the cell growth machinery. Cell 110: 163–175.
6. Price DJ, Grove JR, Calvo V, Avruch J, Bierer BE (1992) Rapamycin-induced inhibition of the 70-kilodalton S6 protein kinase. Science 257: 973–977. 7. Chung J, Kuo CJ, Crabtree GR, Blenis J (1992) Rapamycin-FKBP specifically
blocks growth-dependent activation of and signaling by the 70 kd S6 protein kinases. Cell 69: 1227–1236.
8. Beretta L, Gingras AC, Svitkin YV, Hall MN, Sonenberg N (1996) Rapamycin blocks the phosphorylation of 4E-BP1 and inhibits cap-dependent initiation of translation. EMBO J 15: 658–664.
9. Heitman J, Movva NR, Hall MN (1991) Targets for cell cycle arrest by the immunosuppressant rapamycin in yeast. Science 253: 905–909.
10. Bentzinger CF, Romanino K, Cloetta D, Lin S, Mascarenhas JB, et al. (2008) Skeletal muscle-specific ablation of raptor, but not of rictor, causes metabolic changes and results in muscle dystrophy. Cell Metab 8: 411–424. 11. Polak P, Cybulski N, Feige JN, Auwerx J, Ruegg MA, et al. (2008) Adipose-specific knockout of raptor results in lean mice with enhanced mitochon-drial respiration. Cell Metab 8: 399–410.
12. Kumar A, Harris TE, Keller SR, Choi KM, Magnuson MA, et al. (2008) Muscle-specific deletion of rictor impairs insulin-stimulated glucose trans-port and enhances Basal glycogen synthase activity. Mol Cell Biol 28: 61–70. 13. Shiota C, Woo JT, Lindner J, Shelton KD, Magnuson MA (2006) Multiallelic disruption of the rictor gene in mice reveals that mTOR complex 2 is essential for fetal growth and viability. Dev Cell 11: 583–589.
14. Guertin DA, Stevens DM, Thoreen CC, Burds AA, Kalaany NY, et al. (2006) Ablation in mice of the mTORC components raptor, rictor, or mLST8 reveals that mTORC2 is required for signaling to Akt-FOXO and PKCalpha, but not S6K1. Dev Cell 11: 859–871.
16. Hietakangas V, Cohen SM (2007) Re-evaluating AKT regulation: role of TOR complex 2 in tissue growth. Genes Dev 21: 632–637.
17. Lee G, Chung J (2007) Discrete functions of rictor and raptor in cell growth regulation in Drosophila. Biochem Biophys Res Commun 357: 1154–1159. 18. Sarbassov DD, Guertin DA, Ali SM, Sabatini DM (2005) Phosphorylation and regulation of Akt/PKB by the rictor-mTOR complex. Science 307: 1098–1101.
19. Carnero A, Blanco-Aparicio C, Renner O, Link W, Leal JF (2008) The PTEN/PI3K/AKT signalling pathway in cancer, therapeutic implications. Curr Cancer Drug Targets 8: 187–198.
20. Ikenoue T, Inoki K, Yang Q, Zhou X, Guan KL (2008) Essential function of TORC2 in PKC and Akt turn motif phosphorylation, maturation and signalling. EMBO J 27: 1919–1931.
21. Facchinetti V, Ouyang W, Wei H, Soto N, Lazorchak A, et al. (2008) The mammalian target of rapamycin complex 2 controls folding and stability of Akt and protein kinase C. EMBO J 27: 1932–1943.
22. Jacinto E, Facchinetti V, Liu D, Soto N, Wei S, et al. (2006) SIN1/MIP1 maintains rictor-mTOR complex integrity and regulates Akt phosphor-ylation and substrate specificity. Cell 127: 125–137.
23. Alessi DR, Andjelkovic M, Caudwell B, Cron P, Morrice N, et al. (1996) Mechanism of activation of protein kinase B by insulin and IGF-1. EMBO J 15: 6541–6551.
24. Aronova S, Wedaman K, Aronov PA, Fontes K, Ramos K, et al. (2008) Regulation of ceramide biosynthesis by TOR complex 2. Cell Metab 7: 148– 158.
25. Kamada Y, Fujioka Y, Suzuki NN, Inagaki F, Wullschleger S, et al. (2005) Tor2 directly phosphorylates the AGC kinase Ypk2 to regulate actin polarization. Mol Cell Biol 25: 7239–7248.
26. Jacinto E, Loewith R, Schmidt A, Lin S, Ruegg MA, et al. (2004) Mammalian TOR complex 2 controls the actin cytoskeleton and is rapamycin insensitive. Nat Cell Biol 6: 1122–1128.
27. Ashrafi K, Chang FY, Watts JL, Fraser AG, Kamath RS, et al. (2003) Genome-wide RNAi analysis of Caenorhabditis elegans fat regulatory genes. Nature 421: 268–272.
28. Ho HL, Shiau YS, Chen MY (2005) Saccharomyces cerevisiaeTSC11/AVO3 participates in regulating cell integrity and functionally interacts with components of the Tor2 complex. Curr Genet 47: 273–288.
29. Mak HY, Nelson LS, Basson M, Johnson CD, Ruvkun G (2006) Polygenic control of Caenorhabditis elegans fat storage. Nat Genet 38: 363–368. 30. McKay RM, McKay JP, Avery L, Graff JM (2003) C elegans: a model for
exploring the genetics of fat storage. Dev Cell 4: 131–142.
31. Long X, Spycher C, Han ZS, Rose AM, Muller F, et al. (2002) TOR deficiency in C. elegans causes developmental arrest and intestinal atrophy by inhibition of mRNA translation. Curr Biol 12: 1448–1461.
32. Jia K, Chen D, Riddle DL (2004) The TOR pathway interacts with the insulin signaling pathway to regulate C. elegans larval development, metabolism and life span. Development 131: 3897–3906.
33. Suzuki Y, Yandell MD, Roy PJ, Krishna S, Savage-Dunn C, et al. (1999) A BMP homolog acts as a dose-dependent regulator of body size and male tail patterning in Caenorhabditis elegans. Development 126: 241–250. 34. Daniels SA, Ailion M, Thomas JH, Sengupta P (2000) egl-4 acts through a
transforming growth factor-beta/SMAD pathway in Caenorhabditis elegans to regulate multiple neuronal circuits in response to sensory cues. Genetics 156: 123–141.
35. Fujiwara M, Sengupta P, McIntire SL (2002) Regulation of body size and
behavioral state of C. elegans by sensory perception and the EGL-4 cGMP-dependent protein kinase. Neuron 36: 1091–1102.
36. Raizen DM, Cullison KM, Pack AI, Sundaram MV (2006) A novel gain-of-function mutant of the cyclic GMP-dependent protein kinase egl-4 affects multiple physiological processes in Caenorhabditis elegans. Genetics 173: 177–187.
37. Yoshida S, Morita K, Mochii M, Ueno N (2001) Hypodermal expression of Caenorhabditis elegans TGF-beta type I receptor SMA-6 is essential for the growth and maintenance of body length. Dev Biol 240: 32–45.
38. Krishna S, Maduzia LL, Padgett RW (1999) Specificity of TGFbeta signaling is conferred by distinct type I receptors and their associated SMAD proteins in Caenorhabditis elegans. Development 126: 251–260. 39. Maduzia LL, Gumienny TL, Zimmerman CM, Wang H, Shetgiri P, et al.
(2002) lon-1 regulates Caenorhabditis elegans body size downstream of the dbl-1 TGF beta signaling pathway. Dev Biol 246: 418–428.
40. Morita K, Flemming AJ, Sugihara Y, Mochii M, Suzuki Y, et al. (2002) A Caenorhabditis elegans TGF-beta, DBL-1, controls the expression of LON-1, a PR-related protein, that regulates polyploidization and body length. EMBO J 21: 1063–1073.
41. Avery L (1993) The genetics of feeding in Caenorhabditis elegans. Genetics 133: 897–917.
42. Sale EM, Sale GJ (2008) Protein kinase B: signalling roles and therapeutic targeting. Cell Mol Life Sci 65: 113–127.
43. Paradis S, Ruvkun G (1998) Caenorhabditis elegans Akt/PKB transduces insulin receptor-like signals from AGE-1 PI3 kinase to the DAF-16 transcription factor. Genes Dev 12: 2488–2498.
44. Hertweck M, Gobel C, Baumeister R (2004) C. elegans SGK-1 is the critical component in the Akt/PKB kinase complex to control stress response and life span. Dev Cell 6: 577–588.
45. Lee S, Comer FI, Sasaki A, McLeod IX, Duong Y, et al. (2005) TOR complex 2 integrates cell movement during chemotaxis and signal relay in Dictyostelium. Mol Biol Cell 16: 4572–4583.
46. Garcia-Martinez JM, Alessi DR (2008) mTOR complex 2 (mTORC2) controls hydrophobic motif phosphorylation and activation of serum- and glucocorticoid-induced protein kinase 1 (SGK1). Biochem J 416: 375–385. 47. McCormick JA, Feng Y, Dawson K, Behne MJ, Yu B, et al. (2004) Targeted
disruption of the protein kinase SGK3/CISK impairs postnatal hair follicle development. Mol Biol Cell 15: 4278–4288.
48. Wulff P, Vallon V, Huang DY, Volkl H, Yu F, et al. (2002) Impaired renal Na(þ) retention in the sgk1-knockout mouse. J Clin Invest 110: 1263–1268. 49. Brenner S (1974) The genetics of Caenorhabditis elegans. Genetics 77: 71–94. 50. Srinivasan S, Sadegh L, Elle IC, Christensen AG, Faergeman NJ, et al. (2008) Serotonin regulates C. elegans fat and feeding through independent molecular mechanisms. Cell Metab 7: 533–544.
51. Husson SJ, Janssen T, Baggerman G, Bogert B, Kahn-Kirby AH, et al. (2007) Impaired processing of FLP and NLP peptides in carboxypeptidase E (EGL-21)-deficient Caenorhabditis elegans as analyzed by mass spectrometry. J Neurochem 102: 246–260.
52. Timmons L, Fire A (1998) Specific interference by ingested dsRNA. Nature 395: 854.
53. Kamath RS, Fraser AG, Dong Y, Poulin G, Durbin R, et al. (2003) Systematic functional analysis of the Caenorhabditis elegans genome using RNAi. Nature 421: 231–237.