* Corresponding author.
E-mail addresses: [email protected] (M Mansourdehghan) © 2012 Growing Science Ltd. All rights reserved.
doi: 10.5267/j.msl.2012.12.008
Contents lists available at GrowingScience
Management Science Letters
homepage: www.GrowingScience.com/msl
Risks identification and ranking using AHP and group decision making technique: Presenting “R index”
Safar Fazlia and Mehrdad Mansourdehghanb*
a
Assistant professor of Imam Khomeini International University, Qazvin, Iran bMA student of Management, Imam Khomeini International University, Qazvin, Iran C H R O N I C L E A B S T R A C T
Article history: Received July 25, 2012 Accepted October 10, 2012 Available online December 8 2012
One of the primary concerns in project development is to detect all sorts of risks associated with a particular project. The main objective of this article is to identify the risks in the construction project and to grade them based on their importance on the project. The designed indicator in this paper is the combinational model of the Analytical Hierarchal Process (AHP) method and the group decision – making applied for risks measurement and ranking. This indicator is called "R" which includes three main steps: creating the risks broken structure (RBS), obtaining each risk weight and efficacy, and finally performing the model to rank the risks. A questionnaire is used for gathering data. Based on the results of this survey, there are important risks associated with construction projects. There we need to use some guidelines to reduce the inherent risks including recognition of the common risks beside the political risks; suggestion of a simple, understandable, and practical model; and using plenty of the experts and specialists' opinions through applying step. After analyzing data, the final result from applying R index showed that the risk “economic changes / currency rate and inflation change" has the most importance for the analysis. In the other words, if these risks occur, the project may face with the more threats and it is suggested that an organization should centralize its equipment, personnel, cost, and time on the risk more than ever. The most obvious issue in this paper is a tremendous difference between an importance of the financial risks and the other risks.
© 2013 Growing Science Ltd. All rights reserved. Keywords:
Risk, Prediction Risk identification Risk importance R index Risk ranking
1. Introduction
Risk happens when a condition or an event has a negative or positive effect on objectives of project when it happens (Project Risk Management Handbook, 2007). The risk can be manageable, transferable, acceptable or reducible, but it is not often possible to be eliminated (Lam et al., 2007). Risk occurs in construction project and it includes different factors including political, economic, culture, commercial and technical, which may be as the result of government employer and/or contractor (Khazaeni et al., 2012).
It is often difficult to find construction project risks and hence should be managed, properly. Therefore, successful project manager is the person who determines natural project features and controls riskiness in project, properly. Risk management is an effectual tool in order to respond and to control a risk and we can called it as a systematic process in determining, analyzing and responding to project risks to increase positive result and to decrease negative consequences (Newton, 2008). The first step before a project is initiated is to make an assessment in project risk components (Makoei et al., 2007). Some experts believe that the most difficult part of risk management process is to determine risk components, because if the risk cannot be determined, the next steps will be ineffective (Burkeh, 1999). It is evident that many risks could be identified in this step, but risk identification is not sufficient, because project managers often require classifying risk based on their relative importance and their impacts on project, therefore the primary objective on risk will be based on their premierships in the next steps of risk management, which leads to better risk management. Many traditional methods have been introduced to identify and to classify risk components (Makoei et al., 2007), which could not cover restrict and steps of risk management process required enough attention and precision. Therefore, the modern techniques are based on group decision-making and using specialize and expert’s experiments and supervision.
The method used in this paper uses hierarchal analysis and group decision-making for risk classification. The primary goal of this paper is to identify risks in the construction project and their premiership based on their relative importance in the project. In the next part of paper, first we consider research literature. Then research method and considered indicators will be described and the following, the indicator will be applied on a real project and analyzed. Finally, managerial suggestions and conclusion will be presented.
2. Theoretical framework of research and offering conceptual model
It is often necessary to find the root for different risk components associated with various projects (Chapman, 2006). Risk identification is a key phase of risk management (Ibrahim et al., 2006), hence several researchers have analyzed risk and its source and the common point of these researches is to focus the risk identification. Because of the fact that risk cannot be identified a head of time, project managers often try to find risks over a time (Jiahao Zeng et al., 2007).
decision-making methods in ranking and identifying risk components. They argued that the issues associated with decision risks could be considered in the area of multi criteria decision making. However, their work did not have enough validity and justifiability to be used in practice because the researchers used TOPSIS method, which suffers from some disadvantage. Sebastian Maniasi et al. (2006) worked on the numeral taxonomy for risk identification where risk identification cycle includes a check-list, which classifies the risk in different classes in structured form.They offered a new model for risk identification and for risk classification in different classes and increased reliability level in risk identification and implied an acceptable justifiability among variables. Nevertheless, there is not a complete definition for model and, in fact, this model was not designed for all kinds of organizations. Long and Fischhoff (2000) introduced a model for identification and classification of important aspects of risks in various industries. According to researcher’s opinions, this model helps rank risk component in term of certain condition and in diverse positions. One of the advantages of this model is to classify risks based on their nature and essence of risky activities in any project. In addition to risk, identification can define strategies alternatives for each risk scenario. Any organization with any structure can apply this model to classify risk. However, specialist and experts' opinions are not used for risk identification and risk analysis.
Daniel (2011) tried to identify and rank key factors or risk with the help of gathered data from experts and specialists in the industry of construction project in Hong Kong. The paper offered a 4-level analysis framework including statistical definition, Kendall test, Spearman test, and Mann-Whitney test. Researchers found that client, contractors and consultant have some participation in several factors of risk creation in the construction projects. The advantage is that we have better and knowledge trend and view towards construction project and its costs and relevant risk and attempt to control and respond to high level risk and it takes advantage of experts and specialists' supervision. Regarding the mentioned studies in the field of risk identification and risk gradation, we can introduce a model, which not only is public, simple and understandable for managers in project-centered organization, but also it maintains appropriate, reliable and justifiable approach in terms of tools used based on experts and specialists' opinions. This model has designed for measurement and gradation of construction project risk. In other words, we can offer a model while measures risks based on expert’s ideas and projects feature and identify theme (Webb Alan, 2003). The emphasis of this is on one main question that how organization can classify risks based on their influences an project, by identifying and comparing risk.
3. Research methodology
3.1 Introductions of project and experts
3.1.1 Introduction of experts
In this research, we gather some experts' insights who have been involved for development of different projects. Table 1 shows details of the experts' management positions.
Table 1
Experts' backgrounds
Specialist Project manager
Senior Construction engineer
Senior Financial engineer
Senior Designer
Senior Civil engineer
Numbers 1 2 2 2 3
3.1.2 Introduction of project
in this region because of tits nearness to the capital. Due to combinational cycle nature of this powerhouse and also its unique production capacity, energy return has increased through different phases of production and this matter is especial advantage of this project. This powerhouse return is 50 percent, which is the largest amount among the thermal powerhouse of country. Referring to the fact that operational activities extent of project did not make it possible for the researches to operate that project in the research standard, hence through consulting with experts, these kinds of decisions were made as part of a greater project, which would be considered as completely independent project. Therefore, the project we considered in this research is to project an industrial workshop at project site, in which an attempt is to classify and rank existing risk on project.
3.2 Offering model and procedure of obtaining results
In this paper, the method used for risk identification includes three main steps: (1) a step of listing different kinds of probable risk in construction projects, (2) a step of obtain each risk weight and efficacy and (3) a step of operation “R index” in order to rank risks. We will analyze each of these steps in details.
3.2.1 First step: creation of hierarchal structure of risk
In this step, the most important risk, which may occur in construction project, are listed to be used in the questionnaires sent to experts for weighting and scoring. The method of risk broken structure (RBS) should be introduced before listing the risks. This method is an effective tool to classify the risks, which in fact, shows a hierarchal structure of project risk. The other advantage of risk fail is to help managers understand how to distribute risks through different phases of a project. Therefore, the risks in this part are classified based on the hierarchal structure.
3.2.2 Second step: obtaining risk weighed and efficacy
In this step, each risk weighted and efficacy should be determined by using questionnaires. The processes are in this way that first each risk efficacy in project should be determined. Efficacy means that according to expert and specialists' opinion, the scores of the mentioned risk are obtained in terms of their influences on project. Then each risk weighted should be defined in the next step. In this step, the multi-criteria decision-making method is used to do pair comparison among risk. In this phase, the risks are compared in pairs to determine their relative importance and then they are analyzed by Analytical Hierarchal Process (AHP) to finally determine the weight of each risk. The following section presents the necessary steps of obtaining risk efficacy and weights by the AHP.
3.2.2.1 Obtaining efficacy (Risk identification):
The Likert’s 5-scale has been used to obtain risks efficacy. This spectrum is in duded fire point: very low, low, mean, high and very high shown in Fig. 1.
Fig.1. Likert’s 5-scale spectrum
There are some questions, which need to be asked from experts in the questionnaire: "which score the
risk X will obtain in term of influence amount on different aspects of project? ". Because this
questionnaire has been verified, hence they should be analyzed in terms of reliability and SPSS software has been used for calculating Cronbach alpha. In this step after calculating Alpha coefficient of a questionnaire to achieve an acceptable reliability and eliminating the risk which lead to unequal result in different condition. The remained risks are considered as identified risks. Here after, the reminder risks is called the project risks. Then the arithmetic means from project risks is calculated
Very low
Low HighMean Very High
and figure resulted from mean is the risk efficacy that is shown by indicators
E
k.kis indicator of riskand Eis indicator of efficacy.
3.2.2.2 Obtaining risk weights
After determining efficacy of each project risks, their weight should be defined. The questionnaire is also used to do this and the questionnaire like following has asked in terms of pair comparison among
risks: “How much influence and impotence has the risk X in analysis in comparison with the risk Y?”.
In contrast with pair comparison, this one is sent to industry experts and because this questionnaire is a pair comparison, there is no need to calculate reliability of questionnaire, but its inconsistency rate must be estimated. The pair comparison among risk has been done already, which we cannot yet determine their weights. To do that, we use AHP and examine them by Super Decision software. The AHP has introduced by Satty and makes it possible to have a judgment between intangible qualitative scales and tangible quantitative ones (Badri, 2001). This analysis first divides the decision making process into a hierarchal structures of alternatives and scales. The decision-making scales, goals and alternatives are combined altogether in one hierarchal structure like organizational structure. The standard AHP has three levels including 1-total goal of issue, 2- multiple scales and 3- decision-maker alternatives. In each level, the items are compared in pair based on their influence levels and special scales high levels (Albayrak & Erensal, 2004). In this paper, the RBS implies the hierarchal tree for ranking and measurement of project risks. Then pair comparison among scales and alternatives should be individually done. If we suppose that we want to compare two risks A and B, the pair comparison based on the Satty’s 9-potins spectrum are as shown in Table 2.
Table 2
Satty’s AHP 9 point pairwise comparison scale
Explanation Value
Two risks contribute equally to the objective. 1
Experience and judgment moderately favor Risk A over Risk B. 3
Experience and judgment strongly favor Risk A over Risk B. 5
Risk A is strongly favored over Risk B. 7
The evidence favoring Risk A over Risk B is of the highest possible order of affirmation. 9
Between the odd numbered relative values. 2,4,6,8
If we considerKas a number of project risks and{Kj =1, 2,..., }N , then matrix of pair comparison for
Nrisk is likes Eq. (1) in which every element of aij ={ ,i j=1, 2,..., }n is comparison ratio of risk iinto
risk j.
11 12 1
21 22 2
1 2
1, 1/ , 0
n
n ii ij ij ij
n n nn
a a a
A a a a a a a a
a a a
⎡ ⎤
⎢ ⎥
⎢ ⎥
⎢ ⎥
= = = ≠
⎢ ⎥
⎢ ⎥
⎢ ⎥
⎣ ⎦
K K
M M M
K K
M M M
K K
(1)
In Eq. (1), aijindicates importance and influence of risk iinto risk jin the project.
3.2.3 Third step: using “R index” for risk ranking
As we can observe, each risk weight and efficacy was obtained in prior step. In this step, we can
apply “R index”. The designed indicator in this study is a constant and trustworthy method for risk
called “R index” for measuring and ranking risks in projects, which has two parts. One part is risk
efficacy and the other is risk weights which are shown by
E
kandW
k, alternatively and kindicates arisk number. Finally, R index for each risk will be calculated by Eq. (2), through combining questionnaires data.
,
k k k
R
= ×
E
W
(2)where R means how much the risk has relative importance in analysis, so a risk has higher score, has higher premiership.
4. Research results
In this section, we analyze the research results in accordance with methodology steps that are the sequence of data gathering and their analysis according to said steps in research methodology.
4.1 Creating the hierarchal structure of risks
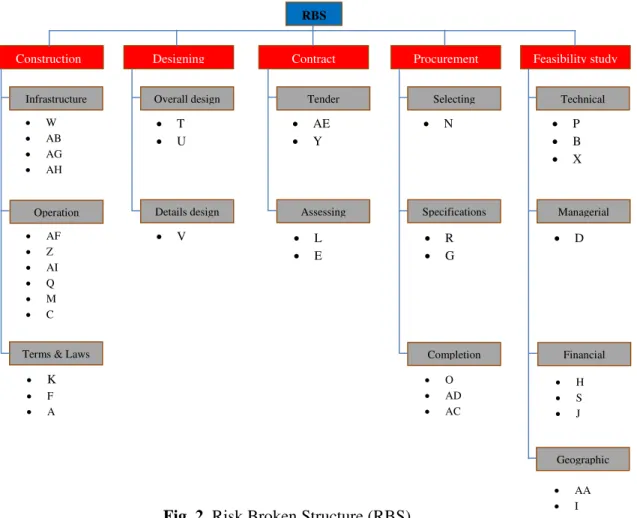
First, all potential risks for project were defined in a hierarchal structure by RBS. So clearer image we obtained from all existing risk. In this paper, RBS levels and probable risk were classifying by managers. As it is determined in Fig. 2, 35 risks have predicted for project, which has classified into five categories.
Fig. 2. Risk Broken Structure (RBS)
In this structure, the most probable project risks has been divided into five areas (Feasibility study, Procurement, Contract, Designing and Construction) where each has a subarea. Most of the risks are in construction areas and in operational and financial subarea. Only few of them are in designing and
Infrastructure
• W • AB • AG • AH
Operation
• AF • Z • AI • Q • M • C
Terms & Laws
• K
• F • A
Overall design
• T
• U
Details design
• V
Tender
• AE
• Y
Assessing
• L
• E
Selecting
• N
Specifications
• R
• G
Completion
• O
• AD
• AC
RBS
Feasibility study
Contract Procurement
Designing Construction
Technical
• P
• B
• X
Managerial
• D
Financial
• H • S • J
Geographic
contract areas. A main question for project management team was that “how the risk analysis is ranked and how events result from it, are contracted and prevented”. An importance of this case is completely clear. Since the goal of organization is cost and time saving through risk analyses, in addition to prevent the effects of negatives events in project the most important and primary risks would be chosen among identified risk for analysis. It is better to consider one concise mark for each risk and offer better image for them, before calculating risks weight and efficacy. All of the probable risks for project have been listed in Table 3.
Table 3
List of Risk and its symbol
Risk Symbol
Picket and strikes A
Inappropriate technology B
One of the parties’ bankrupting C
Management Weaknesses D
Political Considerations in Contractors assessing E
Changes in local and state laws F
Incorrect estimation of Amount of material needed G
Incorrect estimating of sponsor’s financial ability H
Insecurity Project Zone I
Change in tax rate J
Political events K
Lack of appropriate metrics for Contractors assessing L
Financial misuse M
Lack of appropriate metrics for Suppliers assessing N
Incorrect Scheduling of raw material supply O
unavailability of labor P
Delay in bill payment by employer Q
Partial transfer specification to suppliers R
Economic changes / change of interest rate, currency and economic inflation S
Inappropriate Design Technology T
Improper Project design U
Error in transfer overall design into Detailed design V
Poor planning system W
Ignoring the technology’s price X
Incorrect estimation of activities cost Y
machinery and equipment impairment Z
Ignoring the project’s environmental conditions AA
Poor informational system AB
Material failure AC
Delays in transporting raw materials AD
Incorrect estimation of activities time AE
Poor weather conditions AF
Weakness in the payroll system AG
No specific relationships AH
4.2 Obtaining efficacy (Risk identification):
For applying “R index”, first we should determine risks efficacy. So a questionnaire was distributed among 37 experts of whom 27 experts returned their questionnaires. Since the number of questionnaires was below 30, so their reliability should be estimated. To calculate questionnaire reliability, Cronbach alpha should be calculated by SPSS software. Table 4 is a summary alpha calculations and elimination of risk which may increase it.
Table 4
Eliminated Risks by Calculating Cronbach Alpha
Iteration Eliminated Risk Alpha,
before elimination
Alpha,
after elimination Remained Risks
First N 0.469 0.522 34
Second AB 0.522 0.554 33
Third D 0.554 0.579 32
Fourth W 0.579 0.606 31
Fifth U 0.606 0.626 30
Six L 0.626 0.639 29
Seven R 0.639 0.654 28
Eighth T 0.654 0.668 27
Ninth V 0.668 0.685 26
Tenth O 0.685 0.697 25
Eleventh B 0.697 0.708 24
It is necessary to note that risks elimination was stopped when Cronbach alpha amount was 0.7. As it shown in Table 4, eliminated risks increased Cronbach alpha coefficient. So we continue with 24 remained risks. Then obtained results of alternatives relating to an efficacy amount of the reminded risks, were gathered and arithmetic mean has been considered for each risk. Finally, the results from expert’s ideas about the remained risks efficacy have been shown in Table 5.
Table 5
Calculated Risk’s Efficacy
Risk Efficacy
Score
Risk Efficacy
Score
Risk Efficacy
Score
A 2.89 K 3.07 AA 2.81
C 3.30 M 3.26 AC 2.85
E 3.07 P 2.59 AD 2.00
F 3.22 Q 3.41 AE 3.19
G 2.89 S 3.56 AF 3.00
H 3.37 X 3.11 AG 2.78
I 2.74 Y 3.33 AH 3.11
J 2.81 Z 2.56 AI 3.11
The results of Table 5 show that the risk “economic changes / change of interest rate, currency and economic inflation” has high importance from of view of all persons involved in project management team. In other word, if this risk occurs in project, the project may confront with the most threat.
4.3 Obtaining risk weights:
comparison to each other are gathered and an arithmetic mean is calculated for each pair comparison. The final data of pair comparison among risks are shown in Appendix in Table (A.1). Table (A.1) shows the pair comparison among risks and finally after doing the hierarchal analysis in super decision software, risks weights were obtained which is shown in Table 6.
Table 6
Calculated Risk’s weight by Super Decision Software
Risk Weight Risk weight Risk weight
A 0.028 K 0.025 AA 0.029
C 0.033 M 0.027 AC 0.030
E 0.022 P 0.026 AD 0.028
F 0.027 Q 0.120 AE 0.027
G 0.027 S 0.124 AF 0.029
H 0.104 X 0.028 AG 0.026
I 0.024 Y 0.115 AH 0.023
J 0.023 Z 0.027 AI 0.028
4.4 Using “R index” for risk ranking:
In previous steps, each risk weight and efficacy was obtained. In this section “R index” introduced methodology step is applied on each risk to determine an indicator for risk ranking in accordance with each of them. After applying “R index” for each risk, final ranking was obtained which is shown in Table 7.
Table 7
Calculating “R index” for each Risk
Risk Efficacy Weight R index Priority / Rank
A 2.89 0.028 0.0809 14
C 3.30 0.033 0.1089 5
E 3.07 0.022 0.0675 20
F 3.22 0.027 0.0869 9
G 2.89 0.027 0.0780 15
H 3.37 0.104 0.3505 4
I 2.74 0.024 0.0658 22
J 2.81 0.023 0.0646 23
K 3.07 0.025 0.0768 16
M 3.26 0.027 0.0880 6
P 2.59 0.026 0.0673 21
Q 3.41 0.120 0.4092 2
S 3.56 0.124 0.4414 1
X 3.11 0.028 0.0871 7
Y 3.33 0.115 0.3830 3
Z 2.56 0.027 0.0691 19
AA 2.81 0.029 0.0815 13
AC 2.85 0.030 0.0855 11
AD 2.00 0.028 0.0840 12
AE 3.19 0.027 0.0861 10
AF 3.00 0.029 0.0870 8
AG 2.78 0.026 0.0723 17
AH 3.11 0.023 0.0715 18
AI 3.11 0.028 0.0871 7
i i p a r t 5 I r o r c a f c a a a w s F o o A c f t W r e c c p implies that in project a project. The attempts to ranking, it i to anticipate
5. Discussio
In this resear risks were id other questio research was comparison w analysis or m factors by th comparison” analysis the p addition to th and Hendrick was more sim said indicato Finally, beca objections ab or problem w
At the end w considerable financial risk the economic
We could pr result sealed economic ris country and construction phases of po
0.00 0.05 0.10 0.15 0.20 0.25 0.30 0.35 0.40 0.45 0.50
t financial a and in the o
e firm expe offer som s suggested e and analyz
on and concl
rch, first in th dentified and oner and sof s that the m with other o may lead to p he help of and this im probable risk he political r kson (2001), mple and un rs by Sebast ause of usin bout non-just which was ob
we can conc convergenc ks, three of th
c issues of go
reviously cla d this claim
ks and the ot lack of eco project. Th ossibility me 00 50 00 50 00 50 00 50 00 50 00
A C E
and econom other words ected also t me proper d d to firm to c
ze situation
lusion
he meeting w d their effica ftware analy managers of
ones. Since paying attent this indicat mplies that hi ks of project risks examine
the common nderstandable
tian Maniasi ng many exp tifiability, les bvious in Lon
clude that th e between r hem were mo overnment an
Fig.
aim that the f and implie ther risks. Th onomic-polit herefore, it is
easurement,
E F G H
mic issues if s, consideri o confront device and choose one . with operation acies were o ysis, risks w project pay considering tion to less im tors, “the ef
igher scored t on this rank
ed by Ashley n risks were e than said i (2006), this perts’ opinio ss irrevocabl ng and Fisch
he difference risks. As see ostly depend nd country.
. 3. Histogra
financial and d that there he most impo tical relation s suggested
design, fin
I J K M
f project, are ing financia with the fi facilities to
risk among
nal consultan obtained by s eights' were y more atten
all risks ma mportant risk fficacy in p d risks have king and inte y and Bonne
also analyze indicator in J one introdu on through o le questionna hhoff's (2000)
e between ob en in Fig. 3, dent to the fir
ams of Risk
d economic e was a trem
ortant reason ns with prec that more an ancial issue
P Q S X
e the most i al issues is inancial risk o face with g 6 great ris
nt of project, sending first calculated. ntion to risk ay decrease ks. However project” and
more import ernal facilitie er (1987) and ed. In additio Jiahao Zeng uced a compl operating ste aire and less ) research.
btained score from 4 prim rm financial
k’s R index
risks are inv mendous dif n of this diffe cursor count nalysis are p s support, f
X Y Z AA A
important fa Achilles h k through o h such risk
ks in order
, 35 risks we t questionnai The primar ks while hav
efficiency a r, the risks w “risks weig tance for an es of their ow d financial ri
on, the offer ’s paper (20 lete definitio eps of this r using of exp
ed of risks s mary risks w issues and th
volved in the fference betw erence is lack try and orga performed by financial dem AC AD AE AF A
actors in oc eel in the c operating pr s. Regardin to simulate
ere identified ire. Then by ry objective ve higher im and effective were classifie
ghts as a re nalysis and m wn firm. In t
sks consider red indicator 007). Further on for risks id
research, the pert’s ideas,
showed that which all we
he other was
e important o ween the im k of econom anization in y project exp mand recove
AG AH AI
ccurring risk construction roject. So i ng achieved e project and
d and then the y sending the of operating mportance in eness of risk ed based on 2 esult of pai managers can
this paper, in red by Kapila in this study rmore, unlike dentification ere are fewe the objection
t there was a ere related to s depended to
ones, but the mportance o
ic stability in the field o perts through ery trend by
employer, and the most important of all, to have ability to offer the proper devices for confronting such risks through simulation of project situation.
Acknowledgements
The research was financed by Imam Khomeini International University of Ghazvin No. 751022-91. The authors gratefully acknowledge the financial support for this work.
Reference
Albayrak, E., & Erensal, Y.C. (2004). Using analytic hierarchy process (AHP) to improve human
performance. An application of multiple criteria decision making problem. Journal of Intelligent
Manufacturing, 15, 491–503.
Ashley, D.B., & Bonner, J.J. (1987). Political risks in international construction. ASCE Journal of
Construction and Engineering Management ,113(9), 447–467.
Badri, M.A. (2001). A combined AHP–GP model for quality control systems. International Journal
of Production Economics, 72, 27–40.
Burke, R. (2003). Project management Planning & Control Techniques.John Wiley & Sons; 4th ed.
Chapman, C. (2006). Key points of contention in framing assumptions for risk and uncertainty
management. International Journal of Project Management, 24(4), 303–313.
Daniel, W.M., Albert, P.C., Patrick, T.I., Lam, John F.Y. & Yeungb, J.H.L. (2011). Risk ranking and
analysis in target cost contracts: Empirical evidence from the construction industry. International
Journal of Project Management, 29(6), 751 –763.
Dias, A., Ioannou, P. (1995). A desirability model for the development of privately-promoted
infrastructure projects. Civil & Environmental Engineering Department, University of Michigan,
Ann Arbor, Michigan 48109-2125, U.S.A.
Khazaeni, G., Khanzadi, M., & Afshar, A. (2012). Fuzzy adaptive decision making model for
selection balanced risk allocation. International Journal of Project Management, 30(4), 511–522.
Jebel Ameli, M.S., Rezaeifar, A., & ChaeiBakhsh, A. (2005). Risk ranking with the multi-criteria
decision-making. Second International Conference on Project Management, Tehran, Iran.
Kapila, P., & Hendrickson, C. (2001). Exchange rate risk management in international construction
ventures. ASCE Journal of Construction Engineering Management, 17(4), 186–91.
Lam, K., Wang, D., Patricia, Y., & Tsang, T. (2007). Modeling risk allocation decision in
construction contracts. International Journal of Project Management, 25, 485-493.
Long., J., & Fischhoff, B. (2000). Setting Risk Priorities: A Formal Model. Risk Analysis, 20(3),
339-352.
Makoei, A., Mahdavi, I., & Farokhian, F. (2007). Appropriate allocation of risk to the contractor and
the employer. Fourth International Conference on Project Management, Tehran, Iran.
Makoei, A, & Mojtahedi, MH. (2007). New techniques are introduced and applied to identify project
risks. First International Conference on Risk Management, Tehran, Iran.
Maniasi, S., Britos, P., & García Martínez, R. (2006). A Taxonomy-Based Model for Identifying
Risks. Buenos Aires Institute of Technology.
Motawa, I.A., Anumba, C.J., & El-Hamalawi, A. (2006). A fuzzy system for evaluating the risk of
change in construction projects. Advances in Engineering Software, 37(9), 583–591.
Newtown, S. (2008). A Guide to the Project Management Body of Knowledge (PMBOK). American
National Standard ANSI/PMI 99-001.
Project Risk Management Handbook. (2003). Office of Project Management Process Improvement ,
First Edition, Revision 0, June 26.
Ralph, L. Kliem, I., & Ludin, S. (2010). Project Management Practitioner's Handbook. AMACOM
Publisher.
Zeng, J., An, M., & Smith, N.J. (2007). Application of a fuzzy based decision making methodology
to construction project risk assessment. International Journal of Project Management, 25, 589–
600.
Appendix
Table (A.1).
Pair comparison among risks, based on AHP
A C E F G H I J K M P Q S X Y Z AA AC AD AE AF AG AH AI
A 0.73 0.60 0.43 0.81 0.25 2.11 0.75 1.20 0.85 3.06 0.18 0.20 0.44 0.21 2.15 2.00 0.64 1.35 1.15 1.83 0.89 1.10 0.85
C 2.73 2.68 1.11 0.21 0.97 1.45 1.14 1.58 1.94 0.22 0.21 1.34 0.24 0.49 1.49 1.03 1.77 0.61 0.90 3.29 1.36 0.44
E 0.40 0.69 0.22 0.85 1.15 1.03 0.89 1.00 0.17 0.17 0.47 0.21 0.76 0.51 1.77 0.57 1.15 0.60 1.44 0.98 0.86
F 0.40 0.21 0.66 1.21 1.02 0.77 0.42 0.15 0.17 1.66 0.20 0.98 1.71 1.39 1.48 0.89 1.37 1.47 1.00 1.15
G 0.19 0.95 0.25 1.09 2.50 1.15 0.21 0.16 1.08 0.18 0.74 0.78 0.66 0.58 1.73 0.68 1.50 1.89 0.65
H 3.91 4.54 3.19 6.13 4.70 1.06 0.62 3.40 0.63 4.91 5.55 3.81 5.23 4.08 2.64 3.29 4.46 3.61
I 0.57 0.74 0.64 0.97 0.19 0.21 1.37 0.28 1.38 0.54 0.44 0.89 1.01 0.96 1.76 0.88 0.76
J 1.02 0.26 0.94 0.25 0.18 0.40 0.18 0.40 0.47 0.44 0.47 0.47 0.82 1.17 1.33 0.41
K 0.81 0.38 0.23 0.20 1.02 0.18 1.19 0.53 0.94 0.68 0.80 1.92 1.01 2.90 1.11
M 1.18 0.20 0.17 1.03 0.22 0.88 0.88 1.08 0.71 0.83 0.74 1.20 1.83 1.60
P 0.20 0.16 2.28 0.20 0.69 0.51 0.37 1.45 0.72 1.37 0.57 1.39 1.44
Q 0.97 3.72 0.83 4.52 6.51 5.91 4.95 6.32 3.95 4.15 5.88 3.60
S 5.07 1.97 3.31 4.72 3.46 4.63 5.22 3.84 3.52 4.01 4.77
X 0.19 1.71 0.49 0.57 1.03 0.89 0.43 0.89 0.42 0.90
Y 3.89 5.15 3.83 4.57 5.37 4.71 4.72 2.93 4.73
Z 0.56 1.00 0.32 1.10 0.60 0.95 0.91 2.21
AA 0.54 0.69 1.01 0.71 1.18 1.53 0.97
AC 0.83 1.46 0.34 0.59 0.72 1.23
AD 1.38 0.67 1.10 0.71 0.43
AE 0.81 1.36 2.78 1.30
AF 1.24 0.88 1.16
AG 2.94 1.55
AH 1.07