Journal of Information Systems and Technology Management
Vol. 5, No. 2, 2008, p. 347-364 ISSN online: 1807-1775
DOI: 10.4301/S1807-17752008000200008
_____________________________________________________________________________________
Recebido em/Manuscript first received: 28/12/2007 Aprovado em/Manuscript accepted: 06/04/2008
Endereço para correspondência/ Address for correspondence
Flávio Roberto Souza dos Santos, is currently working as a Consultant in Oracle do Brasil. He received
his MSc degree in Operations Management from Universidade de Campinas (UNICAMP). Email: [email protected]
Sandro Cabral, is a Visiting Professor and Research Fellow at the Federal University of Bahia (UFBA).
He has recently joined the University of São Paulo (FEA-USP) as a Professor in the Business Administration Department.He received his Ph.D. degree in Business Administration from UFBA (in collaboration with University of Paris1 Sorbonne). Email: [email protected]
ISSN online: 1807-1775
Publicado por/Published by: TECSI FEA USP – 2008
FMEA AND PMBOK APPLIED TO PROJECT RISK
MANAGEMENT
FMEA AND PMBOK APPLIED TO PROJECT RISK MANAGEMENT
Flávio Roberto Souza dos Santos Oracle do Brasil
Sandro Cabral
Federal University of Bahia (NPGA-UFBA) and University of São Paulo (FEA-USP), Brazil
_____________________________________________________________________________________
ABSTRACT
This paper presents a risk management tool based on two well-known sets of concepts: FMEA (Failure Mode and Effect Analysis) and PMBOK (Project Management Body of Knowledge). After presenting an adherence analysis between the suggested model and PMBOK, we apply the proposed instrument in a real case study: an ERP implementation at the largest Brazilian mail service and logistics organization. The main results show that the proposed model was largely successful because it identified and classified risks. Furthermore, the model helped to document the strategies and action plans needed to respond to these risks.
1. INTRODUCTION
The acquisition and implementation of a new technology normally require a huge effort from the organizations because they deal with factors such as complexity, innovation, scarce resources (both human and financial), and tight schedules, among others. These factors are important challenges and, in order to face them, it is usual for companies to implement new technologies as special projects.
The statistics concerning project success rates show that successful projects are not the rule. The Standish Group stated that out of the 30,000 Information Technology projects executed in the United States, nearly 63% run late and 49% cost more than the expected. The amounts involved in project failure reached roughly US$ 38 billion. On the other hand, success rates, in terms of schedule and budget, represent only 28% of the entire number of projects studied (HARTLEY, 2004). Thus, the development and implementation of successful project management methodologies, risk management mechanisms in particular, are cornerstones of successful new technology projects.
In the project management scenario, the Project Management Institute (PMI), a global community of 150,000 acting members in project management distributed across more than 150 countries, plays an important role. PMI works towards developing and disseminating best practices, carrying out research, offering training, testing and certification. Project management best practices are consolidated in a publication entitled Project Management Body of Knowledge (PMBOK). The third edition of PMBOK was published in 2004. Its contents cover the nine knowledge areas and processes of project management: integration, scope, time, costs, quality, human resources, communications, purchase and risk – the focus of this paper.
Concern regarding risk management is not new. In fact, some manufacturing experts have been using tools such as FMEA (Failure Mode and Effect Analysis) to identify possible failures in products and processes (SAKNAR and PRABHU, 2001; PALADY, 1997; US MILITARY STANDARD 1629A, 1980).
Combining two sets of techniques, FMEA and PMBOK risk management, we attempt to answer the following question: Could the risk management model of PMBOK be utilized with FMEA to create a new model for project risk management?
2. FMEA AND PMBOK: AN OVERVIEW
The process of acquiring and implementing new technologies usually requires considerable effort on the part of the organizations, as it involves factors such as complexity, scarce resources (both financial and human), and normally tight schedules. In order to face such difficulties, the process of new technology deployment is generally addressed through projects (DOOLEY, LUPTON & SULLIVAN, 2005). However, many of the projects fail at an astonishing rate (MATTA and ASHKENAS, 2003), i.e. they run behind schedule or incur unexpected costs. In order to avoid such scenarios, it is essential to establish risk management strategies (OLSSON, 2007).
The risk management methodology of the Project Management Institute (PMI) presented in the Project Management Body of Knowledge – PMBOK – is perhaps one of the most used technical developments for controlling risks. (PMI, 2004). Despite its dissemination throughout the world, we consider that there is some room for improvement towards a more structured device to manage risks. We believe that the well-known concepts of the Failure Mode and Effect Analysis (FMEA) might be complementary to PMBOK, giving rise to a new integrated framework for project risk management. Carbonne and Tippet (2004) point out that the FMEA method is a natural addition to the project risk management process due to its ease of use, familiar format, and a comprehensive structure.
The foundations of these techniques are briefly described.
2.1) FAILURE MODE AND EFFECT ANALYSIS (FMEA)
Failure Mode and Effect Analysis (FMEA) was first developed as a formal
design methodology in the 1960s by the aerospace industry with their obvious reliability and safety requirements (SANKAR and PRABHU, 2001). Later its use spread to other industries, such as the automotive and oil & gas (PALADY, 1997).
FMEA aims to identify and prioritize possible imperfections in products and processes (PUENTE et al., 2001). More precisely, FMEA can be defined as “the set of procedures by which each potential failure mode in a system is analyzed to determine the results or effects thereof on the system and to classify each potential failure mode according to its severity” (US MILITARY STANDARD 1629A, 1980. p. 4).
In the past few years, we have seen several deployments derived from FMEA analysis in order to quantify and analyze project risk issues. In this sense, Carbonne and Tippet (2004) have coined the expression RFMEA (Project Risk FMEA). The US Department of Defense incorporates into the existing FMEA framework a critical analysis obtaining the FMECA method (US MILITARY STANDARD 1629A, 1980). More recently, Bertolini et al (2006) presented a new methodological approach named ‘Dysfunction Mode and Effects Critical Analysis’ (DMECA) to determine and analyze possible dysfunctions in complex management processes.
In this paper, we focus on the classic FMEA and the following discrete steps are used to perform a FMEA (SANKAR and PRABHU, 2001; US MILITARY STANDARD 1629A, 1980):
Identify all potential failure modes (the manner by which a failure is observed) Estimate the severity of the failure mode
List the potential causes of the imperfection Estimate the frequency of occurrence of failure Describe failure detection method
Estimate the Risk Priority Number (RPN)
Recommendation for corrective action by identifying corrective design or other actions required to eliminate the failure or control the risk
Document the analysis and summarize the problems which could not be
corrected by design and identify proper controls to reduce risks.
The standard FMEA process evaluates failure modes for severity, occurrence and detection. The multiplication of these values leads to what is known as the RPN - Risk Priority Number (CARBONNE and TIPPET, 2004).
2.2) PMBOK AND PROJECT RISK MANAGEMENT
PMI considers the project as a temporary endeavor, unique, in line with the organization’s strategy and conceived to create a product that has never been carried through before (PMI, 2004). As the objective of a project is to generate an unknown product, it usually involves risk because the steps to achieve the proposed targets are not known by the people in charge of project development. The concept of project risk is related to all events or conditions that can produce positive or negative effects in at least one project objective. Risks can be classified as internal, when the project team can influence or control them, and external when the project team are unable to control and influence them (PMI, 2004).
Considering the nine areas of knowledge mentioned in the Project Management
Body of Knowledge (PMBOK), risk is the fourth most cited area in the relevant
literature that documents research in project management, with a 10% quote rating (KLOPPENBORG et al, 2002).
There are several tools available for risk management in projects, most of which concern risk identification. They present a list of risks that have already occurred in other projects or critical success factors, as mentioned by Jiang et al (2000, 2002), Jiang & Klien (2001), Datta & Mukherjee (2001), Royer (2000) and Gambôa (2004).
PMBOK addresses Project Risk Management processes in the 11th Chapter (PMI, 2004). The content given in PMBOK is useful for Project Managers to manage and communicate project risks. The six processes included in PMBOK’s Project Risk Management chapter are:
• 11.1 Risk Management Planning • 11.2 Risk Identification
• 11.3 Qualitative Risk Analysis • 11.4 Quantitative Risk Analysis • 11.5 Risk Response Planning • 11.6 Risk Monitoring and Control
Regardless of the type of risk management process, the application of risk management has a positive effect on finding and taking action to avoid events that could lead to negative consequences for the project and the organization (OLSSON, 2007). In the following section, we present a simple model that attempts to integrate the “classic” FMEA approach into PMBOK’s risk management process (PMI, 2004).
3. THE MODEL
In this section, we first present the general outline of our risk management model. Then, we compare our model with the PMBOK guidelines (see them in the lines below, PMI, 2004, Ch. 11). Such a comparison allows us to estimate the fit between the two models in section 4, when we apply it to a real case study related to the implementation of Enterprise Resource Planning (ERP) software.
According to the classification of case studies presented by Roesch (1999), this work uses a hybrid research strategy. In order to capture the characteristics of the case and draw some conclusions, this paper combines exploratory and interpretative analysis. It is also uses the construction method theory (BANDEIRA DE MELLO and CUNHA, 2006) so that by applying certain concepts developed by other researchers in other fields, it is possible to expand the previously existing theory.
Our main objective is to provide a simple, useable tool for managers and other people involved in project risk analysis. In this sense, our model captures the main topics of the well-known FMEA approach. We incorporate FMEA concepts (usually used in product and process development in manufacturing) into a broader perspective oriented to the Project Risk Management environment. As we do not intend to “reinvent the wheel”, we maintain the expressions and jargon of FMEA in our model.
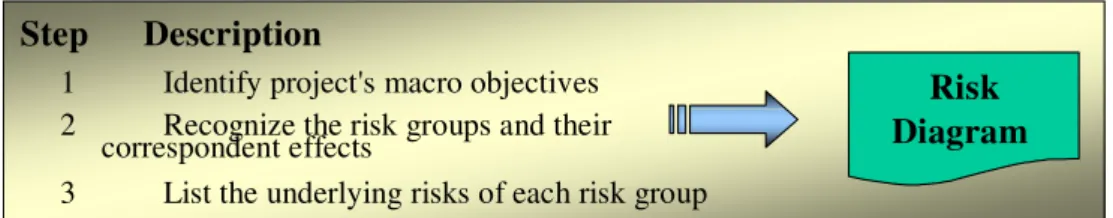
In general, the model is made up of the following steps: 1) Identify project’s macro objectives
2) Recognize the risk groups and their corresponding effects 3) List the underlying risks of each risk group
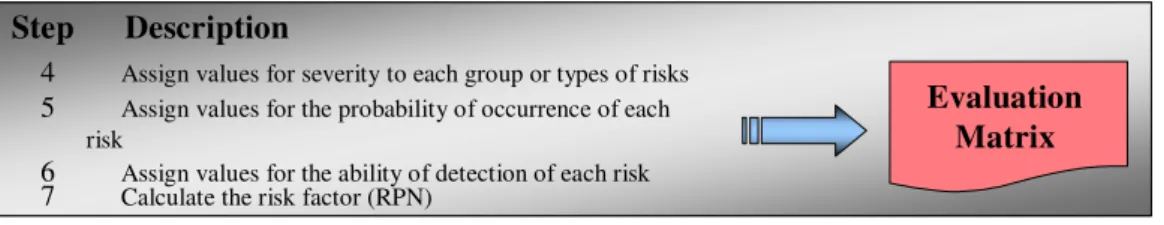
5) Assign values for the probability of occurrence of each risk 6) Assign values for the ability of detection of each risk 7) Calculate the risk factor
8) List the risks in descending order according to the risk factor 9) Define a common strategy for each group or each risk
10) Take possible actions for the selected risk based on the adopted strategy
This model applies to the different phases of the project cycle, from its initial planning to specific sub-projects inside the main project. The framework above has some products: a Risk Diagram, an Evaluation Matrix and an Action List.
The Risk Diagram can be elaborated immediately after step 3, as illustrated in Figure 1. We can use some Total Quality Control (TQC) techniques, such as the Ishikawa Diagram, and Brainstorming to prepare the Risk Diagram. From the visual point of view, the Risk Diagram offers a hierarchical representation, with the macro objective at the top followed by the risk effects and risk causes. In order to link with the concepts of FMEA, the risk to be avoided in step 1 is related to the Failure Mode, i.e. the manner in which a failure is observed (PALADY, 1997). Similar to FMEA, the effects listed in step 2 represent the consequences an individual or a set of risks has on the operation of a specific item. In order to identify these factors, the team must recognize the process in the following manner: “if this risk happens, then that effect will occur” (CARBONNE and TIPPETT, 2004). The underlying risks listed in the step 3 can be interpreted as failure causes, which are the reasons for failure (US MILITARY STANDARD 1629A, 1980).
Step Description
1 Identify project's macr 2 Recognize the risk grou
correspondent effects 3 List the underlying risk
o objectives ps and their
s of each risk group
Risk Diagram Step Description
1 Identify project's macr 2 Recognize the risk grou
correspondent effects 3 List the underlying risk
o objectives ps and their
s of each risk group
Risk Diagram
Figure 1: Risk Diagram
The Risk Evaluation Matrix explores the risks for each group by assigning values to: severity, probability of occurrence and detection of each risk (see Figure 2). The multiplication of these three values leads to the risk index, which is similar to FMEA’s RPN (CARBONNE and TIPPETT, 2004). To avoid bias, we recommend the involvement of more than one person in the process of assigning values.
In our model, we assume the principles of the RPN (Risk Priority Number) technique, which ranks the severity of a failure effect, the probability of the failure-mode occurrence and the probability of the failure being detected on a numeric scale from 1 to 10 (SANKAR and PRABHU, 2001).
same vein, we assume that the detection dimension concerns the ability of foreseeing the risk event (either failure mode or failure cause) in time to plan for a contingency and act upon the risk (CARBONNE and TIPPETT, 2004).
Step Description
4 Assign values for severity to each group or t 5 Assign values for the probability of occurre
risk
6 Assign values for the ability of detection of 7 Calculate the risk factor (RPN)
ypes of risks nce of each
each risk
Evaluation Matrix Step Description
4 Assign values for severity to each group or t 5 Assign values for the probability of occurre
risk
6 Assign values for the ability of detection of 7 Calculate the risk factor (RPN)
ypes of risks nce of each
each risk
Evaluation Matrix
Figure 2: Risk Evaluation Matrix
After obtaining the risk index (RPN), we can rank them from the highest value to the lowest in order to help establish strategies to address the several types of risks. In practice, for each risk we can choose different strategies using the guidelines from PMI: avoidance, transference, and mitigation for negative risks. On the other hand, three other responses to deal with potentially positive impacts are suggested: exploit, share and enhance. The acceptance option can be adopted in both cases, either negative or positive (PMI, 2004).
According to the scope of the chosen strategy, we can list the possible actions to be adopted. At the end of step 10, an action list can be created, as illustrated in Figure 3.
Step Description
8 List the risks in descending order according to the risk factor
9 Define a common strategy for each group or each risk
10 Draw up actions based on the adopted strategy
Actions List Step Description
8 List the risks in descending order according to the risk factor
9 Define a common strategy for each group or each risk
10 Draw up actions based on the adopted strategy
Actions List
Figure 3: Action List
4) RESULTS AND DISCUSSION
As previously mentioned, we adopt two steps for assessing the consistency of our model. First, we execute a sort of gap analysis between the suggested model and PMBOK’s chapter on risk management (PMI, 2004, Chapter 11). Then we apply our risk management tool to a real case study.
4.1) Gap Analysis between the suggested Model and PMBOK’s Model of Risk Management
Two main characteristics differentiate the risk management model suggested in this work from that recommended by PMI: the criteria of severity and detection.
based on the calculated value of the tasks involved and the probability of occurrence of the risk related to these tasks. The impact of an activity which has a low calculated value can cause great disturbance in a project – customs clearance of a spare part or imported equipment or a license to be obtained from a regulatory agency are typical examples. Furthermore, differing perceptions regarding monetary values can alter the outcomes of severity analysis since different professionals with distinct visions might be involved in the process.
Second, the detection criterion is absent in PMI’s methodology. Although the time dimension is described in PMBOK as a crucial factor for both risk identification and the adoption of action in response to risks, we need to take into account that an exact response at the wrong time can lead to unsatisfactory results. As we have seen, the detection dimension is widely used in project management. In addition, the consequences of a problem later identified are certainly greater than the consequences of the same problem identified at an earlier phase of the project. Thus, the ease of detection of an error is essential in risk management and has been incorporated into our model.
In our analysis we compared the existing fit between the proposed model and PMBOK. The results of this analysis are available in Figures 4 to 9. The numbers in parenthesis refer to the corresponding section of the PMBOK chapter dedicated to risk management (11.1; 11.2, etc).
The Risk Management Plan suggested in PMBOK in chapter 11.1 includes
methodology, roles and responsibilities, and budget (PMI, 2004). Because PMBOK’s approach is more generic and has a broader scope, our model’s adherence is low.
PMBOK’s Requirements Suggested Model’s Adherence
Comments
Risk Management Plan (11.1) Low The suggested model has a
narrower scope than PMBOK’s 11.1 process Figure 4: PMBOK’s requirements for Risk Management Plan
Risk Identification in PMBOKinvolves the risks that can affect the project either positively or negatively. The risk identification dimension (see Figure 5) has one only outcome: a list of risks. The gap analysis results reveal high adherence to the list of risks because the model identifies a list of the risks following the PMBOK guidelines.
PMBOK’s Requirements Suggested Model’s Adherence
Comments
Risks (11.2) High Fulfilled by Risk Diagram
Qualitative Risk Analysis in PMBOK involves the evaluation of the impact and the probabilities of the identified risks. It produces an overall risk ranking for the project, a list of prioritized risks, a list of risks for additional analysis and management, and trends in qualitative risks analysis results (PMI, 2004, Ch. 11.3).
Our analysis shows a high adherence to the overall risk ranking for the project as our model calculates a risk factor that evaluates global risk. Likewise, we observe a high adherence to the List of Prioritized Risks and to the List of Risks for Additional Analysis and Management since the same risk factor can be classified in a descending order. This can shed some light on prioritized risks and on those that might need additional management. Lastly, when we consider the dimension “Trends in Qualitative Risks Analysis Results” we observe a medium adherence. However, this result has validity only if we repeat the analysis several times. By doing so, we are able to identify trends and tendencies.
PMBOK’s Requirements Suggested Model’s Adherence
Comments
Overall Risk Ranking for the Project (11.3)
High Fulfilled by RPN’s
Evaluation Matrix
List of Prioritized Risks (11.3) High Fulfilled by RPN’s ordering
in Evaluation Matrix List of Risks for Additional
Analysis and Management (11.3)
High Fulfilled by RPN’s ordering
in Evaluation Matrix
Trends in Qualitative Risks
Analysis Results (11.3) Medium Only if the analysis were repeated several times Figure 6: PMBOK’s Qualitative Risk Analysis requirements
PMBOK’s Quantitative Risk Analysis involves impacts and the calculation of estimated probabilities for each risk identified. The outcome of this phase involves a prioritized list of quantified risks, probabilistic analysis of the project and probability of achieving the objectives of cost and time and trends in quantitative risk analysis of results (PMI, 2004, Ch. 11.4).
PMBOK’s Requirements Suggested Model’s Adherence
Comments
Prioritized List of Quantified Risks (11.4)
High Fulfilled by RPN’s
ordering in Evaluation Matrix
Probabilistic Analysis of The Project (11.4)
Low
Probability of achieving the objectives of cost and time (11.4)
Low
Trends in quantitative risk analysis of results (11.4)
Medium Only if the analysis
were repeated several times
Figure 7: PMBOK’s Quantitative Risk Analysis requirements
PMBOK’s Risk Response Planning involves taking action to maximize the opportunities and to minimize the threats, which might jeopardize the objectives and goals of the project. Besides the risk response plan itself, Risk Response Planning includes the assessment of residual risks, secondary risks. It also must to take into account contractual agreements, the inputs for other processes and inputs for a revised project planning (PMI, 2004, Ch. 11.5).
PMBOK’s Requirements Suggested Model’s Adherence
Comments
Risk Response Plan (11.5) High Fulfilled by Action List
Residual Risks (11.5) Medium Partially Fulfilled by Action
List
Secondary Risks (11.5) Medium Partially Fulfilled by Action
List
Contractual Agreements (11.5) Medium Identified from an action
whose strategy is transference Inputs for Other Processes
(11.5)
N/A PMBOK’s Specific item not
directly related to risk management Inputs to a Revised Project
Plan (11.5)
Medium PMBOK’s Specific item not
directly related to risk management Figure 8: PMBOK’s Risk Response Planning requirements
PMBOK’s Risk Monitoring and Control are a set of processes that run throughout the project because risks change during the project life cycle. It involves risk tracking; monitoring of residual and new risks that could present themselves after an action; and the execution of the action plan and evaluation of its deployment. Its product is composed of workaround plans, corrective actions, project change requests, update of the risk response plan, risk database and updates to the risk identification checklist (PMI, 2000; 2004 Ch. 11.6).
PMBOK’s Requirements Suggested Model’s Adherence
Comments
Workaround Plans (11.6) High Fulfilled by Action List
Corrective Actions (11.6) High Fulfilled by Action List
Project Change Requests (11.6) Medium Partially Fulfilled by Action
List Updates to the Risk Response
Plan (11.6)
Medium Fulfilled by Action List if
the suggested modelwere repeated several times
Risk Database (11.6) Low This model is useful only
for current projects Updates to Risk Identification
Checklists (11.6)
Low This model is useful only
for current projects Figure 9: PMBOK’s Risk Monitoring and Control requirements
In summary, the above analysis has covered the 24 processes of project risk management presented in PMBOK. (PMI, 2000; 2004). Figure 10 shows that most of the processes (71%) present high or medium adherence, which indicates that our model (FMEA) satisfies most of PMBOK’s project risk management demands. This confirms that FMEA can be considered a powerful tool for use in project risk management.
Gap Analysis Between PMBOK's Requirements
for Project Risk Management and FMEA
8%
21%
33%
38% N/A
Low
Medium
High
4.2. Case Study: ERP implementation in postal and logistics services
In order to evaluate the model’s feasibility, we apply the proposed tool to a real case study. The organization chosen is Company A, a state-owned company, which is the Brazilian market leader in postal services. Company A also operates in logistics and communication services. According to its annual report, Company A’s revenues were roughly US$ 5.7 billion in 2007 and it employs around 110,000 people.
In the year 2000, Company A started the implementation of ERP software. The company’s size and its corresponding complexity contributed to the delay of the project, which took almost seven years to be complete (PAVANI, 2007). We tested our model in a specific sub-project: the billing process of service “X”, not identified here for reasons of confidentiality. Service X concerns the implementation of a customer invoicing service and is responsible for collecting about 25% of its revenue.
Service X has some particular characteristics, which meant that its billing process required a high degree of customization in the original programs of the ERP system. Project managers decided that the billing process of service X would have to be the first to be implemented in the ERP system, while the other services would continue to be invoiced using the former legacy systems. The complexity and importance of Service X for the company’s income meant that there was a need for careful evaluation of the risks involved.
A project team was put together to manage the risks. One project manager, two consultants and two key-users made up the team members. They carried out the activities listed in the 10 step model described in section 3 and generated the three products of the suggested model: Risk Diagram, Evaluation Matrix and Action List. Section 4.2.1 shows a summary of the products created in the above-mentioned sub-project at Company A.
4.2.1. Risk Diagram
Lack of Users
Lack of Consultants Billing Address
Billing and Invoicing for Service X Level 1: Objective
Invoices not sent Level 2: Faillure Effect
Invoices with errors
Inadequate IT Infra-structure
Level 3a: Group of Faillure Causes
Program Problems
Data Problems Team Problems
Level 3b: Faillure Causes Equipment Network
Database
Configuration
Bug
Clients Contracts Users not trained Lack of Users Lack of Consultants Billing Address
Billing and Invoicing for Service X Level 1: Objective
Invoices not sent Level 2: Faillure Effect
Invoices with errors
Inadequate IT Infra-structure
Level 3a: Group of Faillure Causes
Program Problems
Data Problems Team Problems
Level 3b: Faillure Causes Equipment Network
Database
Configuration
Bug
Clients Contracts Users not trained
Figure 11: Risk Diagram
4.2.2) Evaluation Matrix
With the list of risks drawn up as described in section 4.2.1, we can now address the FMEA criteria: severity, occurrence and detection (Figure 12). For the sake of simplicity, we demonstrate only a small part of the possible failure causes that are grouped under team problems.
Failure Mode
Failure
Effect
S Risk Group Failure
Causes
O Control D RPN
Billing and Invoicing for Service X
Invoices with errors 9 Team Problems Lack of Users 8 Team Evaluation 1 72 Invoices
with errors 9 Team Problems Users not Trained Untrained 6 Performance Reports 3 162 Invoices with errors 9 Team Problems Lack of Consultants 5 Team Evaluation 1 45
Figure 12: Schematic representation of Evaluation Matrix
the failure mode: invoices with errors. The column with the heading “S” is related to the value of severity. The value 1 reflects a very small impact and the value 10 reflects a great impact. The risk group column must be filled with a group of possible risks that jeopardize the objective and are related to the existence of the failure effect - in the example shown, team problems.
In the column Failure Cause the risks that make up the described group in the column Risk Group are listed. For didactic purposes, Figure 12 lists three risks: lack of users, poorly trained /untrained users and lack of consultants. The column with heading “O” registers the value of the probability of the occurrence, with 1 representing very low probability of occurrence and 10 representing an event of extremely high probability. The risks associated with lack of users, poorly trained users and lack of consultants were evaluated with probabilities of occurrence 8, 6 and 5, respectively.
The Control column is a means of identifying a risk which has occurred or is about to occur. The risks related to lack of users or consultants can be identified when an evaluation of the team is made. Furthermore, the risk relating to poorly trained/untrained users can be identified and this generates performance reports. The column headed “D” refers to the detection value with 1 for risks easily monitored for listed controls and 10 for risks monitored with difficulty for the listed controls. The risks that include lack of users, poorly trained/untrained users and lack of consultants were evaluated with probability of occurrence 1, 3 and 1, respectively. RPN’s Column is the calculation of the risk index (or Risk Priority Number), calculated from the product of the criteria severity, occurrence and detection. The risks that include lack of users,poorly trained users and lack of consultants were evaluated with risk index (RPN) 72, 162, and 45, respectively.
4.2.3) Action List
With the calculated RPN described in section 4.2.2, we can identify risk strategies and actions list, as shown in Figure 13.
Failure Causes RPN Risk Strategy
Actions
Untrained users 162 Mitigation Train users
Lack of Users 72 Mitigation Request more users
Lack of Consultants
45 Acceptance Follow up performance, overtime
Figure 13: Representation of Action List
recommended actions to respond to each of the risks in the column Failure Cause.
5. CONCLUSIONS
In many projects, it is rarely possible to foresee action that will be needed in the future (POLLACK, 2007). Given these circumstances, we have to manage events that might exacerbate any harmful effects. It is necessary, therefore, to establish mechanisms for risk management. In this paper, we have presented a simple model that can be adopted by project managers. By combining the well-known concepts of FMEA with the requisites of PMBOK, the proposed tool analyzed here may be helpful in reducing risks in a project. Using the same reasoning as Bertolini et al. (2006), the approach of the model proposed here allows the user to analyze a generic process of a company in a straightforward but detailed and structured way. The model’s simplicity not only facilitates its use and dissemination, but it can also help companies to save both financial and human resources. In other words, simple ideas can be used to solve complex problems (PYRA and TRASK, 2002).
Our analysis of PMBOK’s requirements for project risk management and the available tools in our model based on FMEA have demonstrated that the proposed model fulfills 71% of PMBOK’s requirements to a high or a medium degree. This indicates that FMEA can be considered as a tool to be tested in project risk management in other areas other than product development in manufacturing, such as Information Technology projects.
The application of the suggested model to a real case indicates that it presents a feasible alternative for project risk management. Furthermore, the model enables outcomes that provide concrete results: a Risk Diagram, an Evaluation Matrix and Action List.
The main characteristics that differentiate our model from PMI methodology for risk management lies in the way severity is addressed and detection criterion. In our model, we assign values on a numerical scale rather than in terms of monetary values. Naturally, financial issues can continue to drive the analysis, however, using a scale makes it easier to carry out a risk analysis as it enables the construction of a numerical risk index (or according to FMEA concept the Risk Priority Number - RPN). The inclusion of the detection dimension adds value to PMI’s risk management analysis as it provides a structured way of predicting failures and avoiding them before they occur.
REFERENCES
BANDEIRA-DE-MELLO, R.; CUNHA, C. Grounded Theory. In: Christiane Kleinubing Godoi; Rodrigo Bandeira-de-Mello; Anielson Barbosa da Silva. (Org.).
Pesquisa Qualitativa em Organizações: Paradigmas, Estratégias e Métodos. 1 ed.
São Paulo: Editora Saraiva, 2006, v. 1. 241-266.
BERTOLINI, M BRAGLIA. M and CARMIGNANI, G. An FMECA-based approach to process analysis. International. Journal. Process Management and
Benchmarking, Vol. 1, No. 2, 2006, 127-145
CARBONE, T. ; TIPPETT, D. , Project Risk Management Using the Project Risk FMEA, Engineering Management Journal, v16, No.4, December 2004
DATTA, S.; MUKHERJEE, S K. Developing a risk management matrix for effective project planning - An Empirical Study. Project Management Journal; 32, 2, Jun 2001;
DOOLEY, L., LUPTON, G., & O’SULLIVAN, D. Multiple project management: A modern competitive necessity. Journal of Manufacturing Technology Management,
v. 16, n. 5, 2005, 466-482
FERREIRA, A.G.G.. FMEA em Gerenciamento de Riscos em Projetos. Seminário
Gestão de Projetos SUCESU-SP, 2003.
GAMBÔA, F.R. et al. Método para Gestão de Riscos em Implementações de Sistemas ERP Baseado em Fatores Críticos de Sucesso. Revista de Gestão da Tecnologia e Sistemas de Informação, Vol. 1, No. 1, 2004, 46-63.
HARTLEY, K., BALESTERO, G.; O´BRAY, D. The State of the Project
Management Profession, 2004. <Available at www.pmi.org.uk.> Retrieved in
25/10/2004.
JIANG, J.; KLEIN, G.; MEANS, T.L. Project Risk Impact on Software Development Team Performance. Project Management Journal; 31, 4, 2000;.
JIANG, J.; KLEIN, G.. Software Project Risks and Development Focus. Project Management Journal; 32, 1 Mar 2001.
JIANG, J.; KLEIN, G.; ELLIS, T. A Measure of Software Development Risk. Project Management Journal; 33,3 Sep 2002..
KLOPPENBORG, T.; OPFER, W. The current state of project management research: Trends, interpretations, and Predictions. Project Management Journal; 33, 2 Jun
2002;
MATTA, N., & ASHKENAS, R. 2003. Why good projects fail anyway. Harvard
Business Review, 8, Sep, 2003, 109–113
MCDERMOTT, R. E. et al. The Basics of FMEA. Quality Resources, USA, 1996.
NAKASHIMA, D.; CARVALHO, M.; Identificação de Riscos em Projetos de TI.
partir das Informações Provenientes dos Clientes, com Utilização do Desdobramento da Função Qualidade (QFD) no Estabelecimento das Ações Corretivas. Instituto Militar de Engenharia, Departamento de Engenharia de Sistemas,
Relatório Técnico número 045/DE9/99, 1999.
OLSSON. R.. In search of opportunity management: Is the risk management process enough? International Journal of Project Management. 25, 2007, 745–752
PAVANI, L. Tecnologia é o negócio. Info Corporate, n.49, outubro, 2007.
POLLACK, J. The changing paradigms of project management. International Journal of Project Management 25, 2007, 266–274
PROJECT MANAGEMENT INSTITUTE (PMI). A guide to the project management
body of knowledge (PMBOK® Guide). Project Management Institute, Pennsylvania,
2004.
PROJECT MANAGEMENT INSTITUTE (PMI). A guide to the project management
body of knowledge (PMBOK® Guide). Project Management Institute, Pennsylvania,
2000.
PUENTE, J.; PINO, R.; PRIORE, P.; DE LA FUENTE, D.. A Decision Support System for Applying Failure Mode and Effects Analysis. The International Journal of Quality & Reliability Management; 19, 2 ;2002.
PYRA, J. Trask, J.. Risk management post analysis: Gauging the success of a simple strategy in a Complex Project. Project Management Journal; 33, 2; jun, 2002.
ROESCH, S. Projetos de Estágio e de Pesquisa em Administração: Guia para
Estágios, Trabalhos de Conclusão, Dissertações e Estudos de Caso. 2a Edição.Editora Atlas. São Paulo, Brasil.1999..
ROYER, P.. Risk management: The undiscovered dimension of project management. Project Management Journal; 31, 1 Mar 2000.
SANKAR, N.; PRABHU, B. Modified approach for prioritization of failures in a
system failure mode and Effects Analysis. The International Journal of Quality & Reliability Management; v.18, n.3, 2001, 324-335.
STEWART, R. A framework for the life cycle management of information technology projects: ProjectIT. International Journal of Project Management, 26 2008, 203–
212.
US MILITARY STANDARD, MIL-STD-1629A. Procedures for Performing a