Temporal Relationship between Diet-Induced
Steatosis and Onset of Insulin/Leptin
Resistance in Male Wistar Rats
Li Zhang1, Haiyan Song1, Yingli Ge1, Guang Ji1,2*, Zemin Yao3*
1Institute of Digestive Disease, Longhua Hospital, Shanghai University of Traditional Chinese Medicine, Shanghai 200032, China,2E-institute of Shanghai Municipal Education Commission, Shanghai University of Traditional Chinese Medicine, Shanghai 200032, China,3Department of Biochemistry, Microbiology & Immunology, Ottawa Institute of Systems Biology, University of Ottawa, Ottawa, Canada
*[email protected](ZY); [email protected](GJ)
Abstract
Rats fed with high-fat-high-sucrose (HFHS) diet are known to manifest metabolic syndrome including hyperinsulinemia, hyperleptinemia, hyperglycemia, diabetic dyslipidemia, and he-patic steatosis. The aim of the current study is to determine the temporal relationships be-tween the development of hepatic steatosis and the onset of insulin and leptin resistance in hypothalamus and liver in male Wistar rats (six weeks of age) fed chow or HFHS diet for up to 8 weeks. Fasting plasma glucose, lipids/lipoproteins, insulin and leptin levels were quan-tified, histopathologic score of hepatic steatosis and inflammation were assessed, and the responses of common checkpoints of insulin and leptin signalling responsible for lipogene-sis and gluconeogenelipogene-sis were analyzed. In addition, acute insulin or leptin administration was performed at different stages of HFHS dieting to determine the responsiveness of the respective signalling pathways. Hyperinsulinemia, hyperglycemia, dyslipidemia, and in-creased homeostasis model assessment of basal insulin resistance occurred 1-week after HFHS dieting, coinciding with upregulation of suppressor of cytokine signalling 3 in both hy-pothalamus and liver. However, hepatosteatosis, accompanied with increased expression of sterol regulatory element binding protein 1c and phosphoenolpyruvate carboxykinase, did not manifest until 4- to 8-week after HFHS dieting. Lowered insulin sensitivity (shown by decreased insulin receptor substrate 1 and protein kinase B phosphorylation) occurred ap-proximately 2 weeks prior to leptin resistance (shown by impaired signal transducer and ac-tivator of transcription 3 activation) in both the liver and hypothalamus. Acute insulin/leptin administration also demonstrated the impaired insulin or leptin signalling transduction. These data suggest that lowered insulin sensitivity and leptin resistance occurred at least 2–3 weeks earlier than the manifestation of hepatosteatosis in rats fed HFHS diet.
OPEN ACCESS
Citation:Zhang L, Song H, Ge Y, Ji G, Yao Z (2015) Temporal Relationship between Diet-Induced Steatosis and Onset of Insulin/Leptin Resistance in Male Wistar Rats. PLoS ONE 10(2): e0117008. doi:10.1371/journal.pone.0117008
Academic Editor:Julie A. Chowen, Hosptial Infantil Universitario Niño Jesús, CIBEROBN, SPAIN
Received:January 14, 2014
Accepted:December 17, 2014
Published:February 6, 2015
Copyright:© 2015 Zhang et al. This is an open access article distributed under the terms of the Creative Commons Attribution License, which permits unrestricted use, distribution, and reproduction in any medium, provided the original author and source are credited.
Funding:This work was supported by the National Nature Science Foundation of China (No. 81273727, 81302927), Innovation Program of Shanghai Municipal Education Commission, No.14YZ053, Shanghai Discipline Project (No. ZYSNXD-CC-ZDYJ042), and Longhua Medicial Project (No. D-09). The funders had no role in study design, data collection and analysis, decision to publish, or preparation of the manuscript.
Introduction
Nonalcoholic fatty liver disease (NAFLD) has become a common form of chronic liver disease worldwide, affecting one third of populations [1]. Accumulation of lipid, mainly triglyceride (TG), is considered the main feature of NAFLD, with steatosis being the pathological status in clinics. Pathology of NAFLD encompasses a spectrum of abnormalities, ranging from simple steatosis to nonalcoholic steatohepatitis, fibrosis, and eventual cirrhosis [2,3]. In addition to these hepatic abnormalities, NAFLD is also a contributing factor of metabolic syndrome, a cluster of lipid and lipoprotein disorders closely associated with type 2 diabetes and premature cardiovascular disease [4].
Although the mechanisms underlying the pathogenesis of NAFLD are not fully understood, available data from human and animal studies have indicated a link between insulin and/or lep-tin resistance and NAFLD [5–10]. Insulin signalling sensitizers (e.g. pioglitazone and metfor-min) that commonly used in treating diabetes have proven clinically beneficial in improving biochemical indices in NAFLD patients [11]. Similarly, improving insulin sensitivity can also lead to decreased hepatic steatosis in animals [12]. Moreover, strategies that improve both insu-lin and leptin sensitivity have demonstrated promising outcomes in attenuating NAFLD [13].
The adipose-derived hormone leptin is known to act on hypothalamus to reduce food intake and increase energy expenditure. Studies with animals fed with a high-fat diet invariably show hyperleptinemia and hyperinsulinemia under diet-induced-obesity (DIO) conditions [14]. Hyper-leptinemia exerts no anorexic effect in the DIO animals, suggesting a state of leptin resistance in hypothalamus [15]. Leptin resistance in hypothalamus is associated with up-regulation of sup-pressor of cytokine signalling 3 (SOCS3) and subsequent down-regulation of signal transducer and activator of transcription 3 (STAT3) activation [16,17]. Activation of STAT3 is achieved by phosphorylation catalyzed by Janus kinase 2 (JAK2), a tyrosine kinase associated with OBR [18], whereas SOCS3 participates as a suppressor in the negative feedback loop attenuating STAT3 me-diated signaling [19]. SOCS3 attenuates leptin signaling through several mechanisms, including direct binding to OBR and/or tyrosine-phosphorylated JAK2 and thus inactivating JAK2 [20].
Recent experimental data have suggested that leptin can act directly on the liver, influencing the insulin signalling pathway in addition to the leptin signalling pathway, and therefore on he-patic lipid and lipoprotein metabolism [21,22]. Functional OBR, both the long and the short forms (designated OBRLand OBRS, respectively), were expressed in the liver [23]. Gain or loss of hepatic leptin action in mice has a profound impact on the phosphatidylinositol 3 kinase (PI3K) activity and hepatic steatosis (i.e. TG content) [24,25]. Thus, leptin may directly exerts an effect on lipid and glucose metabolism in the liver through the PI3K pathway.
The common PI3K pathway that is shared by insulin and leptin signalling features a close cross-talk between the two hormonal regulations in lipid and glucose metabolism in both cen-tral and peripheral tissues. In cencen-tral, insulin has been shown to act on the same key areas in the brain as leptin does [26]. Intracerebroventricular infusion of insulin in mice affects both food in-take and lipid metabolism in peripheral tissues, whereas brain-specific disruption of the insulin receptor gene in mice resulted in disorders similar to that observed in leptin-deficient ob/ob mice [27]. In the liver, inactivation of hepatic SOCS3 resulted in increased insulin sensitivity and lipogenesis [28], whereas expression of recombinant STAT3 in the liver markedly attenuat-ed hyperglycemia and hyperinsulinemia in diabetic mice [29]. Liver-specific inactivation of the insulin receptor in mice resulted in dyslipidemia and increase risk of atherosclerosis [30].
lowered insulin sensitivity occurred earlier than leptin resistance in both liver and hypothala-mus. Uncontrolled hepatic glucose production and upregulation of lipogenesis were detected at late stages of HFHS dieting, which was associated with pathological manifestation of NAFLD.
Materials and Methods
Animals
Male Wistar rats (6 week old) were obtained from SLAC Animal Laboratories (Shanghai, China), and housed under a standard 12-h light-dark cycle (lights on at 7:00 AM) with access to food and water ad libitum. After approximately 1-week acclimation, rats were placed on chow or HFHS diet (SLAC Animal Laboratories) for up to 8 weeks. The energy content of chow diet is 4.15 kcal/g, and 100 g chow contains (in grams): casein, 20; starch, 66.07; soybean oil, 4; cellu-lose, 5; mineral mix, 3.5; vitamin mix, 1; L-cystine, 0.18; and choline bitartrate, 0.25. The energy content of the HFHS diet is 5.13 kcal/g and 100 g HFHS food contains (in grams): casein, 20; starch, 34.07; sucrose, 15; lard, 15; soybean oil, 4; cellulose, 5; mineral mix, 3.5; vitamin mix, 1; L-cystine, 0.18; choline bitartrate, 0.25; and cholesterol, 2. Rats were individually housed in a pathogen free environment, and body weight and food intake were measured weekly. For the acute insulin/leptin treatment experiment, rats fed with chow or HFHS diets were intraperi-toneally injected with recombinant insulin (0.75 U/kg body weight) or recombinant rat leptin (0.6 mg/kg body weight), and liver samples were collected 30 min after the injection. The animal protocols were performed in accordance with the guidelines and approval of the Animal Experi-ment Ethics Committee at Shanghai University of Traditional Chinese Medicine.
Oral Glucose Tolerance Test
Rats were fasted for 6 h after the start of the light cycle, and then orally administered with glu-cose (1.5 g/kg body weight). Tail-vein blood samples were collected at baseline and at indicated time intervals (15, 30, 60, 90, and 120 min) after glucose treatment. Blood glucose levels were determined with a diabetes monitoring strip (Lifescan One Touch, IN).
Serum Biochemical Analysis
After fasting for 12 h, rats were anaesthetized with sodium pentobarbital (100 mg/kg) and sacri-ficed, and blood was collected from aorta abdominalis. Serum TG, total cholesterol (TC), high density lipid-cholesterol (HDL-c), low density lipid-cholesterol (LDL-c), free fatty acids (FFA), fasting blood glucose (FBG), alanine transaminase (ALT), and aspartate transaminase (AST) were analyzed using the Hitachi full-automatic system with corresponding kits (Wako, Richmond, VA, USA). Fasting insulin (FIN) and leptin were measured using the standard radio-immunity kits (Puerweiye Bioengineering Institute, Beijing, China). The homeostasis model assessment of basal insulin resistance (HOMA-IR) was calculated using formula FBG (mM) × FIN (IU/L)/22.5.
Hepatic Histology Assessment
Measurement of Hepatic Lipid Content
Liver TG and cholesterol were quantified as described previously [33]. Briefly, liver tissue (200 mg) was homogenized in 3 ml of ethanol-acetone (1:1) mixture. The homogenate was ex-tracted over night at 4°C, and centrifuged for 15 min at 3,000 rpm at 4°C. The organic layer was removed, TG and cholesterol were measured using commercial kits (Kangtai Bioengineer-ing Institute, BeijBioengineer-ing, China).
Tissue Sampling and Western Blot Analysis
After euthanasia and blood collecting, hypothalamus and liver were removed, immediately frozen in liquid nitrogen and stored at -80°C. Frozen tissues were homogenized in Tissue Pro-tein Extraction Reagent (Pierce Biotechnology, Inc., Rockford, USA), with the addition of pro-tease inhibitor (Roche, Nutley, USA) and phosphatase inhibitor cocktail (Roche, Nutley, USA). Protein concentrations were determined using the bicinchoninic assay reagents and the micro-bicinchoninic assay method (Pierce Biotechnology, Inc. Rockford, USA). For Western blot analysis, 100μg of protein were fractionated by SDS-PAGE (8–12% gradient gel), transferred
onto a PVDF membrane (Bio-Rad, Hercules, CA), Membranes were blocked with 5% skim milk in Tris-buffered saline and probed with target primary and secondary antibodies (see S1 Tablefor detailed information of antibodies used in the present studies). The targeted pro-teins were detected with ECL Detection Kit (Millipore, Billerica, USA), images were taken and qualified by Gel-Pro system (Tanon Technologies). For western blot analysis, the amount of protein loaded was confirmed by the Bradford method, and equal loading was verified by stain-ing with Ponceau S reagent (Sigma Chemical Co.) and by determinstain-ing the signal of beta actin.
Statistical Analysis
For each outcome measure, a one-way analysis of variance was performed (SPSS 18.0) for each animal group studied (n = 6–8). A significant main effect (P<0.05 orP<0.01) was followed up with Student-Newman-Kuel post hoc comparisons. Values are presented as means ± stan-dard error of the mean (SE), andP<0.05 denotes a statistically significant difference.
Results
Changes in serum metabolic parameters upon HFHS dieting
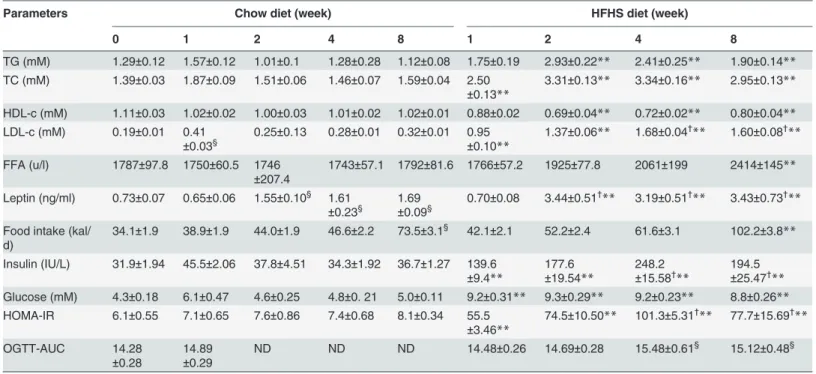
As expected, the HFHS dieting markedly induced a diverse range of metabolic abnormalities, including hypertriglyceridemia, hypercholesterolemia, hyperglycemia, hyperinsulinemia, as well as hyperleptinemia, and most of these abnormalities occurred as early as 1-week and re-mained throughout the entire HFHS dieting (Table 1). The hypercholesterolemia in HFHS diet-fed rats was associated with increased LDL-c and decreased HDL-c (Table 1), typical phe-notypes of diabetic dyslipidemia. The hallmarks of lowered insulin sensitivity, including hyper-insulinemia, hyperglycemia, and increased HOMA-IR were also manifested 1-week after HFHS dieting, indicative of a rapid response of the animals in attenuating insulin signaling. Oral glucose tolerance test (OGTT) did not show significant difference between HFHS diet-and chow diet-fed animals at 1-week (Table 1), However, prolonged HFHS dieting (4, and 8-week) resulted in a trend of increased OGTT-AUC value as compared to that of chow diet-fed rats (0 week) (Table 1). These results suggest that HFHS dieting contributes to the compro-mised insulin sensitivity in these rats.
(Table 2). Serum FFA levels were comparable between HFHS and chow dieting during the first 4 weeks and increased by 30% at the end of 8thweek HFHS dieting (Table 1), suggesting that the lipolytic function of adipose tissue was not compromised until the late stage of insulin/lep-tin resistance. The increased fasinsulin/lep-ting FFA concentration at the late stage of HFHS dieinsulin/lep-ting was not associated with an increase in plasma TG. Rather, fasting plasma TG was gradually de-creased from 2ndto 8thweek of HFHS dieting (Table 1). In a separate experiment where the rats were fed the HFHS diet for up to 12 weeks, fasting plasma TG concentration was further decreased to a level that was lower than that in control animals (chow: 1.62 ± 0.80 mM, HFHS: 0.98 ± 0.16 mM;P<0.01). Assuming that fasting plasma TG concentration reflects secretion of hepatic very low density lipoproteins (VLDL), the decrease in plasma TG probably is indica-tive of compromised hepatic VLDL production upon prolonged HFHS dieting.
Changes in hepatic metabolic parameters upon HFHS dieting
The HFHS dieting also markedly induced hepatic steatosis; elevated liver-associated TG and cholesterol were observed throughout the entire 8-week feeding period (Table 2). Notably, sig-nificant increase in hepatic TG and cholesterol was detected as early as ½-week HFHS feeding (TG: 39.1 ± 1.25versus15.5 ± 0.25 mg/g; TC: 15.71 ± 0.92versus4.97 ± 0.86 mg/g,P<0.01). Hepatosteatosis in HFHS-fed rats was associated with hepatomegaly, thus the liver-to-body weight ratio was increased immediately 1-week after HFHS dieting, even though there was no Table 1. Serum metabolic parameters and food intake.
Parameters Chow diet (week) HFHS diet (week)
0 1 2 4 8 1 2 4 8
TG (mM) 1.29±0.12 1.57±0.12 1.01±0.1 1.28±0.28 1.12±0.08 1.75±0.19 2.93±0.22** 2.41±0.25** 1.90±0.14**
TC (mM) 1.39±0.03 1.87±0.09 1.51±0.06 1.46±0.07 1.59±0.04 2.50 ±0.13**
3.31±0.13** 3.34±0.16** 2.95±0.13**
HDL-c (mM) 1.11±0.03 1.02±0.02 1.00±0.03 1.01±0.02 1.02±0.01 0.88±0.02 0.69±0.04** 0.72±0.02** 0.80±0.04**
LDL-c (mM) 0.19±0.01 0.41
±0.03§
0.25±0.13 0.28±0.01 0.32±0.01 0.95
±0.10**
1.37±0.06** 1.68±0.04†
** 1.60±0.08† **
FFA (u/l) 1787±97.8 1750±60.5 1746
±207.4
1743±57.1 1792±81.6 1766±57.2 1925±77.8 2061±199 2414±145**
Leptin (ng/ml) 0.73±0.07 0.65±0.06 1.55±0.10§ 1.61
±0.23§
1.69
±0.09§
0.70±0.08 3.44±0.51†
** 3.19±0.51†
** 3.43±0.73† **
Food intake (kal/ d)
34.1±1.9 38.9±1.9 44.0±1.9 46.6±2.2 73.5±3.1§ 42.1±2.1 52.2±2.4 61.6±3.1 102.2±3.8
**
Insulin (IU/L) 31.9±1.94 45.5±2.06 37.8±4.51 34.3±1.92 36.7±1.27 139.6
±9.4**
177.6
±19.54**
248.2
±15.58† **
194.5
±25.47† ** Glucose (mM) 4.3±0.18 6.1±0.47 4.6±0.25 4.8±0. 21 5.0±0.11 9.2±0.31** 9.3±0.29** 9.2±0.23** 8.8±0.26** HOMA-IR 6.1±0.55 7.1±0.65 7.6±0.86 7.4±0.68 8.1±0.34 55.5
±3.46**
74.5±10.50** 101.3±5.31†
** 77.7±15.69† **
OGTT-AUC 14.28
±0.28
14.89
±0.29
ND ND ND 14.48±0.26 14.69±0.28 15.48±0.61§ 15.12±0.48§
Blood was drawn after 12 h fasting. Values are means±SE (n = 6–8 per group).
§P<0.05 relative to 0-week under chow diet,
†
P<0.05 relative to 1-week under HFHS diet;
**P<0.01, HFHS dietversuschow diet.TG, triglyceride;TC, total cholesterol;HDL-c, high-density lipoprotein associated cholesterol;LDL-c, low density
lipoprotein associated cholesterol;FFA, free fatty acid;HOMA-IR, homeostasis model assessment of basal insulin resistance;OGTT, area under curve of oral glucose tolerance test;ND, Not determined.
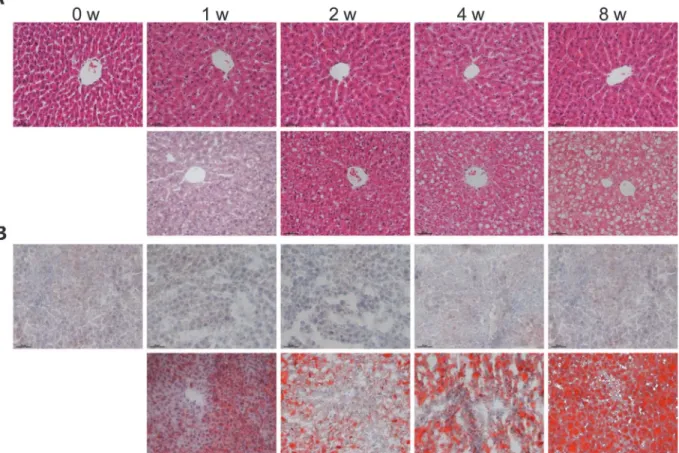
significant change in body weight between the two dietary groups until the end of 8thweek (Table 2). Although biochemical analysis of hepatic TG and cholesterol showed significant in-crease upon HFHS dieting, histological analysis did not suggest hepatosteatosis at 1stor 2nd week dieting (Fig. 1A and 1B). The steatosis score, a histological scoring system for NAFLD, of HFHS-fed liver was less than 1, and the extent of hepatocytes with visible lipid accumulation was less than 5% (Table 2). Massive macrovesicles were observed in liver sections at the 4thto 8thweek HFHS diet-fed rats (Fig. 1A and 1B), resulting in pathological steatosis scoring (Table 2). Significant inflammatory cells were not found in liver tissues even with 8-week HFHS diet-fed rats (Fig. 1A). Determination of liver enzymes (e.g. ALT and AST) also showed no changes between HFHS and chow diet fed rats (Table 2). These results combined suggested that (i) HFHS dieting induced NAFLD was not detected histologically until 4thto 8thweek HFHS dieting, and (ii) there was an absence of overt liver damage or inflammation during the 8-week HFHS dieting. However, accumulation of hepatic TG and cholesterol could be detected biochemically at as early as ½-week HFHS dieting, indicating alterations in lipid metabolism occurred in the liver at least 2 weeks before pathological NAFLD diagnosis.
Up-regulation of SOCS3 in both hypothalamus and liver upon HFHS
dieting
The abnormalities in lipid/lipoprotein and glucose metabolism upon HFHS dieting were asso-ciated with activation of counter-regulatory signaling pathways, including activation of SOCS3. HFHS dieting rapidly induced expression of SOCS3, a negative feedback regulator of leptin and insulin signaling in both central and peripheral target tissues [34]. Western blot analysis revealed that the level of SOCS3 in hypothalamus (Fig. 2A) and the liver (Fig. 2B) was marked-ly increased as earmarked-ly as 1-week HSHF dieting.
Table 2. Liver metabolic parameters and liver enzymes.
Parameters Chow diet (week) HFHS diet (week)
0 1 2 4 8 1 2 4 8
Liver TG (mg/g) 14.1±0.32 21.7 ±1.26
20.6±0.9 21.0±0.7 20.2±0.6 44.9±1.6** 55.7±1.7** 56.6±2.0** 58.3±1.2**
Liver TC (mg/g) 6.6±0.36 7.3±0.16 7.5±0.14 7.8±0.26 7.7±0.58 17.0 ±0.64**
16.8±0.85** 15.6±1.0** 12.7±0.67**
Body weight (g) 180±2.0 205±3.4 280±5.4§ 317±4.2§ 369±7.4§ 211±3.0 283±3.0 331±5.3†
434±8.7† ** Liver weight (g) 6.2±0.07 7.6±0.18 7.1±0.06 7. 5±0.09 9.9±0.07§ 9. 9±0.26** 14.2±0.24†
**
15.70±1.2†*
* 18.7
±0.40†
**
Liver/body weight ratio (%)
3.43±0.06 3.82 ±0.13
3.53±0.03 3.35±0.02 2.69±0.02 4.81±0.16 5.0±0.08** 4.69±0.06** 4.31±0.03**
Liver steatosis score 0.0±0.0 0.1±0.01§ 0.1±0.01§ 0.2±0.01§ 0.2±0.01§ 0.2±0.01** 0.5±0.03†
** 1.2±0.03†
** 2.2±0.06† ** Hepatocytes with lipids
(%)
0.0±0.0 1.2±0.02§ 2.2±0.02§ 2.5±0.04§ 2.8±0.05§ 2.6±0.14
** 4.6±0.14†
** 45.8
±0.58† **
85.9
±1.00† ** ALT (u/l) 45.6±2.4 36.4±1.7 48.3±5.5 52.3±3.5 51.6±2.8 42.9±1.7 62.5±2.4 52.1±1.5 54.4±2.7
AST (u/l) 174.3
±19.4
61.4±1.8§ 139.7
±20.0
133.9
±15.8
125.5
±12.9
55.0±1.2 112.0±8.1 99.4±7.9 88.8±3.6
Values are means±SE (n = 6–8 per group).
§P<0.05 relative to 0-week under chow diet,
†
P<0.05 relative to 1-week under HFHS diet;
**P<0.01, HFHS dietversuschow diet.TG, triglyceride;TC, total cholesterol;ALT, alanine transaminase;AST, aspartate transaminase.
Elevated hypothalamic and hepatic SOCS3 expression was associated with down-regulation of OBR (Fig. 2A and 2B), suggesting an induction of leptin resistance in the respective tissues. However, down-regulation of phosphorylation of STAT3 (the JAK2 effector protein) occurred much later during HFHS dieting as compared to SOCS3 un-regulation. In hypothalamus, de-creased STAT3 phosphorylation was observed between 6th(not shown) and 8thweek (Fig. 2A) after HSHF dieting. The late onset of STAT3 inactivation shown in the present study was in agreement with previous observations, where attenuated hypothalamic JAK2/STAT3 signaling did not occur until 5thto 6thweeks of high-fat diet [35]. The normal STAT3 activity during the first 4-week HFHS dieting has thus been dubbed as the“early stage”leptin resistance [36].
SOCS3 has also been shown to attenuate hepatic insulin signaling by binding to the insulin-receptor (INSR), interfering IRS phosphorylation [37], or promoting ubiquitin-mediated IRS degradation [38]. Indeed, rapid up-regulation of SOCS3 in the liver upon HFHS dieting (as early as 1-week) was associated with decreased IRS1 phosphorylation (Fig. 2B). STAT3 phos-phorylation in hypothalamus decreased at 8-week, and decreased hepatic STAT3 phosphoryla-tion also occurred at 4thweek HFHS dieting (Fig. 2B). These results suggest that hypothalamic and hepatic leptin resistance was not manifest immediately upon hyperleptinemia in HFHS-fed rats, and alteration in STAT3 signaling probably exert an effect on lipid or glucose metabo-lism predominately at late stage of leptin resistance.
It has been shown previously that down-regulation of OBR could also be achieved by PTP1B [20]. Throughout the entire HFHS dieting, there was no change in PTP1B levels in liver Fig 1. Development of hepatic steatosis upon HFHS dieting.Male Wistar rats (6 weeks old) were placed on chow diet or HFHS diet for 0, 1, 2, 4 and 8 weeks. The livers were excised, processed and stained with hematoxylin-eosin (HE) (A) and Oil Red O (B) (upper panels,chow diet; lower panels,HFHS diet). Images are magnified 200×.
as compared to that in chow diet controls (Fig. 2B). Thus, PTP1B may not play a role in the ob-served down-regulation of hepatic OBR under HFHS conditions. However, in hypothalamus, up-regulation of PTP1B was observed at 4thand 8thweek HFHS dieting (Fig. 2A), which might contribute to down-regulation of hypothalamic OBR.
Fig 2. Onset of leptin resistance and lowered insulin sensitivity in hypothalamus and liver upon HFHS dieting.Liver and hypothalamus samples were collected (after 10-hours fasting) at 0, 1, 2, 4 and 8-week feeding with chow or HFHS diet. (A) Western blots of SOCS3, OBR (L and S forms), phospho-STAT3 (pphospho-STAT3), phospho-STAT3, and PTP1B in hypothalamus. (B) Western blots of SOCS3, phospho-INSR (pINSR), INSR, phosphor-IRS1 (pIRS1), IRS1, phospho-STAT3 (pSTAT3), STAT3, and PTP1B in the liver. Data (mean±SE, n = 3) are presented as relative levels compared to that of basal (0 week).
§P<
0.05 relative to basal (0 week).*P<0.05,**P<0.01 between HFHS diet versus chow diet conditions.
Changes in signalling pathways involved in gluconeogenesis and
lipogenesis upon HFHS dieting
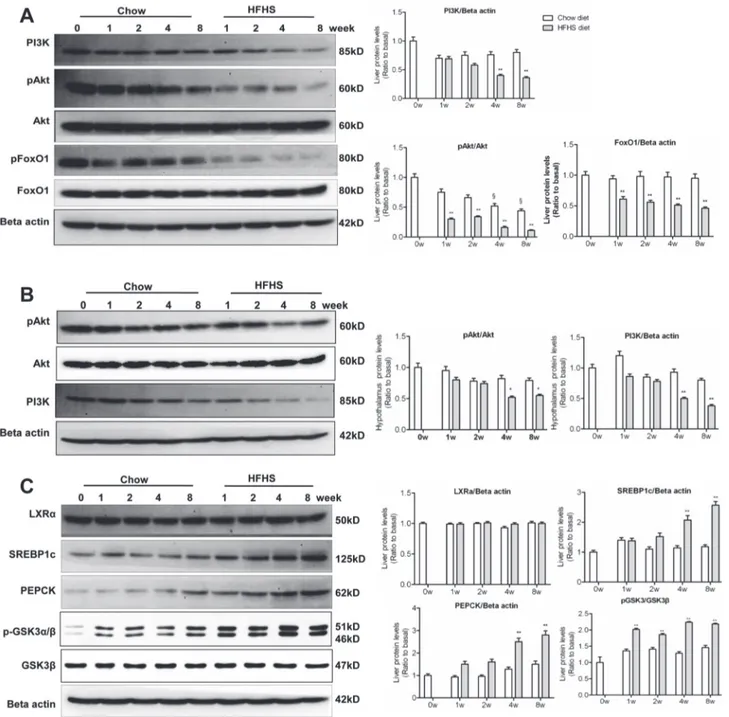
The combined impairment in insulin and leptin signaling converged to produce metabolic changes in PI3K, Akt and FoxO1 [20]. In the liver, down-regulation of PI3K, Akt phosphoryla-tion, and FoxO1 was detected as early as 1-week HFHS dieting (Fig. 3A), coinciding with
up-Fig 3. Altered PI3K signalling pathway, lipogenesis, and gluconeogenesis upon HFHS dieting.The experiments were performed the same as described in the legend toFig. 2. (A) Western blots of PI3Kp85, phospho-Akt (pAkt), Akt, phospho-FoxO1 (pFoxO1) and FoxO1 in the liver. (B) Western blots of phospho-Akt (pAkt), Akt, and PI3Kp85 in hypothalamus. (C) Western blots of LXRα, SREBP1c, PEPCK, phospho-GSK3α/β(pGSK3α/β), and GSK3βin the liver.§P<0.05 relative to basal (0 week).*P<0.05,**P<0.01 between HFHS diet versus chow diet conditions.
regulation of SOCS3 (Fig. 2B). In hypothalamus, down-regulation of PI3K and Akt did not occur until 4thand 8thweek HFHS dieting (Fig. 3B), coinciding with down-regulation of hypo-thalamic STAT3 (Fig. 2A). These results, in agreement with what reported previously [39], sug-gest that impairment in IRS1/PI3K/Akt pathway occurred earlier than that in STAT3/SOCS3 pathway during insulin/leptin resistance. The present results also suggest that the impairment in IRS1/PI3K/Akt pathway occurred earlier in the liver than in hypothalamus.
The observation of a marked decrease in hepatic FoxO1 upon HFHS dieting (Fig. 3A) was unexpected. Normally upon PI3K/Akt activation, FoxO1 is phosphorylated and excluded from nuclei for degradation [40]. The reason for the observed down-regulation of FoxO1 in the face of decreased PI3K/Akt activation remains to be explained, although leptin has been shown to decrease FoxO1 expression in hypothalamus through PI3K [41]. RT-PCR analysis of gene ex-pression of INSR, IRS1, Akt, and FoxO1 at 1stHFHS dieting showed that there was no differ-ence in their mRNA levels in the livers as compared with chow diet controls (data not shown). These results suggest that the impaired activation of insulin signaling was unlikely the cause of decreased FoxO1 proteins. Rather, the decrease in FoxO1 was likely attributable to accelerated posttranslational degradation.
Up-regulation of PEPCK and SREBP1c was observed in the liver of HFHS-fed rats
(Fig. 3C), consistent with the occurrence of lowered hepatic insulin sensitivity and leptin resis-tance. The precise mechanism or transcription factors involved in PEPCK and SREBP1c ex-pression under HFHS conditions are not entirely clear. However, pronounced up-regulation of PEPCK and SREBP1c in the liver occurred at 4thand 8thweek HFHS dieting (Fig. 3C), suggest-ing that dysregulation of gluconeogenesis and lipogenesis was associated with inactivation of both PI3K/Akt and STAT3 pathways. There was no change in the expression of LXRαbetween HFHS and chow diet conditions (Fig. 3C), suggesting that LXRαdid not contribute to up-regu-lation of SREBP1c under the current experimental conditions.
Consideration was also given to the possibility that hyperglycemia under HFHS conditions was due to diminished hepatic glycogen synthesis. To test this possibility, we measured the GSK3 phosphorylation status. As shown inFig. 3C, phospho-GSK3α(Ser21) and phospho-GSK3β(Ser9) were both markedly elevated in the liver of HFHS diet-fed rats, indicating sup-pressed activities in glycogen synthesis. Thus, the unchanged OGTT (Table 1), together with elevated PEPCK and GSK3βphosphorylation (Fig. 3C), suggests that HFHS dieting-induced hyperglycemia in the rats is most likely attributable to hepatic glucose production and not glucose utilization.
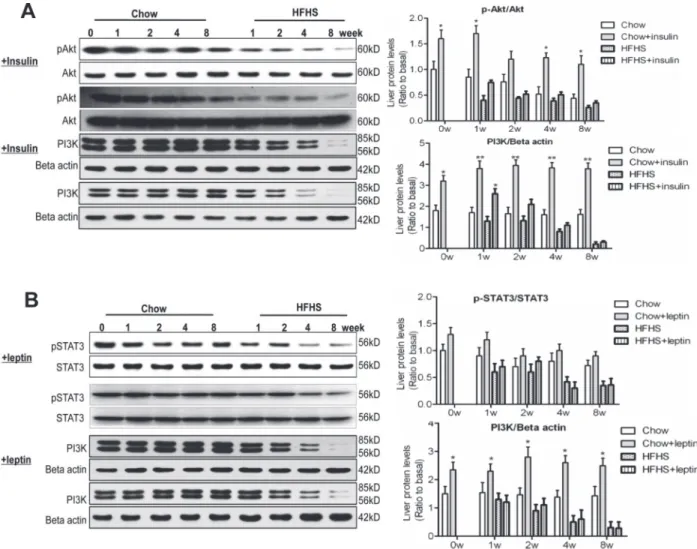
Hepatic response to acute insulin/leptin
hepatic steatosis upon HFHS dieting, and suggest that the impairment in hepatic PI3K/Akt pathway may occur earlier than that in hepatic STAT3/SOCS3 pathway.
Discussion
The present study utilized a well-studied Wistar male rat model to delineate a temporary rela-tionship between the development of clinical NAFLD, the existence of lowered insulin sensitiv-ity, and the onset of leptin resistance in hypothalamus and the liver, through a continuous feeding with HFHS diet for up to 8 weeks. The acute challenge of insulin or leptin also confirms lowered insulin and leptin sensitivity occurred during the development of hepatic steatosis upon HFHS dieting (Fig. 4), further verifies the existence of impaired signaling transduction. In comparison with those fed with chow diet, the HFHS diet-fed rats manifested metabolic syn-dromes as early as 1-week dieting. However, the clinical manifestation of NAFLD in these rats, using a histological scoring system developed for humans, did not occur until the end of 4thto 8thweek dieting. At the late stage of HFHS dieting, massive hepatomegaly was apparent, which Fig 4. Hepatic response to acute insulin/leptin.At 0, 1, 2, 4 and 8-week feeding with chow or HFHS diet, the animals (12 h fasting) were intraperitoneally injected with insulin (0.75 U/kg body weight) or leptin (0.6 mg/kg body weight), liver samples were collected 30min after the injection. Samples were analyzed along with the non-hormone treated liver samples (A) Western blots of total and phospho-Akt (Thr308), PI3Kp85/p55 in the liver 30 min after insulin injection. (B) Western blots of total and phospho-STAT3, PI3K p85/p55 in the liver 30 min after leptin injection. Data (mean±SE, n = 3) are presented as relative
was accompanied with significantly elevated fasting plasma FFA concentrations (e.g. 8-week data in Tables1&2), suggesting a compromised FFA storage in peripheral tissues and in-creased flux of FFA into the liver. The ability to secrete TG from the liver, presumably in the form of VLDL (as assessed by the fasting plasma TG concentrations) was starting to deteriorate at the late stage of HFHS dieting (Table 1), probably also contributing to the progression of hepatosteatosis as reported previously [42]. Moreover, uncontrolled expression of lipogenesis and gluconeogenesis (as shown by up-regulation of SREBP1c, GSK3βphosphorylation and PEPCK, respectively) in the face of hyperinsulinemia and hyperleptinemia, further exacerbates diabetic dyslipidemia upon prolonged HFHS dieting.
Hepatic gluconeogenesis and lipogenesis are regulated by both the insulin and leptin signal-ing pathways. Indeed, up-regulation of PEPCK and GSK3βphosphorylation were readily ob-servable in the present study throughout the 8-week HFHS feeding. Hepatic glycogen synthase is regulated by phosphorylation of GSK3β, and GSK3 inhibitors could stimulate hepatic glyco-gen synthase [43]. The increased GSK3βphosphorylation in our study indicated that reduced hepatic glycogen synthase also contribute to the hyperglycemia. In addition, the increasing fasting glucose levels may also be caused by diminished glucose utilization in peripheral tissues. Impaired insulin signalling could induce glucose transporters (Gluts) diminution, which limits glucose uptake and contributing to the hyperglycemia [44].
Detailed analysis of the main checkpoints of the respective insulin and leptin signaling path-ways showed that the occurrence of lowered insulin sensitivity was at least 2 weeks earlier than leptin resistance in both hypothalamus and liver. Specifically, STAT3 activation did not occur until prolonged HFHS dieting (4thweek in the liver and 8thweek in hypothalamus) even in the presence of hyperleptinemia (which occurred at 2-week of HFHS dieting) and up-regulation of SOCS3 (which occurred as early as 1stweek HFHS dieting). Although how does the liver or hy-pothalamus maintain a relatively normal STAT3 activation during the early stage of insulin/ leptin resistance is unclear, an anti-steatogenic effect of hepatic STAT3 has been suggested pre-viously [29,45]. The activation of STAT3 has been shown to play a role in the suppression of PEPCK [46] and SREBP1 expression [47]. The observed elevation in PEPCK and SREBP1c ex-pression at late stage of HFHS dieting (Fig. 3C), coinciding with down-regulation of hepatic STAT3 (Fig. 2B), is consistent with an anti-diabetic, anti-steatogenic role of STAT3. Late sup-pression of STAT3 phosphorylation in mice fed with a high-fat diet has been reported previ-ously [28,39,48]. Based on these results, it is tempting to speculate that the cellular
maintenance of STAT3 activation may represent a hepatic protective mechanism that dampens gluconeogenesis and lipogenesis during early stage of insulin/leptin resistance.
These data suggest that SOCS3 and STAT3 regulatory loop was uncoupled initially, leaving a window of opportunity for selective regulation of lipogenesis and gluconeogenesis by the two factors during the early and late stages of leptin/insulin resistance. We hypothesize that the early stage of leptin resistance, manifested by the maintenance of normal STAT3 activity, in the face of up-regulated SOCS3, is probably a compensatory response to the rapidly deteriorat-ed insulin sensitivity under HFHS dieting.
In summary, using HFHS diet-induced NAFLD rat model, we have obtained experimental evidence suggesting that the development of the early stage of NAFLD (without apparent com-plication of inflammation) is a consequence of uncontrolled hepatic lipogenesis and gluconeo-genesis. These metabolic alterations was closely associated with altered insulin/leptin signaling in both hypothalamus and the liver, and the existence of lowered insulin sensitivity and leptin resistance occurred at least 2–3 weeks prior to the manifestation of hepatosteatosis.
Supporting Information
S1 Table. Antibody table. (DOCX)
Acknowledgments
We thank Dongfei Li and Zhimin Mao for animal husbandry and Yang Liu for expert technical assistance.
Author Contributions
Conceived and designed the experiments: GJ LZ. Performed the experiments: LZ HS YG. Ana-lyzed the data: LZ HS ZY. Contributed reagents/materials/analysis tools: LZ HS YG. Wrote the paper: LZ ZY.
References
1. Szczepaniak LS, Nurenberg P, Leonard D, Browning JD, Reingold JS, et al. (2005) Magnetic reso-nance spectroscopy to measure hepatic triglyceride content: prevalence of hepatic steatosis in the gen-eral population. Am J Physiol Endocrinol Metab 288: E462–468. PMID:15339742
2. Chiarelli F, Marcovecchio ML (2008) Insulin resistance and obesity in childhood. Eur J Endocrinol 159 Suppl 1: S67–74. doi:10.1530/EJE-08-0245PMID:18805916
3. de Alwis NM, Day CP (2008) Non-alcoholic fatty liver disease: the mist gradually clears. J Hepatol 48 Suppl 1: S104–112. doi:10.1016/j.jhep.2008.01.009PMID:18304679
4. Tom RZ, Sjogren RJ, Vieira E, Glund S, Iglesias-Gutierrez E, et al. (2011) Increased hepatic insulin sensitivity in mice lacking inhibitory leptin receptor signals. Endocrinology 152: 2237–2246. doi:10. 1210/en.2010-0040PMID:21521753
5. Nobili V, Manco M, Ciampalini P, Diciommo V, Devito R, et al. (2006) Leptin, free leptin index, insulin re-sistance and liver fibrosis in children with non-alcoholic fatty liver disease. Eur J Endocrinol 155: 735– 743. PMID:17062890
6. Huang XD, Fan Y, Zhang H, Wang P, Yuan JP, et al. (2008) Serum leptin and soluble leptin receptor in non-alcoholic fatty liver disease. World J Gastroenterol 14: 2888–2893. PMID:18473416
7. Kim IK, Kim J, Kang JH, Song J (2008) Serum leptin as a predictor of fatty liver in 7-year-old Korean children. Ann Nutr Metab 53: 109–116. doi:10.1159/000165360PMID:18946208
8. Medici V, Ali MR, Seo S, Aoki CA, Rossaro L, et al. (2010) Increased soluble leptin receptor levels in morbidly obese patients with insulin resistance and nonalcoholic fatty liver disease. Obesity (Silver Spring) 18: 2268–2273. doi:10.1038/oby.2010.95PMID:20448542
10. Higuchi T, Shirai N, Saito M, Suzuki H, Kagawa Y (2008) Levels of plasma insulin, leptin and adiponec-tin, and activities of key enzymes in carbohydrate metabolism in skeletal muscle and liver in fasted ICR mice fed dietary n-3 polyunsaturated fatty acids. J Nutr Biochem 19: 577–586. PMID:17911005
11. Hajiaghamohammadi AA, Ziaee A, Oveisi S, Masroor H (2012) Effects of metformin, pioglitazone, and silymarin treatment on non-alcoholic Fatty liver disease: a randomized controlled pilot study. Hepat Mon 12: e6099. doi:10.5812/hepatmon.6099PMID:23087748
12. Fraulob JC, Souza-Mello V, Aguila MB, Mandarim-de-Lacerda CA (2012) Beneficial effects of rosuvas-tatin on insulin resistance, adiposity, inflammatory markers and non-alcoholic fatty liver disease in mice fed on a high-fat diet. Clin Sci (Lond) 123: 259–270. doi:10.1042/CS20110373PMID:22420611
13. Li JM, Li YC, Kong LD, Hu QH (2010) Curcumin inhibits hepatic protein-tyrosine phosphatase 1B and prevents hypertriglyceridemia and hepatic steatosis in fructose-fed rats. Hepatology 51: 1555–1566. doi:10.1002/hep.23524PMID:20222050
14. Bhandari U, Kumar V, Khanna N, Panda BP (2011) The effect of high-fat diet-induced obesity on car-diovascular toxicity in Wistar albino rats. Hum Exp Toxicol 30: 1313–1321. doi:10.1177/
0960327110389499PMID:21075806
15. Guo J, Jou W, Gavrilova O, Hall KD (2009) Persistent diet-induced obesity in male C57BL/6 mice re-sulting from temporary obesigenic diets. PLoS One 4: e5370. doi:10.1371/journal.pone.0005370 PMID:19401758
16. Bjorbak C, Lavery HJ, Bates SH, Olson RK, Davis SM, et al. (2000) SOCS3 mediates feedback inhibi-tion of the leptin receptor via Tyr985. J Biol Chem 275: 40649–40657. PMID:11018044
17. Hubschle T, Thom E, Watson A, Roth J, Klaus S, et al. (2001) Leptin-induced nuclear translocation of STAT3 immunoreactivity in hypothalamic nuclei involved in body weight regulation. J Neurosci 21: 2413–2424. PMID:11264315
18. Banks AS, Davis SM, Bates SH, Myers MG Jr (2000) Activation of downstream signals by the long form of the leptin receptor. J Biol Chem 275: 14563–14572. PMID:10799542
19. Bates SH, Stearns WH, Dundon TA, Schubert M, Tso AW, et al. (2003) STAT3 signalling is required for leptin regulation of energy balance but not reproduction. Nature 421: 856–859. PMID:12594516
20. Morris DL, Rui L (2009) Recent advances in understanding leptin signaling and leptin resistance. Am J Physiol Endocrinol Metab 297: E1247–1259. doi:10.1152/ajpendo.00274.2009PMID:19724019
21. Huynh FK, Levi J, Denroche HC, Gray SL, Voshol PJ, et al. (2010) Disruption of hepatic leptin signaling protects mice from age- and diet-related glucose intolerance. Diabetes 59: 3032–3040. doi:10.2337/ db10-0074PMID:20876720
22. Huynh FK, Neumann UH, Wang Y, Rodrigues B, Kieffer TJ, et al. (2013) A role for hepatic leptin signal-ing in lipid metabolism via altered very low density lipoprotein composition and liver lipase activity in mice. Hepatology 57: 543–554. doi:10.1002/hep.26043PMID:22941940
23. Tartaglia LA, Dembski M, Weng X, Deng N, Culpepper J, et al. (1995) Identification and expression cloning of a leptin receptor, OB-R. Cell 83: 1263–1271. PMID:8548812
24. Huang W, Dedousis N, Bandi A, Lopaschuk GD, O'Doherty RM (2006) Liver triglyceride secretion and lipid oxidative metabolism are rapidly altered by leptin in vivo. Endocrinology 147: 1480–1487. PMID: 16339207
25. Fishman S, Muzumdar RH, Atzmon G, Ma X, Yang X, et al. (2007) Resistance to leptin action is the major determinant of hepatic triglyceride accumulation in vivo. FASEB J 21: 53–60. PMID:17099068
26. Yue JT, Lam TK (2012) Lipid sensing and insulin resistance in the brain. Cell Metab 15: 646–655. doi: 10.1016/j.cmet.2012.01.013PMID:22560217
27. Kanu A, Fain JN, Bahouth SW, Cowan GS Jr (2003) Regulation of leptin release by insulin, glucocorti-coids, G(i)-coupled receptor agonists, and pertussis toxin in adipocytes and adipose tissue explants from obese humans in primary culture. Metabolism 52: 60–66. PMID:12524663
28. Sachithanandan N, Fam BC, Fynch S, Dzamko N, Watt MJ, et al. (2010) Liver-specific suppressor of cytokine signaling-3 deletion in mice enhances hepatic insulin sensitivity and lipogenesis resulting in fatty liver and obesity. Hepatology 52: 1632–1642. doi:10.1002/hep.23861PMID:20799351
29. Inoue H, Ogawa W, Ozaki M, Haga S, Matsumoto M, et al. (2004) Role of STAT-3 in regulation of hepat-ic gluconeogenhepat-ic genes and carbohydrate metabolism in vivo. Nat Med 10: 168–174. PMID:14716305
30. Biddinger SB, Hernandez-Ono A, Rask-Madsen C, Haas JT, Aleman JO, et al. (2008) Hepatic insulin resistance is sufficient to produce dyslipidemia and susceptibility to atherosclerosis. Cell Metab 7: 125–134. doi:10.1016/j.cmet.2007.11.013PMID:18249172
32. Kleiner DE, Brunt EM, Van Natta M, Behling C, Contos MJ, et al. (2005) Design and validation of a his-tological scoring system for nonalcoholic fatty liver disease. Hepatology 41: 1313–1321. PMID: 15915461
33. Xing LJ, Zhang L, Liu T, Hua YQ, Zheng PY, et al. (2011) Berberine reducing insulin resistance by up-regulating IRS-2 mRNA expression in nonalcoholic fatty liver disease (NAFLD) rat liver. Eur J Pharma-col 668: 467–471. doi:10.1016/j.ejphar.2011.07.036PMID:21839075
34. Yang Z, Hulver M, McMillan RP, Cai L, Kershaw EE, et al. (2012) Regulation of insulin and leptin signal-ing by muscle suppressor of cytokine signalsignal-ing 3 (SOCS3). PLoS One 7: e47493. doi:10.1371/journal. pone.0047493PMID:23115649
35. El-Haschimi K, Pierroz DD, Hileman SM, Bjorbaek C, Flier JS (2000) Two defects contribute to hypo-thalamic leptin resistance in mice with diet-induced obesity. J Clin Invest 105: 1827–1832. PMID: 10862798
36. Yang G, Lim CY, Li C, Xiao X, Radda GK, et al. (2009) FoxO1 inhibits leptin regulation of pro-opiomela-nocortin promoter activity by blocking STAT3 interaction with specificity protein 1. J Biol Chem 284: 3719–3727. doi:10.1074/jbc.M804965200PMID:19049975
37. Ueki K, Kondo T, Kahn CR (2004) Suppressor of cytokine signaling 1 (SOCS-1) and SOCS-3 cause in-sulin resistance through inhibition of tyrosine phosphorylation of inin-sulin receptor substrate proteins by discrete mechanisms. Mol Cell Biol 24: 5434–5446. PMID:15169905
38. Rui L, Yuan M, Frantz D, Shoelson S, White MF (2002) SOCS-1 and SOCS-3 block insulin signaling by ubiquitin-mediated degradation of IRS1 and IRS2. J Biol Chem 277: 42394–42398. PMID:12228220
39. Metlakunta AS, Sahu M, Sahu A (2008) Hypothalamic phosphatidylinositol 3-kinase pathway of leptin signaling is impaired during the development of diet-induced obesity in FVB/N mice. Endocrinology 149: 1121–1128. PMID:18048492
40. Barthel A, Schmoll D, Unterman TG (2005) FoxO proteins in insulin action and metabolism. Trends Endocrinol Metab 16: 183–189. PMID:15860415
41. Kim MS, Pak YK, Jang PG, Namkoong C, Choi YS, et al. (2006) Role of hypothalamic Foxo1 in the reg-ulation of food intake and energy homeostasis. Nat Neurosci 9: 901–906. PMID:16783365
42. Fabbrini E, Sullivan S, Klein S (2010) Obesity and nonalcoholic fatty liver disease: biochemical, meta-bolic, and clinical implications. Hepatology 51: 679–689. doi:10.1002/hep.23280PMID:20041406
43. Cline GW, Johnson K, Regittnig W, Perret P, Tozzo E, et al. (2002) Effects of a novel glycogen synthase kinase-3 inhibitor on insulin-stimulated glucose metabolism in Zucker diabetic fatty (fa/fa) rats. Diabetes 51: 2903–2910. PMID:12351425
44. Lacombe VA (2014) Expression and regulation of facilitative glucose transporters in equine insulin-sen-sitive tissue: from physiology to pathology. ISRN Vet Sci 2014: 409547. doi:10.1155/2014/409547 PMID:24977043
45. Horiguchi N, Wang L, Mukhopadhyay P, Park O, Jeong WI, et al. (2008) Cell type-dependent pro- and anti-inflammatory role of signal transducer and activator of transcription 3 in alcoholic liver injury. Gastroenterology 134: 1148–1158. doi:10.1053/j.gastro.2008.01.016PMID:18395093
46. Wang H, Lafdil F, Kong X, Gao B (2011) Signal transducer and activator of transcription 3 in liver dis-eases: a novel therapeutic target. Int J Biol Sci 7: 536–550. PMID:21552420
47. Ueki K, Kondo T, Tseng YH, Kahn CR (2004) Central role of suppressors of cytokine signaling proteins in hepatic steatosis, insulin resistance, and the metabolic syndrome in the mouse. Proc Natl Acad Sci U S A 101: 10422–10427. PMID:15240880
48. Martin TL, Alquier T, Asakura K, Furukawa N, Preitner F, et al. (2006) Diet-induced obesity alters AMP kinase activity in hypothalamus and skeletal muscle. J Biol Chem 281: 18933–18941. PMID: 16687413