Cop
yright
© ABE&M t
odos os dir
eit
os r
eser
vados
.
Cop
yright
© ABE&M t
odos os dir
eit
os r
eser
vados
.
Obesity, insulin resistance and
comorbidities – Mechanisms
of association
Obesidade, resistência à insulina e comorbidades – Mecanismos de associação
Ana Valeria B. Castro1, Cathryn M. Kolka2, Stella P. Kim2, Richard N. Bergman2
ABSTRACT
Overall excess of fat, usually deined by the body mass index, is associated with metabolic (e.g. glucose intolerance, type 2 diabetes mellitus (T2DM), dyslipidemia) and non-metabolic disor-ders (e.g. neoplasias, polycystic ovary syndrome, non-alcoholic fat liver disease, glomerulopa-thy, bone fragility etc.). However, more than its total amount, the distribution of adipose tissue throughout the body is a better predictor of the risk to the development of those disorders. Fat accumulation in the abdominal area and in non-adipose tissue (ectopic fat), for example, is associated with increased risk to develop metabolic and non-metabolic derangements. On the other hand, observations suggest that individuals who present peripheral adiposity, characte-rized by large hip and thigh circumferences, have better glucose tolerance, reduced incidence of T2DM and of metabolic syndrome. Insulin resistance (IR) is one of the main culprits in the association between obesity, particularly visceral, and metabolic as well as non-metabolic dise-ases. In this review we will highlight the current pathophysiological and molecular mechanisms possibly involved in the link between increased VAT, ectopic fat, IR and comorbidities. We will also provide some insights in the identiication of these abnormalities. Arq Bras Endocrinol Metab. 2014;58(6):600-9
Keywords
Obesity; fat distribution; visceral fat; ectopic fat; insulin resistance; metabolic syndrome
RESUMO
Excesso de gordura, geralmente deinido pelo índice de massa corporal, está associado a dis-túrbios metabólicos (p. ex., intolerância à glicose, diabetes melito tipo 2 (DM2), dislipidemia) e não metabólicos (p. ex., neoplasias, síndrome dos ovários policísticos, esteatose hepática não alcoólica, glomerulopatia, fragilidade óssea etc.). No entanto, mais do que sua quantidade total, a forma da distribuição corporal de tecido adiposo constitui-se em um melhor indicador de risco para o desenvolvimento de tais doenças. O acúmulo de gordura na região abdominal e em tecido não adiposo (gordura ectópica), por exemplo, está associado ao aumento de risco para distúrbios metabólicos e não metabólicos. Por outro lado, observações sugerem que os indivíduos que apresentam adiposidade periférica, caracterizada por aumento das circunfe-rências dos quadris e da coxas, têm melhor tolerância à glicose, redução das incidências de DM2 e da síndrome metabólica. Uma das alterações subjacentes na relação entre a obesidade, particularmente a visceral, e os distúrbios citados é a resistência à insulina. Nesta revisão, enfa-tizaremos os mecanismos isiopatológicos e moleculares possivelmente implicados na ligação entre o aumento das gorduras visceral e ectópica, IR e comorbidades. Também mencionaremos os métodos diagnósticos mais frequentemente usados na identiicação dessas anormalidades.
Arq Bras Endocrinol Metab. 2014;58(6):600-9
Descritores
Obesidade; distribuição de gordura; gordura visceral; gordura ectópica; resistência à insulina; síndrome metabólica 1 Departamento de Clínica
Médica, Divisão de Endocrinologia e Metabolismo, FMRP-USP, Ribeirão Preto, SP, Brazil
2 Diabetes and Obesity Research
Institute, Cedars Sinai Medical Center, Los Angeles, CA, USA
Correspondence to: Ana Valeria B. Castro
Centro Universitário Barão de Mauá, Departamento de Clínica Médica, Divisão de Endocrinologia e Metabolismo,
Faculdade de Medicina, Universidade de São Paulo, Ribeirão Preto, SP, Brazil [email protected]
Received on Jan/13/2014 Accepted on Mar/30/2014
Cop
yright
© ABE&M t
odos os dir
eit
os r
eser
vados
.
INTRODUCTION
O
verall excess of fat, usually deined by the body mass index (BMI), has long been recognized as a risk factor for metabolic related diseases, such as cardiovascular diseases (CVD), type 2 diabetes mellitus(T2DM), bone fragility as well as non-metabolic de-rangements such as non-alcoholic fat liver disease, neo-plasias, polycystic ovary syndrome, glomerulopathy, among others (1-6). However, several observations underscored that, more than the excess of fat itself, the distribution of fat, especially in the central regions of the body (also referred to as visceral, omental or intra-abdominal fat) plays an important role in these asso-ciations (2,7-9). Conversely, peripheral adiposity, cha-racterized by large hips and thighs circumferences, has been associated with a better metabolic proile (10,11). The advance in imaging methods allowed not solely to conirm those previous anthropometric-based obser-vations but to attempt discriminating which component of the abdominal fat were more predictive of the afore-mentioned comorbidities (12-15). Those studies showed that although subcutaneous adipose tissue (SAT) is an important determinant of metabolic risk, visceral adipose tissue (VAT) could be a stronger player (14,16).
The link between obesity and the development of IR has been well documented. In African-Americans, for example, it has been observed that both increased abdominal SAT and VAT are strongly correlated with insulin resistance (16). Other studies, however, have shown that individuals with central obesity have higher incidence of insulin resistance than those with subcu-taneous obesity (14,15). In fact, some authors believe that insulin resistance (IR) is the main culprit in the as-sociation between visceral obesity and metabolic as well as non-metabolic diseases (17).
Moreover, it has also been shown that the presence of fat in ectopic sites such as liver, muscle, pancreas, kidney etc. either alone or in association with increased visceral fat, was also an independent determinant of the development of IR and associated comorbidities (3,6). Factors that contribute to the preferential accumu-lation of fat in certain body regions as well to the devel-opment of insulin resistance involve modiiable (physi-cal activity levels, nutritional surplus, hormonal status) and non-modiiable factors (age, gender, genetic pre-disposition and ethnic background) (1,12).
The exact role that adipose tissue, and particulari-ties in its distribution, may play in the pathogenesis of
IR has not yet been fully elucidated. In this review, we will highlight the current mechanisms believed to be in-volved in the link between increased VAT, ectopic fat, IR and associated comorbidities. We will also provide some insights in the identiication of these abnormalities.
ADIPOSE TISSUE DISTRIBUTION ABNORMALITIES –
CLINICAL RELEVANCE
Clinical observations show that disregarding the BMI, either normal-weight or obese individuals may present a healthy or an unhealthy metabolic proile. Accordingly to both BMI and metabolic proile, individuals may be classiied in the following phenotypes: 1) lean and heal-thy, 2) lean and unhealthy (also known as thin outside, fat inside or metabolically obese but normal weight), 3) obese and unhealthy and 4) obese and healthy (also coined as metabolically healthy obese or insulin-sensitive obese) (9,18-20). Some of the main features that dis-tinguish metabolically healthy or unhealthy phenotypes include increased VAT, ectopic fat deposition and insulin resistance in the latter phenotype, which impose on them a higher risk for metabolic and non-metabolic comorbi-dities than their metabolically healthy counterparts (21).
Lipodystrophic patients who present partial or total loss of SAT (acquired or inherited) and more VAT and ectopic fat accumulation are also more insulin-resistant and more prone to metabolic and non-metabolic co-morbidities (22,23). On the other hand, other group comprising patients with predominant subcutaneous fat accumulation, frequently extensive and deforming (multiple symmetric lipomatosis, lipedema and Der-cum’s disease) usually present a metabolically healthier proile (21,24,25). These clinical situations corrobo-rate the possibility of a protective role of accumulation of fat in SAT for a healthier metabolic proile, in oppose to the accumulation of fat in VAT or in ectopic sites.
ADIPOSE TISSUE – AN OVERVIEW
Cop
yright
© ABE&M t
odos os dir
eit
os r
eser
vados
.
intake and cold, sympathetic activation, hormones such as irisin, released by the muscle etc. (31,32).
INSULIN RESISTANCE – AN OVERVIEW
Detailed description of insulin action is out of the scope of this review and has been reviewed elsewhere (34,35).
Insulin resistance is characterized by the impair-ment of insulin action. Classically, the insulin-resistant state is deined by the impairment of glucose uptake in muscle and the increment of endogenous glucose pro-duction by the liver resulting in hyperglycemia, both in fasting and postprandial states. However, in a broader sense, the insulin resistant state is also characterized by the impairment of insulin action on lipid metabolism (e.g. increment of lipolysis in adipocytes) or on pro-tein metabolism (e.g. impairment of protein synthesis in muscle, predisposing to sarcopenia). Also, IR affects the function of other organs such as vessels (leading to vasoconstriction/hypertension); brain (resulting in in-creased caloric intake); pancreas (dein-creased in beta-cell mass and in glucose sensing); bone (possibly decreasing bone mass and strength) among others effects (4,33).
Notably, the cellular mitogenic effect of insulin is preserved in insulin resistant states leading to cell growth (e.g. acantosis nigricans, predisposition to cancer). More-over, the insulin may bind to other receptors such as the IGF-1 receptor in the cartilage (promoting acromega-loid features), or in the theca cell in the ovary (leading to excessive androgen production and secretion, hirsutism and polycystic ovary syndrome) (1,4,36,37).
The mechanisms involved in the etiopathogenesis of insulin resistance related to obesity encompass pre-re-ceptor, receptor and postreceptor defects characterized, for example, by decreased access of insulin to muscle secondary to FFA excess (pre-receptor), insulin recep-tor downregulation secondary to hyperinsulinemia (receptor) and inhibition of the intracellular cascades by several adiposity-related factors (e.g. increased FFA, impaired adipokines and/or cytokines secretion) (post receptor) (36). All these aspects are discussed further and are depicted in igure 2.
CENTRAL OBESITY, INSULIN RESISTANCE
AND COMORBIDITIES – MECHANISMS OF
ASSOCIATION
Pathophysiological mechanisms (Figure 2)
It is uncertain how obesity results in insulin resistance; however, several factors have been implicated as playing a pivotal role, as described in the following sections and depicted in igure 2.
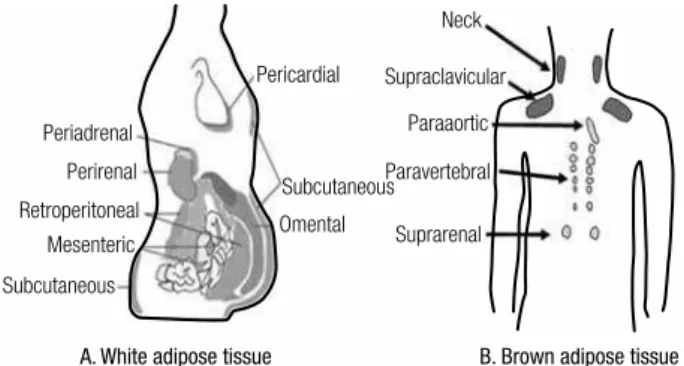
Figure 1. Classiication of fat and distribution of white adipose tissue (WAT) and brown adipose tissue (BAT) – (A) WAT is classiied in subcutaneous adipose tissue (SAT) and internal adipose tissue. SAT is further subdivided in supericial and deep adipose tissue. Internal adipose tissue is comprised by intrathoracic (e.g. pericardial) and visceral adipose tissue (VAT). The latter is further compartmentalized in intraperitoneal fat (greater omentum and mesenteric) and extraperitoneal fat (pre and retroperitoneal). (B) BAT is found along vessels (aorta, carotid, coronary arteries etc.), neck, interscapular and supraclavicular regions, axilla, abdominal wall, inguinal fossa and muscle (not shown). (A – adapted from Cook A. and Cowan C., Adipose (2009)- doi/10.3824/stembook.1.40.1, B – adapted from Awada R, Parimisetty A, Lefebvre d’Hellencourt C (2013)- doi/10.5772/5367).
Periadrenal
Pericardial
Subcutaneous
Omental Suprarenal Paravertebral
Paraaortic Supraclavicular
Neck
Perirenal
Retroperitoneal Mesenteric
Subcutaneous
A. White adipose tissue B. Brown adipose tissue
Adipose tissue has two important features: capacity to expand and plasticity. Expandability relects the abil-ity of adipose tissue to store lipid, either by the increase of adipocyte size (hypertrophy) and/or by the differ-entiation or adipogenesis (hyperplasia) of pre-existing adipocytes. As obesity progresses, hypertrophy occurs and reaches a plateau (as observed in massively obese patients). Then, the presence of large adipocytes may recruit new cells triggering adipocytes hyperplasia. One of the characteristic of VAT is its lower proliferation rate and differentiation capacity which leads to growth mainly by hypertrophy, which renders impaired adipo-cyte functions. On the other hand, SAT (mainly lower body) grows mainly by hyperplasia; however when adi-pogenesis is limited, hypertrophic dysfunctional adipo-cytes will take place. Whenever the capacity to expand of both compartments is surpassed, lipid spills over to ectopic sites (non-adipose tissues) (1,33).
Cop
yright
© ABE&M t
odos os dir
eit
os r
eser
vados
.
Dysfunctional adipose tissue
Adipocytes and adipose tissue are key players in the pathogenesis of insulin resistance associated with obe-sity. Hypertrophic dysfunctional adipocytes, mainly encountered in VAT and upper body SAT, are highly lipolytic resulting in enhanced free fatty acids (FFA) re-lease as well as in impaired secretion of adipokines
(in-creased leptin and resistin, de(in-creased adiponectin etc.) into the circulation.
Two main hypotheses, not mutually exclusive, ex-plain how elevated FFA may be associated with central obesity and IR: the portal hypothesis and the spillover (or ectopic fat) hypothesis. Accordingly to the portal theory an increase in central abdominal fat tissue leads to an elevation of the delivery of FFA to the liver through Figure 2. Summary of the pathophysiological mechanisms associated with the development of insulin resistance associated with obesity and comorbidities – Hormonal status (e.g. menopause), aging, gender, genetic susceptibility and ethnic background interact with lifestyle factors to predispose to the increase of VAT/ectopic fat and the development of IR. Energy surplus secondary to nutritional factors (e.g. high energy food intake) associated with low physical activity levels lead to an increase in SAT/VAT. When the capacity of these tissues to expand becomes saturated (obesity) or limited (lipodystrophy), lipids spill over to non-adipose tissue sites (ectopic fat deposition). Fat growth by hypertrophy generates dysfunctional adipocytes that are more resistant to insulin’s antilipolytic effect and present impaired secretion of cytokines/adipokines (e.g. decreased adiponectin, increased TNFalpha and IL-6). Consequently, FFA and cytokines are released into the circulation. The surplus of FFA to the cells is oxidized, stored (lipids droplets) or metabolized into toxic derivatives (DAG and ceramides). These toxic derivatives lead to insulin resistance, impair cell function (lipotoxicity) or lead to apoptosis (lipoapoptosis). In the pancreas these toxic effects lead to decreased number and impaired capacity of β-cells to secrete insulin, predisposing to the development of type 2 diabetes mellitus; in the liver it leads to non-alcoholic steatohepatitis and subsequently to cirrhosis; in the muscle, to sarcopenia; in the kidney to glomerulopathy etc. Cell dysfunction and death elicit macrophage iniltration, and local and systemic inlammation. In addition, the secretion of inlammatory molecules into the circulation also impairs intracellular insulin signaling. The consequent insulin resistance increases endogenous glucose production by the liver and decreases glucose utilization by peripheral tissues (e.g. muscle). Consequently, glycemia rises and promotes increase in insulin secretion by the pancreas. In addition, hepatic insulin clearance is impaired contributing to hyperinsulinemia, which promotes down regulation of insulin receptor. Among several effects, hyperinsulinemia promotes cell growth (e.g. acanthosis nigricans, neoplasias) and leads to endothelial dysfunction (increased vasoconstriction).
SAT: subcutaneous adipose tissue; VAT: visceral adipose tissue; BAT: brown adipose tissue; FFA: free fatty acids; mj-macrophage; TG: triglycerides; SNS: sympathetic nervous system; DM: type 2 diabetes mellitus; DAG: diacylglycerol; NAFLD: non-alcoholic fatty liver disease; PCOS: polycystic ovary syndrome; HBP: high blood pressure.
Nutritional factors Energy surplus Physical activity level
SNS HPA impairment BAT activity
Obesity – adipocyte saturation Lipodystrophy – adipogenesis
Dysfunctional adipocytes (hypertrophic)
Impaired secretion
cytokines/adipokines Apoptosis mΦ iniltration
Lipolysis Portal/systemic FFA FFA spillover Storage capacity
Adipocyte hyperplasia
Hyperinsulinemia FFA
SNS Insulin resistance
SNS
Steatosis/apoptosis Hyperinsulinemia
Portal/systemic Inlammation
Neoplasia Glomerulopathy
PCOS
Vessels Endothelial dysfunction Insulin access
Muscle
Glucose uptake
Sarcopenia Insulin secretion
Glucose intolerance/DM/Dislipidemia Insulin secretion
Pancreas
β-cell failure
Cardiovascular risk
Genetic susceptibility/ethnic background Gender
Aging Homones
Lipid droplets FFA-derivatives-DAG/ceramides
Lipotoxicity Lipoapoptosis Ectopic fat accumulation
Liver
NAFLD Cirrhosis TG secretion
SAT
VAT
Insulin clearance
Cop
yright
© ABE&M t
odos os dir
eit
os r
eser
vados
.
its portal vein drainage; consequently, hepatic insulin re-sistance issues, thereby driving glucose production up-ward (38). Recently, some authors suggest that, at least as much as the elevation of portal FFA, inlammatory cytokines, released by visceral fat into the portal vein also cause hepatic (as well as systemic) IR (39).
Accordingly to the “spillover hypothesis”, in face of positive energy balance, a reduced or limited ability of adipose tissue to expand (especially the peripheral subcutaneous compartment) would lead to a spillover of FFA to the visceral fat compartment and to non-ad-ipose tissues (e.g. liver, muscle, pancreas, kidney, bone) (4,6,40). Consequent to the limited ability of non-adi-pose tissue to oxidize and/or to store FFA, ectopic ac-cumulation of FFA and/or its metabolic active deriva-tives would lead to IR as well as cell lipotoxicity and apoptosis compromising the function of the involved organs (40).
Moreover, hypertrophic adipocytes may lead to lo-cal hypoxia driving endoplasmic reticulum (ER) stress, adipocyte death and macrophage iniltration. The latter event increases the secretion of inlammatory cytokines, such TNF-α and interleukin (IL)-6 and monocytes chemoattractant protein (MCP)-1 which lead to local and systemic low grade inlammation (1,12) and the consequent impairment of insulin signaling.
Decreased insulin clearance/hyperinsulinemia
Insulin blood levels result from a balance between insu-lin production by the pancreas and its clearance main-ly by the liver as well other sites (kidney, muscle and adipose tissue) (41,42). Insulin clearance occurs by the uptake and the degradation of insulin in many tissues. In the liver, insulin uptake is mainly receptor-mediated. Both uptake and degradation are regulated by many factors, including increased FFA that inhibits those processes (36).
In the obesity state, hyperinsulinemia ensues both due to increased production of insulin induced by the excess of fatty-acid and glucose as well as by the de-crease of insulin clearance by the liver (and possibly kidney and other sites) (36). Hyperinsulinemic states, promote downregulation of insulin receptors leading to a decrease of insulin removal from circulation. Hy-perinsulinemia also promotes insulin resistance due to a negative feedback loop that inhibits IRS-1/2 (36).
Decreased insulin clearance is also mediated by im-pairments of CEACAM1 expression, a key regulator of hepatic insulin clearance that is ubiquitously present
in the body. In diet-induced obese dogs, it has been demonstrated that prospective changes in CEACAM1 tracks alterations in insulin clearance (43).
Recently, the results from a large cohort study in dogs, emphasized the importance of insulin clearance as the primary determinant of insulin sensitivity under baseline, overnight-fasted conditions (41). The authors proposed that insulin clearance impairment could be the primary defect leading to insulin resistance.
Abnormalities in the hypothalamus-pituitary-adrenal-fat axis
Similarities between metabolic derangements and in-sulin resistance associated with glucocorticoid excess states and obesity are well known. However, the me-chanisms involved in these similarities are still a matter of debate (1,44).
Excess of cortisol, as seen in Cushing syndrome and chronic stress, is associated with the development of abdominal obesity, insulin resistance and metabolic disorders. Conversely, abdominally obese subjects may also present abnormalities of hypothalamus-pituitary-adrenal axis such as abnormal diurnal variation of cor-tisol, lack of meal response to cortisol etc. In addition, it has been also shown that visceral fat is more sensitive to the action of cortisol (44).
On the other hand, besides the effect of the sys-temic cortisol on the adipocytes, it has been shown that visceral fat also produces cortisol. The paracrine action of cortisol in the adipocyte may interfere with several aspect of adipose tissue by increasing adipogenesis, al-tering adipocyte metabolism (e.g. increasing or decreas-ing lipolysis), impairdecreas-ing adipokines secretion besides promoting IR (1,44).
Sympathetic nervous system (SNS) overdrive
High levels of circulating catecholamines lead to insulin resistance (45). One of the outcomes of increased adre-nergic outlow is increased lipolysis which promotes excessive inlux of FFA to the cells. Obesity, especially visceral, is associated with increased SNS activity.
Activation of SNS has also been implicated in the transdifferentiation of WAT into BAT. Absence of ca-techolaminergic receptors has been associated with de-creased BAT activity and development of obesity (31).
Cop
yright
© ABE&M t
odos os dir
eit
os r
eser
vados
.
Decreased brown or beige adipocytes
Activity of BAT is negatively correlated with age and BMI. In human, it has been shown that cold-induced activity of BAT is reduced with age, and that ucp1 ex-pression is decreased in the subcutaneous WAT in obe-se and diabetic patients (27,29). It has been shown that the decrease of BAT is associated with insulin resistance and hyperglycemia in older mice. However, the role of BAT in the pathogenesis of IR in humans is still spe-culative.
Molecular mechanisms (Figure 3)
The following molecular mechanisms, summarized in igure 3, have been implicated in the development of IR associated with obesity:
Lipotoxicity/lipoapoptosis
Lipotoxicity is a morphological and functional impairment of non-adipose tissue caused by toxic reactions seconda-ry to intracellular accumulation of lipids and their deri-vatives that may lead to cell death (lipoapoptosis) (47).
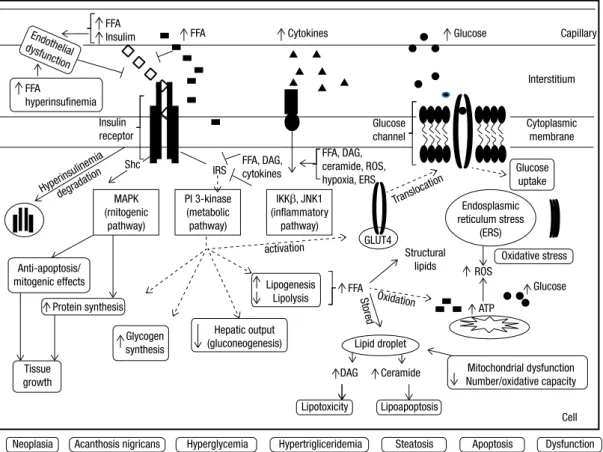
Figure 3. Summary of the main putative molecular mechanisms involved in the development of insulin resistance associated with obesity in a hypothetical cell (e.g. hepatocyte, myocyte, adipocyte) – Insulin resistance associated with obesity, especially central, occurs due to pre-receptor, receptor and/or post-receptor impairments, mainly secondary to elevated FFA, hyperinsulinemia and increased cytokines. Insulin access to the interstitial space (pre-receptor impairment) may be induced by the excess of FFA and their metabolites as well by endothelial dysfunction secondary to increased circulating insulin. Hyperinsulinemia, secondary to the decrease of FFA-induced insulin clearance and the increase of insulin secretion, causes downregulation of insulin receptors (receptor impairment). In addition, insulin receptor downstream signaling (post-receptor impairment) is inhibited by FFA and cytokines. Increased intracellular FFA also contribute to excessive production of ATP, oxidative stress and mitochondrial dysfunction, production of reactive oxidative species, endoplasmic reticulum stress and lipid storage and accumulation of non-oxidative toxic derivatives (dyacylgycerol and ceramide). The aforementioned factors also activate inlammation pathways. Independently of the upstream or downstream level of the insulin receptor impairment, insulin resistance occurs by the inhibition of the phosphorylation of the insulin receptor substrates (IRS-1 or 2) and the subsequent inhibition of PI3K pathway, responsible for metabolic effects. Consequently to this inhibition occurs 1) decrease in the activation of GLUT-4 which impairs glucose uptake; 2) increase of glucose production by the liver (either by inhibiting glucogenesis and/or promoting glycogenolysis) and 3) increase of de novo lipogenesis, storage of lipid (lipid droplets) and toxic derivatives. On the other hand, the insulin receptor substrate, Shc, is spared from inhibition by FFA or cytokines and is stimulated by hyperinsulinemia. Consequently, MAPK pathway (mitogenic) is activated leading to anti-apoptotic and proliferation effects, culminating with tissue growth. Metabolic and non-metabolic consequences of IR and ectopic accumulation of fat are: hyperglycemia, hypertriglyceridemia, acanthosis nigricans, neoplasias, steatosis, cell growth or apoptosis or cell dysfunction.
FFA: free fatty acids; IRS: insulin receptor substrates; MAPK: mitogen-activated protein kinase; PI3K: phosphoinositide 3-kinase; DAG: dyacylgycerol; ROS: reactive oxidative species; ERS: endoplasmic reticulum stress, AN: acanthosis nigricans.
Capillary
Interstitium
Cytoplasmic membrane Glucose
channel
Glucose uptake
Endosplasmic reticulum stress
(ERS) GLUT4
IKKβ, JNK1 (inflammatory
pathway) FFA, DAG, ceramide, ROS, hypoxia, ERS FFA, DAG,
cytokines IRS
Shc Insulin receptor
Structural lipids
FFA
DAG Ceramide Lipid droplet
Transloca tion
Oxidation
activation
Stored
Glucose Cytokines
FFA FFA
Insulim
Endothelial dysfunction
FFA
hyperinsufinemia
Oxidative stress
Glucose ROS
ATP
Lipoapoptosis
Dysfunction Apoptosis
Steatosis Hypertrigliceridemia
Hyperglycemia Acanthosis nigricans
Neoplasia
Lipotoxicity Protein synthesis
Mitochondrial dysfunction Number/oxidative capacity
Cell Hepatic output
(gluconeogenesis) Glycogen
synthesis
Lipogenesis Lipolysis PI 3-kinase
(metabolic pathway) MAPK
(rnitogenic pathway)
Hyperinsulinemia degrada
tion
Anti-apoptosis/ mitogenic effects
Cop
yright
© ABE&M t
odos os dir
eit
os r
eser
vados
.
Physiologically, when supplied to the cells, FFA is utili-zed to produce structural lipids and is disposed by mi-tochondrial oxidation (resulting in the production of ATP and heat), and/or by storage as triglyceride-illed (lipid) droplets and it (47,48). During FFA surplus sta-tes, the limited ability of non-adipose tissue to oxidize fat, promotes excessive β-oxidation of lipids leading to mitochondrial dysfunction as well as excessive accumu-lation of lipid droplets. Moreover, the limited capacity of non-adipose tissue to store fat activates non-oxidative pathways of FFA metabolism resulting in the accumu-lation of FFA-derivatives such as dyacylglycerol (DAG) and ceramides (47,49). Besides its local production, cir-culating DAG may also contribute to lipotoxicity (26). FFA per se and the intracellular accumulation of some species of DAG leads to the impairment of insulin action directly by inhibition of downstream pathways of insulin signaling (47,49). Accumulation of ceramide, a pro-apoptotic lipid, leads to cell death. Accordingly to the respective tissue, ceramide may ultimately con-tribute to sarcopenia, heart failure, β-cell mass decline, cirrhosis, glomerulopathy etc. (6,47).
Although the ectopic deposition of FFA within the tissue or the cell (lipid droplets) is of major importance when considering the links between obesity, dyslipide-mia, insulin resistance and comorbidities, some authors suggest that the ectopic lipid droplet accumulation it-self is not harmful to the cell, but it is rather a marker of excessive fuel availability (47). They argue that the toxic FFA-derivative accumulation, originated from non-oxidative metabolism of excessive intracellular lip-ids, may actually be the actual culprit linking fat distri-bution abnormalities, insulin resistance and associated disorders.
Endoplasmic reticulum stress (ERS)
In the presence of several stimuli, such as excess of li-pids and glucose (as well as nutrient deprivation) and hypoxia, the ability of endoplasmic reticulum (ER) to fold proteins becomes impaired. This results in the ac-cumulation of misfolded or unfolded proteins that eli-cits ERS. The aim of ERS is to stop translation of the misfolded protein and activate molecular processes to fold them, preventing any further ER stress. When this aim is not achieved ERS elicits reactive oxygen species (ROS) accumulation, inlammatory response, cellular metabolic dysfunction and apoptosis. In target tissues for example, ERS may culminate with insulin and leptin resistance and decreased insulin secretion (49).
Decreased fat oxidation capacity
Adipose tissue is a key player in controlling oxidative capacity of other organs, such as muscle, through the production and secretion of adipokines, such as leptin, adiponectin and TNFα (47,49). It has been suggested that subjects that have an increased muscle capacity to oxidize FFA are less susceptible to obesity. On the other hand, it has been shown that reduction of the capacity of skeletal muscle to oxidize FFA is associated with insulin resistance (50).
Sarcopenia associated with aging and lack of exercise is one factor leading to decreased FFA oxidative capacity and fat accumulation (18,50). On the other hand, the increment of oxidative capacity by physical activity or pharmacological intervention (metformin, glitazones, leptin) also improves insulin sensitivity (42,51).
Mitochondrial dysfunction
Human and experimental studies have suggested that mitochondrial dysfunction is involved in the pathoge-nesis of insulin resistance and ectopic accumulation of fat (26). However, the direction of the relationship is still unclear; it may be cause or consequence of insulin resistance (6,36).
Excessive supply of substrate to the cell may over-whelm the capacity of the mitochondria to oxidize nu-trients, diverting the substrate to de novo lipogenesis and predisposing to the production of ROS (26). The surplus of lipids to liver, muscle, and brown fat over activates mitochondrial function to enhance energy dis-posal, promoting the production of high levels of ATP. As a protective mechanism against excessive ATP levels, intracellular energy accumulation ultimately leads to the inhibition of insulin-induced glucose uptake response in those tissues (49). A reduction of mitochondrial ca-pacity of fat oxidation may also accelerate deposition of ectopic fat and their deleterious metabolites ultimately resulting in inhibition of insulin signaling (26,36,52).
Oxidative stress
Cop
yright
© ABE&M t
odos os dir
eit
os r
eser
vados
.
increased lipid peroxidation and protein misfolding (leading to endoplasmic reticulum stress) occur, ulti-mately leading to DNA and cellular damage and/or metabolic dysfunction (1).
FAT DISTRIBUTION ASSESSMENT
It has become evident that assessments of total, regio-nal and ectopic adiposity are important for predicting cardiometabolic risk, for identifying the fat distribu-tion phenotype as well as for obesity treatment follow up. Several publications have discussed in details the methods used to assess body composition (13,53,54). Here we briely cite current and most commonly used methodology to assess fat distribution.
Clinical methods such as BMI and body adiposity index (BAI) make possible to estimate total body fat but not regional adiposity (55); waist circumference (WC), waist to hip ratio (WHR) and sagittal abdomi-nal diameter and bioimpedance may predict or estimate abdominal fat, but do not distinguish between SAT and VAT (1,12). Some authors propose that the “hypertri-glyceridemic waist” that combines WC and trygliceri-demia values could also predict visceral obesity. They showed that, in large studies, patients presenting values of both parameters above the cut-off references were more prone to metabolic risk and coronary disease (1). Computadorized tomography and MRI are current-ly the recommended methods to directcurrent-ly assess SAT, VAT and ectopic fat deposition. Magnetic resonance spectroscopy is the gold standard to evaluate ectopic fat deposition and positron emission computerized to-mography (PET/CT) is currently the gold standard to evaluate BAT. The validation to assess BAT by MRI is also under way (13). However, there is still no consen-sus of optimal cut-offs of fat measurements in those sites for predicting cardiometabolic risk.
Dual energy X-ray absorptiometry (DXA) and plethys mography precisely assess both total and region-al adiposity, and indirectly estimate viscerregion-al fat. Ultra-sound is suitable to estimate SAT and VAT, however due to the variability and subjectivity of the measure-ments of intraabdominal adiposity it is not currently recommended for VAT estimation (13,54).
INSULIN SENSITIVITY ASSESSMENT
Taking into account that insulin resistance is an im-portant link between adiposity and comorbidities, its assess ment becomes useful.
Severe insulin resistance, as seen in lipodystrophic syndromes, may be recognized in clinical grounds by phenotypical features at birth such as hypertrichosis, se-vere acanthosis nigricans, pseudoacromegalia or elf-like facies. However, the clinical recognition of milder insu-lin resistance may be more challenging and may require quantitative assessment (36).
Currently, the majority of the quantitative methods to assess insulin sensitivity are restricted to research set-tings. The ones considered reference techniques (eu-glycemic hyperinsulinemic clamp-EGC and frequent-sampling intravenous glucose tolerance test) pose important limitations to their use in clinical practice for they are costly, time consuming and/or technically demanding. Moreover, the gold standard method to assess IR, the EGC, is not fully “physiological” (56).
More feasible, cost-effective and convenient alter-natives to the reference methods have been proposed and, potentially could be used in routine clinical re-search (56). They are fasting or OGTT-derived indi-ces from insulin alone or along with glucose measure-ments (e.g. HOMA-IR, QUICKI etc.), fasting levels of SHBG, IGFBP-1, ratio leptin:adiponectin among others (57,58). However, some limitations of the aforemen-tioned indices are biological and analytical variability, interference of medications and dependency on glucose tolerance degree levels. Moreover, they lack validated cut-offs values for different populations and conditions. Therefore, their application is not currently recom-mended in clinical practice.
Some authors proposed decision rules, validated by EGC, to deine individuals with insulin resistance. They showed that BMI, WC, HOMA-IR, fasting plasma in-sulin and LDL cholesterol are strong predictors of IR. Using three different combinations of those clinical and laboratory measurements they were able to identify in-sulin-resistant individuals (mainly Caucasians and nor-mal-weight subjects) (59). However, the use of these decision rules in other clinical settings is still unknown.
Detailed description of methods to assess insulin sensitivity has been extensively described elsewhere (56,60).
CONCLUSION
Cop
yright
© ABE&M t
odos os dir
eit
os r
eser
vados
.
Considerable advancements in understanding the links binding the obesity, fat distribution abnormali-ties, insulin resistance and comorbidities have been achieved. Nonetheless, determination of validated, fea-sible and cost-effective tools to assess fat distribution and insulin sensitivity as well as safe and eficient tar-geted pharmacological interventions tackling the puta-tive mechanisms involve in this link are still warranted.
Disclosure: no potential conlict of interest relevant to this article was reported.
REFERENCES
1. Tchernof A, Despres JP. Pathophysiology of human visceral obe-sity: an update. Physiol Rev. 2013;93(1):359-404.
2. Vazquez G, Duval S, Jacobs DR Jr, Silventoinen K. Comparison of body mass index, waist circumference, and waist/hip ratio in predicting incident diabetes: a meta-analysis. Epidemiol Rev. 2007;29:115-28.
3. Fabbrini E, Sullivan S, Klein S. Obesity and nonalcoholic fatty liver disease: biochemical, metabolic, and clinical implications. Hepatology. 2010;51(2):679-89.
4. Kawai M, de Paula FJ, Rosen CJ. New insights into osteoporosis: the bone-fat connection. J Intern Med. 2012;272(4):317-29. 5. Després JP. Body fat distribution and risk of cardiovascular
dis-ease: an update. Circulation. 2012;126(10):1301-13.
6. Guebre-Egziabher F, Alix PM, Koppe L, Pelletier CC, Kalbacher E, Fouque D, et al. Ectopic lipid accumulation: a potential cause for metabolic disturbances and a contributor to the alteration of kid-ney function. Biochimie. 2013;95(11):1971-9.
7. Vague J. The degree of masculine differentiation of obesities: a factor determining predisposition to diabetes, atherosclerosis, gout, and uric calculous disease. 1956. Nutrition. 1999;15(1):89-90; discussion 1.
8. Ohlson LO, Larsson B, Svardsudd K, Welin L, Eriksson H, Wilhelm-sen L, et al. The inluence of body fat distribution on the incidence of diabetes mellitus. 13.5 years of follow-up of the participants in the study of men born in 1913. Diabetes. 1985;34(10):1055-8. 9. Peppa M, Koliaki C, Papaefstathiou A, Garolos E, Katsilambros
N, Raptis SA, et al. Body composition determinants of metabolic phenotypes of obesity in nonobese and obese postmenopausal women. Obesity (Silver Spring). 2013;21(9):1807-14.
10. Snijder MB, Visser M, Dekker JM, Goodpaster BH, Harris TB, Kritchevsky SB, et al. Low subcutaneous thigh fat is a risk fac-tor for unfavourable glucose and lipid levels, independently of high abdominal fat. The Health ABC Study. Diabetologia. 2005;48(2):301-8.
11. Zhang X, Hu EA, Wu H, Malik V, Sun Q. Associations of leg fat accumulation with adiposity-related biological factors and risk of metabolic syndrome. Obesity (Silver Spring). 2013;21(4):824-30. 12. Wajchenberg BL. Subcutaneous and visceral adipose tissue: their
relation to the metabolic syndrome. Endocr Rev. 2000;21(6):697-738. 13. Machann J, Horstmann A, Born M, Hesse S, Hirsch FW. Diag-nostic imaging in obesity. Best Pract Res Clin Endocrinol Metab. 2013;27(2):261-77.
14. Hayashi T, Boyko EJ, McNeely MJ, Leonetti DL, Kahn SE, Fujimoto WY. Visceral adiposity, not abdominal subcutaneous fat area, is associated with an increase in future insulin resistance in Japa-nese Americans. Diabetes. 2008;57(5):1269-75.
15. Preis SR, Massaro JM, Robins SJ, Hoffmann U, Vasan RS, Irlbeck T, et al. Abdominal subcutaneous and visceral adipose tissue and insulin resistance in the Framingham heart study. Obesity (Silver Spring). 2010;18(11):2191-8.
16. Tulloch-Reid MK, Hanson RL, Sebring NG, Reynolds JC, Prem-kumar A, Genovese DJ, et al. Both subcutaneous and visceral adipose tissue correlate highly with insulin resistance in african americans. Obes Res. 2004;12(8):1352-9.
17. Gallagher EJ, Leroith D, Karnieli E. Insulin resistance in obesity as the underlying cause for the metabolic syndrome. Mt Sinai J Med. 2010;77(5):511-23.
18. Prado CM, Wells JC, Smith SR, Stephan BC, Siervo M. Sarcope-nic obesity: a critical appraisal of the current evidence. Clin Nutr. 2012;31(5):583-601.
19. Jennings CL, Lambert EV, Collins M, Joffe Y, Levitt NS, Goede-cke JH. Determinants of insulin-resistant phenotypes in normal-weight and obese Black African women. Obesity (Silver Spring). 2008;16(7):1602-9.
20. Succurro E, Marini MA, Frontoni S, Hribal ML, Andreozzi F, Lau-ro R, et al. Insulin secretion in metabolically obese, but normal weight, and in metabolically healthy but obese individuals. Obe-sity (Silver Spring). 2008;16(8):1881-6.
21. Messier V, Karelis AD, Prud’homme D, Primeau V, Brochu M, Rabasa-Lhoret R. Identifying metabolically healthy but obese in-dividuals in sedentary postmenopausal women. Obesity (Silver Spring). 2010;18(5):911-7.
22. Dinges WL, Chen D, Snell PG, Weatherall PT, Peterson DM, Garg A. Regional body fat distribution in HIV-infected patients with li-podystrophy. J Investig Med. 2005;53(1):15-25.
23. Garg A. Clinical review#: lipodystrophies: genetic and acquired body fat disorders. J Clin Endocrinol Metab. 2011;96(11):3313-25. 24. Chen K, Xie Y, Hu P, Zhao S, Mo Z. Multiple symmetric lipoma-tosis: substantial subcutaneous adipose tissue accumulation did not induce glucose and lipid metabolism dysfunction. Ann Nutr Metab. 2010;57(1):68-73.
25. Herbst KL. Rare adipose disorders (RADs) masquerading as obe-sity. Acta Pharmacol Sin. 2012;33(2):155-72.
26. Medina-Gómez G. Mitochondria and endocrine function of adipose tissue. Best Pract Res Clin Endocrinol Metab. 2012;26(6):791-804. 27. Wu J, Cohen P, Spiegelman BM. Adaptive thermogenesis in
adi-pocytes: is beige the new brown? Genes Dev. 2013;27(3):234-50. 28. Gesta S, Tseng YH, Kahn CR. Developmental origin of fat: tracking
obesity to its source. Cell. 2007;131(2):242-56.
29. Sacks H, Symonds ME. Anatomical locations of human brown adipose tissue: functional relevance and implications in obesity and type 2 diabetes. Diabetes. 2013;62(6):1783-90.
30. Kershaw EE, Flier JS. Adipose tissue as an endocrine organ. J Clin Endocrinol Metab. 2004;89(6):2548-56.
31. Gil A, Olza J, Gil-Campos M, Gomez-Llorente C, Aguilera CM. Is adipose tissue metabolically different at different sites? Int J Pe-diatr Obes. 2011;6 Suppl 1:13-20.
32. Cinti S. Between brown and white: novel aspects of adipocyte differentiation. Ann Med. 2011;43(2):104-15.
33. Jo J, Gavrilova O, Pack S, Jou W, Mullen S, Sumner AE, et al. Hypertrophy and/or hyperplasia: dynamics of adipose tissue growth. PLoS Comput Biol. 2009;5(3):e1000324.
34. Zecchin HG, Carvalheira JBC, Saad MJA. Mecanismos molecu-lares de resitência à insulina na síndrome metabólica. Rev Soc Cardiol Estado de São Paulo. 2004;14(4):574-89.
35. Taniguchi CM, Emanuelli B, Kahn CR. Critical nodes in signal-ling pathways: insights into insulin action. Nat Rev Mol Cell Biol. 2006;7(2):85-96.
Cop
yright
© ABE&M t
odos os dir
eit
os r
eser
vados
.
37. Dunaif A. Insulin resistance and the polycystic ovary syndrome: mechanism and implications for pathogenesis. Endocr Rev. 1997;18(6):28.
38. Björntorp P. “Portal” adipose tissue as a generator of risk fac-tors for cardiovascular disease and diabetes. Arteriosclerosis. 1990;10(4):493-6.
39. Item F, Konrad D. Visceral fat and metabolic inlammation: the portal theory revisited. Obes Rev. 2012;13 Suppl 2:30-9.
40. Virtue S, Vidal-Puig A. Adipose tissue expandability, lipotoxicity and the metabolic syndrome--an allostatic perspective. Biochim Biophys Acta. 2010;1801(3):338-49.
41. Ader M, Stefanovski D, Kim SP, Richey JM, Ionut V, Catalano KJ, et al. Variable hepatic insulin clearance with attendant insu-linemia is the primary determinant of insulin sensitivity in the normal dog. Obesity (Silver Spring). 2013 Sep 30. PubMed PMID: 24123967. Epub 2013/10/15. Eng.
42. Home PD, Pacini G. Hepatic dysfunction and insulin insensitivity in type 2 diabetes mellitus: a critical target for insulin-sensitizing agents. Diabetes Obes Metab. 2008;10(9):699-718.
43. Kabir M, Catalano KJ, Ananthnarayan S, Kim SP, Van Citters GW, Dea MK, et al. Molecular evidence supporting the portal theory: a causative link between visceral adiposity and hepatic insulin resistance. Am J Physiol Endocrinol Metab. 2005;288(2):E454-61. 44. Lee MJ, Pramyothin P, Karastergiou K, Fried SK. Deconstructing the roles of glucocorticoids in adipose tissue biology and the development of central obesity. Biochim Biophys Acta. Biochim Biophys Acta. 2014;1842(3):473-81.
45. Lambert GW, Straznicky NE, Lambert EA, Dixon JB, Schlaich MP. Sympathetic nervous activation in obesity and the metabolic syndrome--causes, consequences and therapeutic implications. Pharmacol Ther. 2010;126(2):159-72.
46. Garg A. Adipose tissue dysfunction in obesity and lipodystrophy. Clin Cornerstone. 2006;8 Suppl 4:S7-S13.
47. Slawik M, Vidal-Puig AJ. Lipotoxicity, overnutrition and energy metabolism in aging. Ageing Res Rev. 2006;5(2):144-64.
48. Morelli M, Gaggini M, Daniele G, Marraccini P, Sicari R, Gastaldel-li A. Ectopic fat: the true culprit Gastaldel-linking obesity and cardiovascular disease? Thromb Haemost. 2013;110(4):651-60.
49. Ye J. Mechanisms of insulin resistance in obesity. Front Med. 2013;7(1):14-24.
50. Sakuma K, Yamaguchi A. Sarcopenic obesity and endocrinal ad-aptation with age. Int J Endocrinol. 2013;2013:204164.
51. Roberts CK, Hevener AL, Barnard RJ. Metabolic syndrome and in-sulin resistance: underlying causes and modiication by exercise training. Compr Physiol. 2013;3(1):1-58.
52. Bremer AA, Mietus-Snyder M, Lustig RH. Toward a unifying hy-pothesis of metabolic syndrome. Pediatrics. 2012;129(3):557-70. 53. Shuster A, Patlas M, Pinthus JH, Mourtzakis M. The clinical im-portance of visceral adiposity: a critical review of methods for visceral adipose tissue analysis. Br J Radiol. 2012;85(1009):1-10. 54. Thomas EL, Parkinson JR, Frost GS, Goldstone AP, Dore CJ,
McCar-thy JP, et al. The missing risk: MRI and MRS phenotyping of abdomi-nal adiposity and ectopic fat. Obesity (Silver Spring). 2012;20(1):76-87. 55. Bergman RN. A better index of body adiposity. Obesity (Silver
Spring, Md). 2012;20(6):1135. PubMed PMID: 22627975. Epub 2012/05/26. eng.
56. Borai A, Livingstone C, Kaddam I, Ferns G. Selection of the ap-propriate method for the assessment of insulin resistance. BMC Med Res Methodol. 2011;11:158.
57. Monzillo LU, Hamdy O. Evaluation of insulin sensitivity in clinical practice and in research settings. Nutr Rev. 2003;61(12):397-412. 58. Finucane FM, Luan J, Wareham NJ, Sharp SJ, O’Rahilly S, Balkau
B, et al. Correlation of the leptin:adiponectin ratio with measures of insulin resistance in non-diabetic individuals. Diabetologia. 2009;52(11):2345-9.
59. Stern SE, Williams K, Ferrannini E, DeFronzo RA, Bogardus C, Stern MP. Identiication of individuals with insulin resistance us-ing routine clinical measurements. Diabetes. 2005;54(2):333-9. 60. Geloneze B, Tambascia MA. [Laboratorial evaluation and